In the next series of this column, I will cover key biostatistics topics relevant to orthodontics. I will discuss types of variables, statistical inferences, and analytical approaches for qualitative and quantitative data. The focus will be on selecting the appropriate analysis depending on the data and objectives, and the interpretation of the findings. Orthodontic examples will be used throughout to help communicate the information.
When we use the term statistics, we usually mean 2 things: (1) the values (data points) we get when we measure (eg, amount of crowding) or count (eg, number of failed brackets), and (2) the methods or the procedures we follow to analyze the collected data, which can be analyzed with descriptive and inferential approaches.
In most situations, analyzing data requires both descriptive and inferential methods.
Descriptive methods describe a set of data. We use descriptive statistics to organize, summarize, and present data values using plots and tables.
Statistical inference uses methods of probability theory to make inferences about a population with data from a sample drawn from the target population. Because it would be impossible to collect information on the whole population of interest, we select a random and representative sample from the population, and we make inferences from the sample to the population. The results from this sample are subject to sampling variations, which means that if we did the study again, the results would be slightly different because of chance (random error). Statistics help us to decide how much difference can be attributed to chance and how much difference is the result of the intervention or treatment. Statistical analysis is an important part of our study; however, the methodology is more important. Obviously, an incorrect analysis can give the wrong results, but the data can be reanalyzed correctly. On the contrary, it will probably be impossible to repeat a study that was flawed at the design stage.
Types of variables
Variables are the characteristics of subjects or objects that can be either measured or placed into a category. When the variables can take a number of different values by chance, they are defined as random variables.
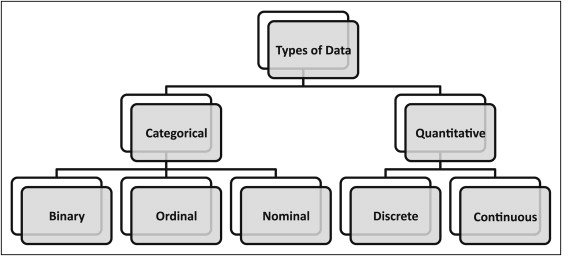
Variables are classified as either qualitative or quantitative. Qualitative (categorical) variables represent a characteristic of the subjects or objects that cannot be expressed naturally with a numeric value. Examples of qualitative variables include sex, hair or eye color, and type of adhesive used to bond brackets. Qualitative variables can be defined as binary or dichotomous with only 2 values (sex) or with more than 2 values in an ordered fashion (eg, pain perception after appliance insertion, adhesive remnant index, plaque index), and as nominal with unordered categories. Examples of nominal variables include race (black, white, Asian), Angle Class (Class I, Class II Division 1, Class II Division 2, Class III), and bracket type (conventional, lingual, self-ligating).
Quantitative (numeric) variables are naturally expressed with a numeric scale; examples include age, height, amount of dental crowding, and number of days to complete a stage of orthodontic treatment.
Quantitative variables can also be further classified as discrete or continuous. Discrete variables take only a limited number of values, usually whole numbers (integers); examples are numbers of erupted permanent teeth, bonded teeth, and quadrants in a patient’s mouth. Continuous variables take an infinite number of values, which are usually expressed with decimals; examples are age, height, and treatment time. Figure 1 displays a common classification of categories of data collected during a clinical trial.
Summarize and display categorical data
Data displays with tables and graphs are easy and efficient ways for describing and obtaining insight about the available information before further statistical analyses.
Categorical variables are readily displayed in a frequency table, with the counted observations in each category tabulated. For example, the Table summarizes the total bracket bond failures per arch and arch segment for 2 self-etching primers. This example includes 4 categories (maxilla, mandible, and anterior and posterior segments), and the failures per category are tabulated. The counts and percentages list the frequencies and the relative frequencies (the denominator was the total number of brackets bonded).


