Introduction
Previous research has demonstrated that current methods of informed consent are relatively ineffective as shown by poor recall and comprehension by adolescent patients and their parents. The purpose of this study was to determine whether adding a short videotape presentation reiterating the issues related to informed consent to a modified informed consent document that emphasizes a limited number of core and patient-specific custom “chunks” at the beginning of an informed consent presentation improved the recall and comprehension of the risks, benefits, and alternatives of orthodontic treatment. A second objective was to evaluate the current related data for recommendable practices.
Methods
Seventy patient-parent pairs were randomly divided into 2 groups. The intervention group (group A) patients and parents together reviewed a customized slide show and a short videotape presentation describing the key risks of orthodontic treatment. Group B followed the same protocol without viewing the videotape. All patients and parents were interviewed independently by research assistants using an established measurement tool with open-ended questions. Interviews were transcribed and scored for the appropriateness of responses using a previously established codebook. Lastly, the patients and parents were given 2 reading literacy tests, 1 related to health and 1 with general content followed by the self-administered demographic and psychological state questionnaires.
Results
There were no significant differences between the groups for sociodemographic variables. There were no significant differences between the groups for overall recall and comprehension; recall and comprehension for the domains of treatment, risk, and responsibility; and recall and comprehension for core, general, and custom items. The positional effects were limited in impact. When compared with previous studies, these data further demonstrate the benefit of improved readability and audiovisual supplementation with the addition of “chunking.”
Conclusions
There is no benefit to adding a short video to the previously established improved readability and audiovisual supplementation. There is a significant benefit of improved readability and audiovisual slide supplementation with the addition of “chunking” over traditional informed consent methods in terms of patient improvement in overall comprehension, treatment recall, and treatment comprehension. The treatment domain is the most affected.
Highlights
- •
We investigated adding a short videotape that reiterated consent issues.
- •
Core issues and patient-specific “chunks” were presented first.
- •
Current related data for recommendable practices also were evaluated.
- •
There was no benefit in a reiterative short video to a previously improved method.
- •
Improved readability and audiovisual supplementation with chunking improve consent.
Informed consent, one aspect of decision making in health care, including orthodontics, has experienced a shift from a paternalistic model to one driven by patient autonomy. The duty of providing information regarding risks, benefits, and alternatives to treatment falls on the health care provider, who is “obligat[ed] to communicate truthfully and effectively” when presenting the choices to patients.
Health literacy, “the degree to which individuals have the capacity to obtain, process and understand basic health information and services needed to make appropriate health decisions,” plays a pivotal role in the informed consent process and is low in the United States. These low rates are linked to, among other things, poor oral health.
Health care providers often rely on written education materials to present consent information to their patients, and many are written beyond the average reading level of 8th to 9th grade in the United States, making them difficult to understand. A consenting patient or parent who does not understand the treatment and its risks, benefits, and alternatives has not given valid “informed” consent, which may have legal implications.
Previous studies examining the medical informed consent process consistently have demonstrated low comprehension of the information presented. At the same time, subjects also tend to overestimate their understanding when compared with other assessors’ measures. Methods to improve understanding of consent information have been explored. Understanding among parents of children undergoing elective surgical procedures was greatly improved with a modified informed consent document. The modified form was changed to meet the lower target reading levels in addition to eliminating dense paragraphs in exchange for bullet points, boldface type and underlining for emphasis, and a column format for reading ease. The authors of another study with a videotape to provide surgical patients with informed consent information found that it significantly increased their comprehension when compared with verbal explanations, especially in those with lower education levels. When 2400 patients undergoing elective surgery, a significant surgery, or an elective diagnostic procedure were exposed to an interactive and illustrated online educational tool, Emmi solutions (Chicago, Ill), they demonstrated increased risk awareness, increased confidence in the provider, and increased understanding of the specifics of the treatment or procedure.
Similar trends of poor understanding of consent information have been seen in orthodontics. In 2003, investigators found that both children and their parents recalled considerably fewer reasons for treatment as well as risks of treatment than were explained by the orthodontist. Another study found that low-income and ethnic-minority children and their parents recalled significantly fewer reasons for treatment, orthodontic procedures to expect, risks associated with treatment, and responsibilities of the child during treatment than were described in the case presentation.
Although not a major focus of malpractice claims, orthodontics accounts for approximately 4% of claims according to a 2006 survey and must be taken seriously for risk management purposes. Ways to improve the informed consent process in orthodontics have been explored. In a study by Kang et al, a modified informed consent document combined with a computer-based slide show resulted in better recall and comprehension rates when compared with groups presented with the standard American Association of Orthodontics (AAO) form or the modified informed consent document alone. Carr et al expanded on that research and used the principle of “chunking,” presenting like concepts together, as described by Doak et al. Information was presented from general to specific in the computer-based slide show. It was shown that subjects best understood the informed consent elements presented at the beginning or the end of the slide show. Carr et al also used a verbal explanation of the modified informed consent in 1 group and found some benefits.
Based on these studies, additional modifications to these newly developed procedures may improve the informed consent process even further. Placing the most important information first in the slide show could further improve the recall and comprehension rates. An audiovisual presentation as an alternative to the standard verbal explanation may support better understanding as well. The purpose of this study was to determine whether modified informed consent documents with emphasis on a limited number of core and custom issues at the beginning of an informed consent presentation, with the addition of a short videotaped presentation that reiterated the issues related to informed consent, could improve the recall and comprehension of the risks, benefits, and alternatives related to orthodontic treatment. By adjusting the already-proven novel approach and depending on the outcome of the study, it might be possible to shorten the informed consent process and not sacrifice recall and comprehension. A further purpose was to statistically compare the current and relevant previous studies to determine sound directions for implementation of informed consent.
Material and methods
The research protocols—study 1, which compared the 2 interventions, and study 2, which compared a current intervention with similar previous studies—were reviewed and approved by the institutional review board of Ohio State University.
In study 1, new patients planned for comprehensive treatment in the graduate orthodontic clinic at Ohio State University’s dental college were recruited to participate at the time of initial records or via telephone call before their consultation appointment. All patients met the following inclusion criteria as previously described by Carr et al : 12 to 18 years of age, no previous orthodontic treatment, no sibling or immediate relative previously treated in the clinic, accompanied by a parent or legal guardian for at least 1 year, both patients and parents able to communicate in English, and no developmental disabilities or urgent medical conditions.
With a nondirectional alpha risk of 0.05 and assuming a standard deviation (SD) of 19.3 (Carr et al ), a sample size of 35 subjects per group was required to demonstrate a difference of 15 percentage points in on-target responses with a power of 0.893. Patient-parent pairs were randomly allocated to the 2 intervention groups using a random number generator based on atmospheric noise. Because of 1 withdrawal in midstudy, group A consisted of 34 patient-parent pairs, and group B consisted of 35 patient-parent pairs.
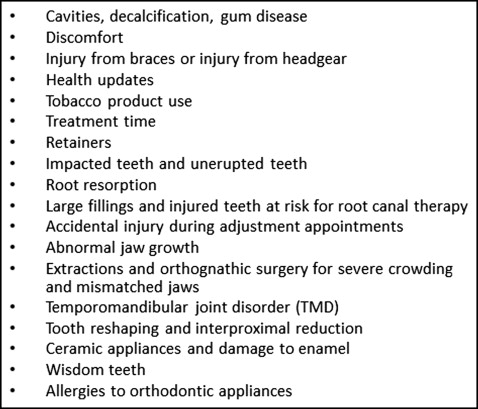
The original slide show (PowerPoint version 2003; Microsoft, Redmond, Wash), containing audio and visual cues for the 18 elements of informed consent ( Fig ), was developed by Kang et al. Carr et al modified the slide show and presented “chunks” of information. Our study provided the chunks in the following order: (1) the 4 most common core risks of orthodontic treatment according to the literature: enamel decalcification and gum disease, external root resorption, pain, and retention or relapse ; (2) up to 4 custom patient-specific risk factors as determined by the treating orthodontist (eg, need for interproximal reduction or abnormal jaw growth); and (3) all other remaining general risk factors.
Research assistants were trained in the research procedures. Interviews were conducted using a script that incorporated a previously validated measurement tool. Based on the 18 elements of informed consent in the AAO document, the open-ended questions were designed to better assess recall and comprehension. Knowledge-based questions (eg, “what are the risks to the teeth and gums with braces on?”) measured recall. Scenario-based questions (eg, “Amy just got her braces, and her teeth are sore. What would you do?”) measured comprehension. Interviewers repeated and rephrased questions as needed but were instructed not to lead subject responses. Four recall questions were rephrased and repeated to assess subject reliability.
For groups A and B, the orthodontic resident first reviewed the recommended treatment plan and any alternatives and answered all questions concerning treatment. Patients and parents in both groups then viewed the customized computer-based slide show. Group A subjects also viewed a video presentation summarizing the 18 elements of informed consent, designed to standardize the verbal explanation used in the study by Carr et al. All subjects then participated in the recorded interview with the research assistants.
Two measurements of literacy were used for all subjects: the reading portion of the Wide Range Achievement Test 3 (WRAT 3) (Wide Range in cooperation with the Peer Assessment Rating index, Lutz, Fla) and the Rapid Estimate of Adult Literacy in Medicine (REALM) (Terry Davis, Louisiana State University Medical Center, Shreveport). These instruments allowed for assessment of overall reading ability and health literacy levels, respectively.
All subjects self-administered a questionnaire to provide sociodemographic data. The questionnaire also included a visual analog scale (VAS) of 0 to 10 cm for self-assessment of understanding of the risks, benefits, and limitations of orthodontic treatment and a condensed 6-question inventory used to measure state anxiety levels (State-Trait Anxiety Inventory [STAI]-6). Patients then received a $10 gift card in recognition of their time of participation.
The recorded interviews were transcribed and blindly scored using a codebook of key words and phrases signifying correct recall and comprehension responses previously developed by Kang et al and used by both them and Carr et al. One rater (C.E.P.) was used in this study and received extensive training by the previous rater to ensure proficiency when scoring the interviews. For final data evaluation, the answers were coded as on-target or correct, or wrong. Interrater reliability was measured by scoring 10 randomly selected patient and parent interviews and comparing these scores with those completed by a previous rater in another study. Rescoring the same 10 patient and parent interviews 2 weeks later and comparing them with the previous scores measured intrarater reliability.
In study 2, to facilitate discussion of the results of our study with similar previous studies, our results were compared through a combined analysis with selected intervention groups from those of Kang et al and Carr et al. Although these study groups have some differences in their demographics, they are for the most part highly comparable and are reported in the Results; all studies were performed in the same clinical setting with similar procedures. These combined results provide a context for discussion of the usefulness of the modified interventions that have been recently tested.
Among the study comparisons, group B from this study was used because there were no between-group differences for groups A and B, and it represented a more streamlined consent process with a readable form, audiovisual supplementation, and “chunked” issue presentation from specific to general. Group C was the AAO consent group from the study of Kang et al, arguably the most common method used in orthodontic practices in the United States. Group D was the slide show and modified informed consent group from the study of Kang et al; this group used a more readable form and supplemental audiovisual presentation. Group E was the group with the custom slide show without verbal explanation from the study of Carr et al. This represented a readable form, supplemental audiovisual materials, and a “chunk” issue presentation from general to specific.
Statistical analysis
Simple kappa statistics with 95% confidence intervals (CIs) were calculated for interrater (Carr et al vs our study), intrarater, and subject reliabilities. Descriptive statistics were calculated for sociodemographic data, WRAT 3 scores, REALM scores, STAI-6 scores, and VAS self-assessment scores.
Between-group differences (A vs B, and B vs C vs D vs E) were calculated based on the following methods: (1) analysis of variance for age; VAS self-assessment scores; mean percentages of on-target responses for overall recall and overall comprehension; and the domains of treatment recall, risk recall, responsibility recall, core recall, general recall, custom recall, treatment comprehension, risk comprehension, responsibility comprehension, core comprehension, general comprehension, and custom comprehension; (2) the Mann-Whitney-Wilcoxon test for WRAT 3, REALM, and STAI-6 scores; and (3) the chi-square test for sex and the Fisher exact test for ethnic group and grade. Spearman correlation coefficients with P values corrected for multiple comparisons by the step-down Bonferroni method of Holm were used to calculate the correlations between REALM, WRAT 3, STAI-6, and VAS self-assessment scores and various outcome variables. Unlike the simple Bonferroni method, which is overly conservative, the Holm method uses a step-down procedure that increases the power of the test and thereby reduces the probability of false rejections. Chi-square tests were used to evaluate positional differences between custom and general issues. An alpha level of 0.05 was selected.
Results
In study 1 (comparing groups A and B), interrater and intrarater reliabilities for scoring interview data were excellent: kappa = 0.86 (95% CI, 0.83-0.86) and kappa = 0.99 (95% CI, 0.97-01.0), respectively.
Subject reliability ( Table I ) for the children was fair to moderate, with kappa values ranging from 0.30 to 0.47 and an overall kappa score of 0.41. The overall kappa score for parents was also 0.41; however, the kappa score range was larger (0.17-0.70), resulting in slight to substantial reliability.
| Question | Parent kappa (CI) ∗ | Reliability | Patient kappa (CI) ∗ | Reliability |
|---|---|---|---|---|
| Retainers | 0.17 (−0.21 to 0.55) | Slight | 0.32 (0.06-0.58) | Fair |
| Health updates | 0.24 (−0.10 to 0.58) | Fair | 0.30 (0.09-0.52) | Fair |
| TMJ/TMD | 0.70 (0.53-0.88) | Substantial | 0.52 (0.29-0.75) | Moderate |
| Ankylosis | 0.13 (−0.09 to 0.34) | Slight | 0.47 (0.27-0.66) | Moderate |
There were no significant differences between groups A and B for sex, age, ethnicity, grade or education level, or WRAT 3, REALM, and STAI-6 scores ( Table II ).
| Subject | Group | Sex ∗ (%) | Age † mean (y [SD]) | Education level ‡ (median) | Ethnicity ‡ (%) | REALM § (median) | WRAT 3 § (median) | STAI-6 § (median) | Self assessment/understanding (mean [SD]) VAS † |
|---|---|---|---|---|---|---|---|---|---|
| Patients | Patients A (n = 34) |
54.3 F 45.7 M |
14.5 (1.8) | 8th grade | 68.8 WNH 15.6 BNH 6.3 mixed 3.1 WH, SA, EA |
7th to 8th grade | 8th grade | 10.0 | 7.75 (1.9) |
| B (n = 35) | 42.9 F 57.1 M |
14.4 (1.6) | 8th grade | 60.0 WNH 17.2 EA 11.4 BNH, WH |
7th to 8th grade | High school | 9.0 | 7.54 (1.65) | |
| C (n = 31) | 71.0 F 29.0 M |
14.3 (1.6) | 8th grade | 62.1 WNH 13.8 WH 13.8 BNH 10.3 mixed |
7th to 8th grade | 2nd grade | 10.0 | 7.71 (1.8) | |
| D (n = 30) | 43 F 57 M |
14.6 (1.7) | 8th grade | 73.3 WNH 20.0 BNH 3.3 WH 3.3 mixed |
High school | High school | 10.0 | 7.46 (1.7) | |
| E (n = 40) | 55 F 45 M |
14.3 (1.6) | 8th grade | 72.5 WNH 17.5 BNH 7.5 mixed 2.5 WH |
High school | High school | 9.5 | 8.30 (1.69) | |
| P value | 0.0839 | 0.8801 | 0.7141 | <0.0001 | 0.5586 | <0.0001 | 0.9269 | ||
| Parents | Parents A (n = 34) |
67.7 F 32.3 M |
44.7 (10.5) | 4 years college | 69.7 WNH 9.1 BNH, mixed 3.0 BH, WH, SA, EA |
High school | Post-high school | 9.0 | 9.65 (1.25) |
| B (n = 35) | 82.9 F 17.1 M |
45.9 (9.0) | <4 years college | 65.7 WNH 14.3 BNH, WH 5.7 mixed |
High school | Post-high school | 10.0 | 8.7 (1.28) | |
| C (n = 31) | 74.2 F 25.8 M |
43.0 (7.2) | <4 yearscollege | 19.4 WNH, WH 16.1 EA 6.5 BNH, BH, SA |
High school | 3rd grade | 8.0 | 8.24 (2.6) | |
| D (n = 30) | 80.0 F 20.0 M |
42.0 (6.6) | <4 years college | 73.3 WNH 20.0 BNH 3.3 WH, mixed |
High school | High school | 7.0 | 9.02 (1.09) | |
| E (n = 40) | 80.0 F 20.0 M |
43.8 (8.2) | <4 years college | 75.0 WNH 17.5 BNH 5.0 WH 2.5 mixed |
High school | High school | 9.0 | 9.17 (0.94) | |
| P value | 0.8530 | 0.2458 | 0.4025 | <0.0001 | 0.3727 | <0.0001 | 0.4074 | <0.05 |
∗ Calculated by the chi-square test.
† calculated by analysis of variance.
The results for the mean percentages of correct responses showed no significant differences between groups A and B for the patients, 51.5% (SD, 20.3%) to 55% (SD, 14.7%), or the parents, 66.0% (SD, 13.7%) to 71.5% (SD, 14.4%), in the following categories: overall recall and overall comprehension; the domains of treatment recall, risk recall, responsibility recall, treatment comprehension, risk comprehension, and responsibility comprehension for the patients, 38.4% (SD, 18.8%) to 69.8% (SD, 18.6%), or the parents, 53.6% (SD, 22.2%) to 87.8% (SD, 14.3%), and core recall, general recall, custom recall, core comprehension, general comprehension, and custom comprehension for the patients, 30.8% (SD, 33.3%) to 69.4% (SD, 23.0%), or the parents, 37.2% (SD, 36.5%) to 84.5% (SD, 14.9%).
Groups A and B data were combined for chi-square tests to analyze positional effects because there were no group differences. For the patients, the percentages of correct comprehension responses regarding extractions and orthognathic surgery for severe crowding and mismatched jaws were much improved when presented earlier as a custom issue (positions 4-8) vs as a later general issue (position 13) (38.9% vs 8.0%; P = 0.0137). For the parents, a similar trend was seen for the percentages of correct comprehension responses regarding large fillings and injured teeth that may require root canal therapy as a custom issue (positions 4-8) vs a general issue (position 14) (69.2% custom vs 25.6% general; P = 0.0015). No other positional differences for recall or comprehension were found.
Groups A and B data again were combined for correlation calculations because there were no group differences. WRAT 3 scores were positively correlated with the percentage of correct responses for overall recall among patients (r (Spearman) = 0.39, P = 0.0256). The VAS self-assessment scores were positively correlated with the percentages of correct responses for core recall and general comprehension among the parent group (r (Spearman) = 0.40, P = 0.0186; r (Spearman) = 0.44, P = 0.0064). No significant correlations were seen between the REALM and STAI-6 scores.
In study 2, we compared groups B, C, D, and E. Groups B, D, and E were comparable for sociodemographics, WRAT 3, REALM, STAI-6, and VAS self-assessment scores. There were significant differences in WRAT 3 scores, with group C having significantly lower literacy levels (second grade vs eighth grade for patients; third grade vs high school to post-high school for parents). There were also significant differences in the ethnicity distribution in group C.
Further comparisons of the overall on-target recall and comprehension, on-target responses for consent domains, and on-target responses for recall and comprehension of core, custom, and general issues are in Tables III-V , respectively.
| Mean (SD) | P values | |||||||||
|---|---|---|---|---|---|---|---|---|---|---|
| Group B | Group C | Group D | Group E | B vs C | B vs D | B vs E | C vs D | C vs E | D vs E | |
| Patients | ||||||||||
| Overall recall | 54.1 (14.0) | 42.3 (13.0) | 52.6 (14.4) | 57.4 (13.4) | 0.0035 ∗ | 0.9730 | 0.7207 | 0.0194 ∗ | <0.0001 ∗ | 0.4708 |
| Overall comp | 52.3 (16.0) | 37.9 (13.6) | 44.1 (16.7) | 53.6 (13.3) | 0.0006 ∗ | 0.1225 | 0.9828 | 0.3332 | <0.0001 ∗ | 0.0450 ∗ |
| Parents | ||||||||||
| Overall recall | 70.1 (11.9) | 58.1 (15.6) | 67.3 (16.8) | 70.6 (13.9) | 0.0049 ∗ | 0.8557 | 0.9987 | 0.0650 | 0.0021 ∗ | 0.7681 |
| Overall comp | 68.6 (13.0) | 54.7 (17) | 66.3 (16.6) | 69.2 (15.2) | 0.0017 ∗ | 0.9333 | 0.9976 | 0.0170 ∗ | 0.0006 ∗ | 0.8573 |
∗ Statistically significant difference as indicated by P <0.05.
| Mean (SD) | P values | |||||||||
|---|---|---|---|---|---|---|---|---|---|---|
| Group B | Group C | Group D | Group E | B vs C | B Vs D | B vs E | C vs D | C vs E | D vs E | |
| Patients | ||||||||||
| Tx recall | 50.2 (20.4) | 28.5 (19.4) | 36.7 (22.9) | 48.9 (19.0) | 0.0001 ∗ | 0.0378 ∗ | 0.9828 | 0.3875 | 0.0002 ∗ | 0.0602 |
| Risk recall | 59.4 (22.3) | 39.0 (21.7) | 51.3 (20.3) | 52.4 (18.5) | 0.0005 ∗ | 0.3863 | 0.9928 | 0.0905 | 0.0014 ∗ | 0.0638 |
| Resp recall | 60.7 (18.3) | 57.8 (20.2) | 70.7 (18.3) | 68.6 (18.5) | 0.9171 | 0.1371 | 0.9749 | 0.0359 ∗ | 0.0749 | 0.9638 |
| Tx comp | 47.0 (25.6) | 18.0 (16.7) | 32.7 (23.8) | 39.0 (20.0) | <0.0001 ∗ | 0.0394 ∗ | 0.2625 | 0.0422 ∗ | 0.0004 ∗ | 0.6190 |
| Risk comp | 38.4 (18.8) | 28.2 (17.9) | 28.1 (19.7) | 38.9 (18.5) | 0.1148 | 0.1147 | 0.3660 | 1.000 | 0.0742 | 0.0745 |
| Resp comp | 69.8 (18.6) | 61.1 (20.2) | 68.2 (23.0) | 78.2 (15.5) | 0.2474 | 0.9859 | 0.9993 | 0.4625 | 0.0013 ∗ | 0.1310 |
| Parents | ||||||||||
| Tx recall | 70.1 (19.7) | 46.3 (21.9) | 62.3 (24.5) | 62.1 (27.0) | 0.0003 ∗ | 0.5379 | 0.4469 | 0.0393 ∗ | 0.0266 ∗ | 1.000 |
| Risk recall | 65.7 (17.4) | 57.2 (15.6) | 66.0 (22.0) | 69.6 (19.3) | 0.2465 | 0.9999 | 0.7972 | 0.2463 | 0.0288 ∗ | 0.8573 |
| Resp recall | 80.0 (15.8) | 77.0 (22.1) | 80.5 (17.8) | 80.8 (15.9) | 0.9002 | 0.9995 | 0.9963 | 0.8646 | 0.7924 | 0.9997 |
| Tx comp | 57.0 (18.6) | 29.8 (21.3) | 56.4 (24.1) | 59.6 (26.4) | <0.0001 ∗ | 0.9996 | 0.9563 | <0.0001 ∗ | <0.0001 ∗ | 0.9340 |
| Risk comp | 57.2 (18.7) | 46.2 (21.9) | 52.2 (21.1) | 57.5 (20.5) | 0.1232 | 0.7526 | 0.9999 | 0.6460 | 0.0932 | 0.7015 |
| Resp comp | 87.8 (14.3) | 78.8 (22.1) | 87.0 (18.3) | 86.8 (13.1) | 0.1372 | 0.9877 | 0.9945 | 0.2291 | 0.1954 | 1.000 |
Stay updated, free dental videos. Join our Telegram channel
VIDEdental - Online dental courses


