Introduction
The maxillary anterior teeth are the most important to facial esthetics because they are the first to show on a smile. Therefore, stability of the maxillary anterior teeth alignment is an important issue. The objective of this study was to compare the stability of maxillary anterior tooth alignment in Class I and Class II Division 1 malocclusions.
Methods
The sample comprised dental casts of 70 patients with Class I and Class II Division 1 malocclusions and a minimum of 3 mm of maxillary anterior crowding measured by an irregularity index. The patients were treated with extractions and evaluated at pretreatment and posttreatment and at least 5 years after treatment. The sample was divided into 3 groups: group 1, Class I malocclusion treated with 4 first premolar extractions comprising 30 subjects, with an initial age of 13.16 years and 8.59 mm of initial maxillary irregularity; group 2, Class II malocclusion treated with 4 first premolar extractions comprising 20 subjects, with an initial age of 12.95 years and 11.10 mm of maxillary irregularity; and group 3, Class II malocclusion treated with 2 first maxillary premolar extractions comprising 20 subjects, with an initial age of 13.09 years and 9.68 mm of maxillary irregularity.
Results
The decrease in the maxillary irregularity index was significantly greater in group 2 than in group 1 during treatment. The stability of maxillary anterior alignment was 88.12% over the long term; 77% of the linear displacement of the anatomic contact points tended to return to their original positions.
Conclusions
Stability of maxillary anterior alignment between the 3 groups was similar. The stability of maxillary anterior alignment was high over the long term, but a high percentage of teeth tended to return to their original positions.
Esthetic treatments are common nowadays because concern with facial appearance has greatly increased in the last decades. Alignment of the maxillary anterior teeth is especially important for an esthetic smile, since they are the first to show. Many patients seek orthodontic treatment to align these teeth.
Correct orthodontic treatment improves facial esthetics as well as the occlusion, but long-term stability of the aligned teeth is highly variable and unpredictable. Greater research emphasis has been placed on relapse of mandibular anterior crowding probably because alignment stability of these teeth is less than that of the maxillary anterior teeth. Nevertheless, little emphasis has been given to investigating the direction of relapse.
Patients tend to judge orthodontic treatment success primarily by maxillary anterior tooth alignment. Therefore, long-term stability investigations of maxillary anterior tooth alignment have become important in orthodontics.
Because of insufficient studies on maxillary anterior tooth alignment, the objectives of this investigation were to evaluate the amount and direction of relapse of maxillary anterior crowding in different extraction protocols, compare the relapse amounts in Class I and Class II Division 1 malocclusions, and evaluate possible relationships between crowding relapse and intercanine, interpremolar, and intermolar widths, arch lengths, and amounts of initial maxillary anterior crowding.
Material and methods
The sample was retrospectively selected from over 4500 patient records treated by graduate students in the Department of Orthodontics at Bauru Dental School, University of São Paulo, Brazil. The selection criteria were patients under 15 years of age at pretreatment (T1), with all permanent teeth erupted up to the first molars; no supernumerary teeth or tooth agenesis; Class I or Class II Division 1 malocclusion of at least three-quarter cusp Class II molar relationship; and more than 3 mm of crowding on Little’s irregularity index in the mandible (LIIMx). The patients also had a maximum peer assessment rating (PAR) score of 5 at posttreatment (T2), and balanced faces and passive lip seal. Subjects with anterior open bite or crossbite malocclusion were not included. Therefore, the sample comprised 70 patients divided into 3 groups, evaluated at 3 stages: T1, T2, and postretention (T3). Thirty had Class I and 40 had Class II Division 1 malocclusions (5 had three-quarter cusp, and 65 had full-cusp Class II molar relationships).
Group 1 comprised 30 patients (12 boys, 18 girls) with Class I malocclusion treated with 4 first premolar extractions. Mean initial maxillary anterior crowding, initial age, and treatment time were 8.59 mm (SD, 3.08), 13.16 years (SD, 0.97), and 1.99 years (SD, 0.51), respectively.
Group 2 consisted of 20 patients (11 boys, 9 girls) with Class II Division 1 malocclusion treated with 4 first premolar extractions. Mean initial maxillary anterior crowding, initial age, and treatment time were 11.10 mm (SD, 4.46), 12.95 years (SD, 1.08), and 2.48 years (SD, 0.72), respectively.
Group 3 comprised 20 patients (9 boys, 11 girls) with Class II Division 1 malocclusions treated with 2 maxillary first premolar extractions. Mean initial maxillary anterior crowding, initial age, and treatment time were 9.68 mm (SD, 4.00), 13.09 years (SD, 1.11), and 2.05 years (SD, 0.45), respectively.
All patients were treated with fixed edgewise appliances. Anterior retraction was performed by sliding mechanics with elastic chains. All patients used an extraoral appliance for anchorage reinforcement, as needed, during active treatment. No patient underwent interproximal stripping, rapid maxillary expansion, or fiberotomy as part of the treatment plan. Class II elastics were used when necessary, especially in the Class II malocclusion patients treated with 4 maxillary premolar extractions. Retention included a maxillary Hawley plate and a bonded lingual canine-to-canine retainer in the mandibular arch.
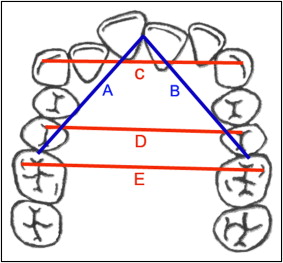
The assessed variables consisted of LIIMx, arch length (AL), intercanine width (ICW), interpremolar width (IPW), and intermolar width (IMW) ( Figs 1 and 2 ). All dental cast measurements were made with a 0.01-mm precision digital caliper (Mitutoyo America, Aurora, Ill) by the same examiner (C.L.Q.).
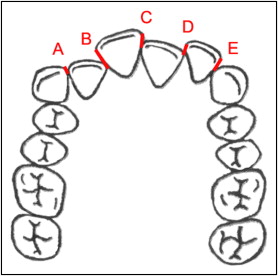
To investigate the direction of relapse, each linear displacement of the anatomic contact points was separately evaluated at T1 and T3 in the maxillary arch. The contact points (A, B, C, D, and E) were evaluated by taking into account the direction of each anterior tooth in relation to its adjacent tooth (labial or lingual).
The relapse percentage was calculated as the ratio between the relapse and the correction amounts. To analyze whether the percentage of relapse was associated with the amount of initial crowding, the whole sample was divided into 2 subgroups according to initial crowding. Subgroup A comprised patients with LIIMx scores less than 7 mm, or minimal and moderate irregularity (19 patients), and subgroup B had LIIMx scores equal to or greater than 7 mm, or severe and very severe irregularity (51 patients).
A month after the first measurements, randomly selected dental casts of 15 patients (21% of the whole sample) were remeasured by the same examiner (C.L.Q.) in all stages (T1, T2, and T3). Casual errors were calculated according to Dahlberg’s formula ( SE2=∑d2/2n
S E 2 = ∑ d 2 / 2 n
), where SE 2 is the error variance and d is the difference between 2 determinations of the same variable. Systematic errors were evaluated with dependent t tests at P <0.05.
Statistical analysis
Normal distribution was verified by the Kolmogorov-Smirnov test. The results were nonsignificant for all variables.
Intergroup sex distribution was evaluated with the chi-square test; intergroup comparisons of age, treatment, retention, posttreatment, and postretention observation times, and initial and final LIIMx scores were made with 1-way analysis of variance (ANOVA), followed by Tukey tests when necessary. These last tests were also used to evaluate intergroup comparisons of LIIMx scores, AL, and ICW, IPW, and IMW at T1, T2, and T3, and their treatment (T2-T1) and posttreatment (T3-T2) changes.
Pearson correlation coefficients were used to assess the relationships of LIIMx scores at different stages with the other variables, and the relationships between linear displacements of the anatomic contact points at T1 and T3. The percentages of teeth that kept the same labiolingual direction at T1 and T3 were calculated.
The relapse percentages in subgroups A and B were compared with t tests. All statistical analyses were performed with Statistica software (version 6.0, Statsoft, Tulsa, Okla), and the results were considered significant at P <0.05.
Results
No variable showed a casual error greater than 1 mm. Among 30 variables, only width D at T2 showed a statistically significant systematic error ( Table I ).
| Variable | Measurement 1 | Measurement 2 | Dahlberg | P | ||
|---|---|---|---|---|---|---|
| Mean | SD | Mean | SD | |||
| A at T1 | 2.67 | 1.55 | 2.66 | 1.52 | 0.127 | 0.848 |
| B at T1 | 2.10 | 1.29 | 2.08 | 1.25 | 0.118 | 0.779 |
| C at T1 | 1.10 | 1.19 | 1.08 | 1.11 | 0.106 | 0.635 |
| D at T1 | 1.08 | 0.93 | 1.05 | 0.92 | 0.059 | 0.181 |
| E at T1 | 2.58 | 1.89 | 2.53 | 1.87 | 0.083 | 0.147 |
| LIIMx at T1 | 9.52 | 4.29 | 9.40 | 4.16 | 0.286 | 0.285 |
| AL at T1 | 72.24 | 4.35 | 72.26 | 4.24 | 0.616 | 0.955 |
| ICW at T1 | 35.04 | 1.72 | 34.91 | 1.88 | 0.436 | 0.431 |
| IPW at T1 | 37.28 | 1.92 | 37.39 | 1.97 | 0.232 | 0.222 |
| IMW at T1 | 48.84 | 2.61 | 48.87 | 2.56 | 0.197 | 0.705 |
| A at T2 | 0.05 | 0.10 | 0.05 | 0.07 | 0.034 | 0.608 |
| B at T2 | 0.18 | 0.29 | 0.19 | 0.22 | 0.116 | 0.964 |
| C at T2 | 0.09 | 0.15 | 0.06 | 0.10 | 0.047 | 0.098 |
| D at T2 | 0.16 | 0.25 | 0.10 | 0.18 | 0.078 | 0.034 ∗ |
| E at T2 | 0.20 | 0.25 | 0.18 | 0.24 | 0.065 | 0.424 |
| LIIMx at T2 | 0.69 | 0.48 | 0.58 | 0.30 | 0.182 | 0.091 |
| AL at T2 | 62.68 | 2.46 | 62.75 | 2.36 | 0.574 | 0.737 |
| ICW at T2 | 34.69 | 1.81 | 34.77 | 1.72 | 0.192 | 0.265 |
| IPW at T2 | 36.64 | 2.08 | 36.61 | 2.03 | 0.160 | 0.671 |
| IMW at T2 | 48.50 | 2.92 | 48.56 | 2.80 | 0.169 | 0.333 |
| A at T3 | 0.25 | 0.40 | 0.22 | 0.34 | 0.085 | 0.275 |
| B at T3 | 0.32 | 0.36 | 0.32 | 0.35 | 0.081 | 0.813 |
| C at T3 | 0.31 | 0.36 | 0.26 | 0.27 | 0.086 | 0.104 |
| D at T3 | 0.38 | 0.45 | 0.31 | 0.37 | 0.113 | 0.081 |
| E at T3 | 0.42 | 0.65 | 0.36 | 0.63 | 0.152 | 0.152 |
| LIIMx at T3 | 1.69 | 1.47 | 1.47 | 1.23 | 0.069 | 0.069 |
| AL at T3 | 61.48 | 2.22 | 61.38 | 2.40 | 0.960 | 0.961 |
| ICW at T3 | 34.65 | 1.70 | 34.65 | 1.75 | 0.151 | 0.151 |
| IPW at T3 | 35.62 | 2.33 | 35.72 | 2.21 | 0.472 | 0.472 |
| IMW at T3 | 47.62 | 3.28 | 47.63 | 3.23 | 0.991 | 0.991 |
The groups were compatible regarding all variables, except that group 2 had a significantly longer treatment time than group 1 ( Tables II and III ).
| Sex | Group 1, Class I, 4 extractions | Group 2, Class II Division 1, 4 extractions | Group 3, Class II Division 1, 2 extractions | Total |
|---|---|---|---|---|
| Male | 12 | 11 | 11 | 34 |
| Female | 18 | 9 | 9 | 36 |
| Total | 30 | 20 | 20 | 70 |
| Variable | Group 1, Class I, 4 extractions | Group 2, Class II Division 1, 4 extractions | Group 3, Class II Division 1, 2 extractions | P | |||
|---|---|---|---|---|---|---|---|
| Mean | SD | Mean | SD | Mean | SD | ||
| T1 age (y) | 13.16A | 0.97 | 12.95A | 1.08 | 13.09A | 1.11 | 0.760 |
| T2 age (y) | 15.15A | 1.14 | 15.43A | 1.28 | 15.14A | 1.10 | 0.604 |
| T3 age (y) | 23.71A | 2.80 | 24.97A | 4.02 | 25.02A | 2.85 | 0.159 |
| Treatment time (y) | 1.99A | 0.51 | 2.48B | 0.72 | 2.05AB | 0.45 | 0.01 ∗ |
| Retention time (y) | 1.24A | 0.53 | 1.28A | 0.54 | 1.10A | 0.27 | 0.419 |
| T2 observation (y) | 8.55A | 3.03 | 9.54A | 4.27 | 9.88A | 2.87 | 0.209 |
| T3 observation (y) | 7.31A | 3.18 | 8.26A | 4.47 | 8.78A | 2.95 | 0.191 |
| LIIMx at T1 (mm) | 8.59A | 3.08 | 11.10A | 4.46 | 9.68A | 4.00 | 0.077 |
| LIIMx at T2 (mm) | 0.80A | 0.90 | 0.61A | 0.52 | 0.64A | 0.55 | 0.601 |
Decreases in the LIIMx scores were significantly greater in group 2 than in group 1 during treatment. The increase in IPW was significantly greater in group 2 than in groups 1 and 3, in which it decreased during treatment. IMW at T2 was significantly smaller in group 3 than in group 2. The decrease in IMW was significantly greater in group 3 than in group 2 during treatment ( Table IV ).
| Variable | Group 1, Class I, 4 extractions | Group 2, Class II Division 1, 4 extractions | Group 3, Class II Division 1, 2 extractions | P | |||
|---|---|---|---|---|---|---|---|
| Mean | SD | Mean | SD | Mean | SD | ||
| LIIMx at T1 | 8.59A | 3.08 | 11.10A | 4.46 | 9.68A | 4.00 | 0.077 |
| AL at T1 | 71.04A | 3.79 | 70.48A | 4.38 | 69.88A | 3.63 | 0.590 |
| ICW at T1 | 34.78A | 2.25 | 34.56A | 2.81 | 34.49A | 2.90 | 0.917 |
| IPW at T1 | 37.87A | 2.18 | 36.72A | 2.60 | 37.51A | 2.01 | 0.219 |
| IMW at T1 | 49.31A | 2.80 | 48.71A | 3.28 | 49.24A | 2.11 | 0.732 |
| LIIMx at T2 | 0.80A | 0.90 | 0.61A | 0.52 | 0.64A | 0.55 | 0.601 |
| AL at T2 | 62.05A | 2.20 | 62.91A | 1.96 | 61.06A | 2.98 | 0.096 |
| ICW at T2 | 34.73A | 1.75 | 35.59A | 2.00 | 34.72A | 1.55 | 0.194 |
| IPW at T2 | 36.31A | 1.77 | 37.19A | 1.77 | 35.91A | 1.39 | 0.052 |
| IMW at T2 | 47.79AB | 2.32 | 48.55A | 2.61 | 46.44B | 2.07 | 0.020 ∗ |
| LIIMx at T3 | 1.79A | 1.59 | 2.07A | 1.44 | 1.43A | 1.03 | 0.361 |
| AL at T3 | 60.66A | 2.26 | 61.40A | 3.59 | 60.13A | 3.01 | 0.381 |
| ICW at T3 | 34.58A | 1.58 | 35.03A | 1.97 | 34.87A | 2.22 | 0.689 |
| IPW at T3 | 35.28A | 2.05 | 36.04A | 2.05 | 35.33A | 2.11 | 0.406 |
| IMW at T3 | 47.12A | 2.77 | 48.47A | 2.66 | 46.47A | 2.66 | 0.151 |
| LIIMx, T2-T1 | −7.79A | 2.88 | −10.48B | 4.35 | −9.05AB | 3.93 | 0.043 ∗ |
| AL, T2-T1 | −8.99A | 3.10 | −7.56A | 4.38 | −8.82A | 4.10 | 0.401 |
| ICW, T2-T1 | −0.05A | 2.06 | 1.03A | 2.16 | 0.24A | 2.24 | 0.216 |
| IPW, T2-T1 | −1.57A | 1.85 | 0.46B | 1.83 | −1.59A | 1.51 | 0.000 ∗ |
| IMW, T2-T1 | −1.53AB | 2.14 | −0.16A | 2.72 | −2.80B | 1.82 | 0.002 ∗ |
| LIIMx, T3-T2 | 0.97A | 1.28 | 1.46A | 1.42 | 0.79A | 1.05 | 0.223 |
| AL, T3-T2 | −1.39A | 1.37 | −1.50A | 2.47 | −0.93A | 1.36 | 0.544 |
| ICW, T3-T2 | −0.16A | 1.02 | −0.56A | 1.15 | 0.15A | 1.30 | 0.155 |
| IPW, T3-T2 | −1.03A | 0.97 | −1.15A | 0.58 | −0.58A | 1.44 | 0.255 |
| IMW, T3-T2 | −0.66A | 1.28 | −0.42A | 1.91 | 0.02A | 1.66 | 0.301 |
Stay updated, free dental videos. Join our Telegram channel
VIDEdental - Online dental courses


