Introduction
The aim of this study was to establish an accumulated strain pattern in different parts of rapid maxillary expansion appliances and relate them to different vertical growth patterns. A clinical study was conducted of 40 patients with posterior crossbite who required rapid palatal expansion.
Methods
Patients (mean age, 8.48 years) were recruited and treated at the Dental Hospital of Bellvitge, Hospitalet de Llobregat, Barcelona, Spain. Strain gauges were placed on the arms of the RME hyrax screw appliance to record deformation (strain) during the expansion and the retention phases for 75 days. A finite element model was used to place the gauge at the point where the strain was most expressed. The vertical coefficient of variation was used to classify the patients by their vertical growth pattern. P = 0.05 was considered to be statistically significant.
Results
During the expansion phase, the highest values of accumulated strain were measured in the posterior part of the appliance for all facial biotypes, but these values passed to the anterior area at the end of the retention phase of the mesocephalic and brachycephalic patients. There was statistically significant difference in the strain of the posterior arms in accordance with the vertical growth pattern ( P = 0.05) during the retention phase. At 75 days of retention, 61.25% of the arms had already begun to have strain dissipation.
Conclusions
The accumulated strain pattern in the rapid maxillary expansion appliance can vary depending on the facial biotype. In the future, orthodontists should try to tailor the activation and retention protocol based on each patient’s characteristics.
Highlights
- •
Facial biotypes determine the patterns of accumulated stress.
- •
Greater displacement of the maxilla at the anterior zone and less bone cause greater strain.
- •
Accumulated strain is not dissipated in the posterior zone of dolichocephalic biotypes.
- •
A protocol based on each patient’s characteristics will improve the quality of treatment.
The term “posterior crossbite” was described by Wood in 1962 as the abnormal buccal or lingual relationship of the maxillary and mandibular teeth when both hemimaxillas are in occlusion. If it has a skeletal origin, an expansion screw for rapid maxillary expansion (RME) is usually used to produce changes in the underlying structures, resulting in opening of the midpalatal suture. Most rapid expansion appliances have a lateral displacement at each activation, which is 0.2 mm. After activation, force is generated and dissipates with time; however, because of consecutive activations, residual force is generated, defined as the force remaining between 2 consecutive activations. This treatment applies equal activation forces in patients of different ages with variations in bone density, different degrees of ossification of the circummaxillary sutures, and different muscle patterns and associated habits. Conventional treatment requires displacement of the screw regardless of the patient’s splint appliance deformation; this is subtracted from the total screw displacement. Therefore, not only the real force is unknown, but also the actual displacement. With strain gauges placed on the RME appliance, forces have been shown to be constantly present; the forces develop residual RME during the active phase and continue during the retention phase. Thus, it is not surprising that the screw type of protocol activation and retention should be different for each patient.
The objective of this study was to establish patterns of accumulated strain in different parts of an RME appliance and relate them to different vertical growth patterns.
Material and methods
There were 215 consecutive patients who went to the Dental Hospital of Bellvitge in Barcelona, Spain, over 10 months in 2013. In 44 of these patients with mixed dentition, RME was clinically indicated, and they were treated accordingly. They underwent diagnostic studies based on photographs, plaster casts, and cephalometric analyses. The following were the criteria for the selection of patients: no signs or symptoms of systemic disease, no medication that could interfere with orthopedic treatment, and an adequate diet. They also could not have previously received any orthodontic or orthopedic treatments. An insurance liability policy numbered CE000343677 was contracted, and parents or guardians had to sign a waiver containing 21 guidelines based on the International Ethical Guidelines agreed upon in Geneva in 2002 for research with human consent. The ethics committee for clinical research of the Dental Hospital of Bellvitge, University of Barcelona, adopted the case-control study under reference number 11/2011.
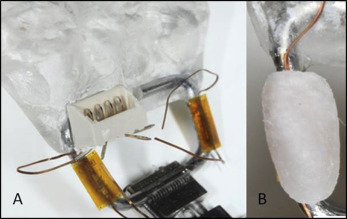
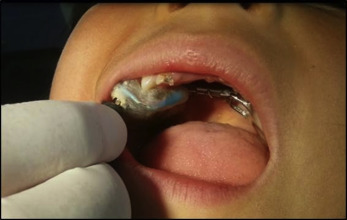
Mechanical strain measurements were taken on the surface of the appliance arms to obtain information about the effort exerted on the teeth during treatment. The strain (deformation per unit of length) was determined by measuring the deformation unit produced in the arm of the circuit appliance after activating the screw; the deformation was generated because of the resistance of the skull. When the appliance was subjected to treatment forces, the strain at the measuring point was unequivocally associated with the deformation determined by Young’s modulus of elasticity and Poisson’s ratio for materials. The strain value was measured with 2 strain gauges (EA-06-015DJ-120/LE; Micro-Measurements, Raleigh, NC). The strain gauge temperature self-compensation coefficient and the low variability of the oral temperature allowed us to estimate an upper limit for strain inaccuracy due to temperature variations of ±1% of the readout. The strain gauges were bonded with an adhesive kit (M-bond 200 adhesive and 200 Catalyst/Adhesive kit SR-4; Micro-Measurements) to the right anterior and posterior arms of a type “S” hyrax split palatal screw made of AISI 303 and 301 stainless steel (167-1326; Forestadent, Pforzheim, Germany). Before gauge bonding, the sterilized arm surface was abraded with silicon-carbide paper; then the M-Prep conditioner A solution and the M-Prep Neutralizer 5A solution (Micro-Measurements) were applied. The M-bond catalyst was applied to the aligned gauge; then the M-bond adhesive was applied just before the gauge was placed in contact with the arm’s surface. The bond was allowed to polymerize under pressure for 5 minutes. The screw was set in an acrylic splint (403-0010-Forestacryl; Forestadent), which adhered to the deciduous maxillary molars and permanent first molars. The gauge was coated with orthodontic wax so that the surface would not be in contact with the resin system ( Fig 1 ). For analysis, the Model D4 Data Acquisition Conditioner (version 1.32; Micro-Measurements) was used. This model has 4 channels for data acquisition, but only channels 1 and 2 were used for the anterior and posterior arms, respectively, in all patients. Once installed, the first measurement was taken as 0. Once these data were obtained with the gauge, they were forwarded to the 2 channels of the model D4 via a cable, and the microstrain values (Ɛ = × 10 −6 − μS) were transformed, or in our case, μe microvolts/V. The model D4 was operated via commands sent over a USB connection. Application software was provided to control the D4 with a Windows-based personal computer (Microsoft, Redmond, Wash). Subsequently, the screw was activated, and the resulting data were recorded again (T1). Screw activations occurred once every 12 hours; after 10 days, the strain was recorded again. When a half expansion overcorrection was obtained with a metal screw ligature set, strain (T2) was recorded at that time. From then on, new measurements were taken every 15 days until day 75 of the retention phase (T3-T7). When the appliance was removed 75 days later, a transpalatal arch was placed for 6 months. Figure 2 shows the clinical conditions when the measurements were taken. The location of the connector was always on the right side, in the palatal area of the maxillary right first molar, but in patients with a narrow palate, it was placed buccally at the level of the maxillary right deciduous or permanent canine. Between sessions, the connector was protected from saliva by a Xantopren plug (Bayer, Leverkusen, Germany).
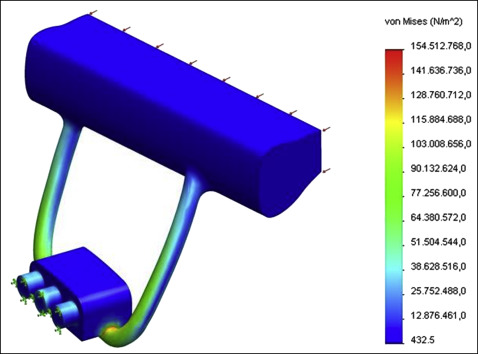
A preliminary analysis of strains and deformations on a circuit appliance was performed using the finite element model to calculate the ideal location of the gauge to best reflect the strain. In the trial, even pressure was applied in the middle plane of the approximate area of the resin, equivalent to a force of 5 N (0.5 kg) exerted by each programmed side. There was restricted motion of the symmetrical plane of the RME appliance, and the plane was symmetrical. The mesh contained 50705 tetrahedral elements and 75288 nodes. The ideal surface for adhesion was oriented toward the symmetrical plane of the buccal cavity, and as close as possible to the area that housed the screw ( Fig 3 ). A calibration test was performed on the appliance and splint assembly; the applied load was measured by a load cell transducer, and the strain gauges’ readouts were recorded to establish the relationship between measured strain and screw load. The calibration test gave approximate sensitivity factors of 57 and 42 for the anterior and posterior arm gauges, respectively, expressed in microstrains per newton.
In the radiographic study, to describe the pattern of vertical growth of the patient, the VERT coefficient of variation (CVV) was used. The variables studied were the facial axis, facial depth, mandibular plane angle, lower facial height, and mandibular arch. To ensure uniform interpretation of these variables on the lateral radiographs, measurements were taken by 2 examiners (V.J.G., K.K.). The examiners had to classify the 15 films according to 3 basic facial biotypes: mesocephalic, described as a proportioned growth pattern with CVV values between −0.5 and +0.5; brachycephalic, a horizontal growth pattern with CVV values greater than +0.5; and dolichocephalic, a vertical growth pattern with CVV values below −0.5. In the first session, each examiner independently analyzed 15 lateral radiographs with the computer software Nemoceph NX 2011 (version 10.4.2.58; Nemotec, Madrid, Spain). Fifteen days later, the same examiners again performed the same process independently. Once the data were collected, qualitative statistical analysis proceeded to where the kappa index (0.98) confirmed that both examiners agreed. Moreover, in the quantity analysis with the intraclass correlation coefficient measurement, the value was 0.878 (95% confidence interval, 0.782-0.933); this showed a good level of concordance. The cervical vertebrae maturation index, developed by Hassel and Farman, was used to assess the patient’s pattern of vertical growth. Using the lateral profiles of the second, third, and fourth cervical vertebrae of our patients, we were able to classify the maturation stage: 1, initiation; 2, acceleration; 3, transition; 4, deceleration; 5, maturation; and 6, completion.
Statistical analysis
The statistical analysis of the data obtained from the D4 Data Acquisition Conditioner was undertaken using the SPPS statistical software program (version 11.5; SPPS, Chicago, Ill). The Kruskal-Wallis test was used for independent variables to interrelate the strain difference between T2 and T7 and the growth pattern. The Mann-Whitney U test was used to evaluate differences on the stage of skeletal maturation depending on sex. The chi-square test was used to compare the categorical variables’ dissipation period for both strain and growth pattern. P = 0.05 was considered statistically significant.
Results
A total of 40 patients (22 girls, 18 boys) completed treatment without abnormal results; 2 completed treatment but arm B failed; and 2 discontinued treatment. Eighteen patients had a brachycephalic pattern of growth (10 girls, 8 boys), 10 had a mesocephalic pattern (4 girls, 6 boys), and 12 had a dolichocephalic pattern (8 girls, 4 boys). Table I gives a full description by sex, age, CVV value, and skeletal maturation of the 3 groups.
| Sex | ||||||||||
|---|---|---|---|---|---|---|---|---|---|---|
| Female | Male | Age (y) | CVV value | Skeletal maturation | ||||||
| n | % | n | % | Mean | SD | Mean | SD | Mean | SD | |
| Dolichocephalic | 8 | 67 | 4 | 33 | 7.56 | 1.46 | −0.54 | 0.23 | 1.38 | 0.48 |
| Mesocephalic | 4 | 40 | 6 | 60 | 8.78 | 2.20 | 0.04 | 0.17 | 1.45 | 0.69 |
| Brachycephalic | 10 | 56 | 8 | 46 | 8.94 | 1.75 | 1.27 | 0.53 | 1.39 | 0.78 |
The average residual strains remaining at the end of the expansion phase (T2) were 1226.20 μS (range, 46-4769 μS) in the anterior arm and 1755.40 μS (range, 5-5137 μS) in the posterior arm. After the retention phase (T7), the average residual strains were 4068.70 μS (range, 42-20470 μS) in the anterior arm and 3037.50 μS (range, 31-16505 μS) in the posterior arm. The average of the maximum values for the analyzed residual strain was measured in the anterior arm in T7; in the posterior arm, the same value was measured in T5; this value was 3508.90 μS (range, 63-16506 μS).
Descriptive statistics for the average strains generated on arms A and B during the expansion and retention phases and the average maximum differential strain at T7 (dissipation strain) are presented in Table II . There were statistically significant differences in the strains of the posterior arms by growth pattern ( P = 0.05) between the T7 and T2 times.
| Growth pattern | Treatment phase | Arm A | Arm B | ||
|---|---|---|---|---|---|
| Mean | SD | Mean | SD | ||
| Brachycephalic | Expansion phase | 900.70 | 727.83 | 1641.51 | 1477.24 |
| Retention phase | 3551.11 | 4950.41 | 1960.83 | 1845.03 | |
| ↓Strain | 1392.79 | 936.10 | 1780.70 | 2475.3 | |
| Mesocephalic | Expansion phase | 1691.10 | 1396.99 | 1489.90 | 1154.83 |
| Retention phase | 5949.80 | 6164.45 | 2535.00 | 1513.15 | |
| ↓Strain | 1183.40 | 580.32 | 916.50 | 350.56 | |
| Dolichocephalic | Expansion phase | 1327.03 | 140.76 | 2147.50 | 1792.35 |
| Retention phase | 3277.52 | 2389.80 | 5071.24 | 5158.03 | |
| ↓Strain | 981.30 | 112.42 | 853.95 | 177.40 | |
The Mann-Whitney U test confirmed that differences do not exist between the sex and skeletal maturation variables; therefore, the female and male responses were equivalent ( P = 0.225).
Dissipation of the residual strain occurred in 52.5% of arms A and 70% of arms B at the T6 to T7 period. The percentages of arms that began their dissipation, by biotype and according to the total sample, were assessed. There was no statistically significant difference between the 3 facial biotypes and the T2 to T6 dissipation periods (arm A, P = 0.10; arm B, P = 0.35).
In addition, in Table III , the evolution of tension in arms A and B from the first activation (T1) to the last recording (T7) is given. It shows that there were statistically significant differences in the median strains of the posterior arms by growth pattern in the first activation (T1) of P = 0.035 and for day 60 of retention (T6) of P = 0.041. In Figure 4 , the rates of strain dissipation for arms A and B are represented graphically.
| Phase | Arm A | Arm B | ||||
|---|---|---|---|---|---|---|
| Brachycephalic | Mesocephalic | Dolichocephalic | Brachycephalic | Mesocephalic | Dolichocephalic | |
| T1 | ||||||
| Median | 212.5 | 184.5 | 150.5 | 210.5 | 93.5 | 152.5 |
| Interquartile range | 91.75-472.75 | 101-873.5 | 98.5-445.25 | 148.75-439 | 93.5-203.75 | 104-459.75 |
| P value | 0.9 | 0.035 ∗ | ||||
| T1.5 | ||||||
| Median | 580.3 | 856.6 | 639.5 | 1004 | 653.2 | 1009 |
| Interquartile range | 289.9-1163.6 | 564.15-1617.8 | 257.3-586.32 | 501.3-1935.6 | 149.7-1680.6 | 478.72-1545.3 |
| P value | 0.381 | 0.769 | ||||
| T2 | ||||||
| Median | 789.5 | 1162 | 846.5 | 1284 | 1606 | 1760 |
| Interquartile range | 366-1116 | 719-2646.25 | 314-2525.75 | 551-2277.5 | 278.7-2639.2 | 597-3931.7 |
| P value | 0.27 | 0.846 | ||||
| T3 | ||||||
| Median | 1091 | 2112 | 1898 | 1833 | 2305 | 2467 |
| Interquartile range | 710.2-1786.7 | 1091-3589.25 | 762-3107.7 | 503.25-3433 | 429-2785 | 905.5-5481.2 |
| P value | 0.103 | 0.408 | ||||
| T4 | ||||||
| Median | 1244 | 2848 | 1697 | 1832 | 2708 | 3548 |
| Interquartile range | 883.5-2162.2 | 325.7-5629.7 | 876.2-3952.5 | 581.5-3346.7 | 1006.2-3029 | 1386.7-7214 |
| P value | 0.107 | 0.155 | ||||
| T5 | ||||||
| Median | 1877 | 3210 | 2672 | 1909 | 2909 | 3222 |
| Interquartile range | 1012-3990.5 | 2139.75-7683.7 | 1395-4605.2 | 290.2-3381.2 | 1721-3826 | 1933.5-7521 |
| P value | 0.156 | 0.149 | ||||
| T6 | ||||||
| Median | 1979 | 3347 | 3098 | 1944 | 2848 | 4120 |
| Interquartile range | 233.7-4716.2 | 579-8747.75 | 1371-4659.4 | 367-3680.75 | 1430.7-3728 | 2172-6692 |
| P value | 0.464 | 0.041 ∗ | ||||
| T7 | ||||||
| Median | 1688 | 3435 | 2422 | 1579 | 2621 | 3242 |
| Interquartile range | 754.25-3922 | 1170-9558.5 | 1170.7-9558 | 368-3498.25 | 1193-3278.7 | 1853.5-5954 |
| P value | 0.27 | 0.094 | ||||
Stay updated, free dental videos. Join our Telegram channel
VIDEdental - Online dental courses


