Introduction
The objective of this research was to determine which clinical and skeletal factors are related to the success rate of orthodontic mini-implants in the maxillary and mandibular posterior buccal areas.
Methods
A total of 778 orthodontic mini-implants (Dual-Top Anchor System, Jeil Medical, Seoul, Korea; 1.6 mm diameter, 8 mm length, cylinder shape, self-drilling type) in 306 patients were retrospectively examined. The success rate was calculated according to clinical variables (sex, age, soft-tissue management, placement position, sagittal skeletal classification, arch-length discrepancy, and side) and skeletal variables (articular angle, mandibular plane to palatal plane angle, Frankfort-mandibular plane angle, mandibular plane angle, gonial angle, upper gonial angle, and lower gonial angle). Analysis of variance (ANOVA), chi-square tests, and multiple logistic regression analysis were used for statistical analysis.
Results
The overall success rate was 79.0%. Almost 80% of the failures occurred within the first 4 months. The clinical variables sex, age, soft-tissue management, sagittal skeletal classification, arch-length discrepancy, and side did not show significant differences in the success rate. Although the success rates were significantly different according to placement position ( P <0.01), there was no significant difference in the odds ratios among placement positions. In the skeletal variables, average upper gonial angle (84.2%) had a significantly higher success rate than low (75.7%) and high (71.2%) upper gonial angles ( P <0.01). High Frankfort-mandibular plane angle ( P <0.05) and low upper gonial angle groups ( P <0.05) showed significant lower odds ratios than did the other types.
Conclusions
Vertical skeletal pattern might be an important factor for the success of orthodontic mini-implants placed in posterior buccal areas.
Anchorage reinforcement is an important issue in orthodontic treatment. The orthodontic mini-implant (OMI; also called temporary anchorage device) has been popularized because of its simplicity of placement and removal, low cost, and noncompliance from patients.
Recently, several studies have been done to determine factors that could be related to the success rates of OMIs.
Park et al suggested that inflammation around the OMI, especially on the right side of the mandible, must be controlled to minimize the failure of the OMI. However, Moon et al reported that sex, age, jaw, soft-tissue management, and placement side might not be important factors in success rate of OMIs, but placement position could be. Kuroda et al insisted that the proximity of an OMI to the root was a major risk factor for the failure of the OMI, especially in the mandible.
Miyawaki et al suggested that an OMI diameter of 1.0 mm or less, inflammation of the peri-OMI tissue, and a high mandibular plane angle (ie, thin cortical bone) were associated with failure of OMIs placed in buccal alveolar bone of the posterior region for orthodontic anchorage. However, Kuroda et al found no significant correlation between success rate and age, sex, mandibular plane angle, anteroposterior jaw-base relationship, control of periodontitis, temporomandibular disorder symptoms, loading, and screw length.
Thickness and density of the cortical bone and the facial skeletal pattern are known to have a close relationship. Because characteristics of the cortical bone seem to be an important factor in the stability of OMIs, the relationship between the success rate of OMIs and facial skeletal patterns needs to be studied.
However, there has been controversy about the role of placement position and skeletal pattern, especially in the vertical aspect, in the stability of OMIs. Therefore, the purpose of this study was to determine which clinical and skeletal variables are related to the success rate of OMIs placed in the maxillary and mandibular posterior buccal areas. The null hypothesis was that there was no difference in the success rate of OMIs according to placement position and vertical skeletal pattern.
Material and methods
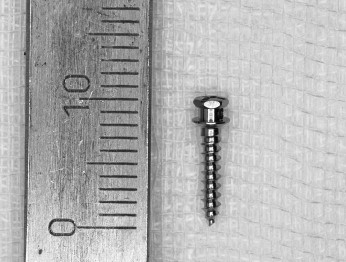
The samples in this retrospective study consisted of 778 OMIs (Dual-Top Anchor System, Jeil Medical, Seoul, Korea; 1.6 mm diameter, 8 mm length, self-drilling type; Fig 1 ) in 306 patients (110 male, 196 female) treated in the Department of Orthodontics at Gachon Dental Hospital, Inchon, Korea. The OMIs were placed in the maxillary and mandibular posterior buccal areas (427 OMIs in 155 extraction patients and 351 OMIs in 151 nonextraction patients) for anchorage reinforcement between January 2003 and November 2006. Before placement of the OMIs, informed consent about the purposes, advantages, disadvantages, and possibility of dislodgement was obtained from the patients or parents.
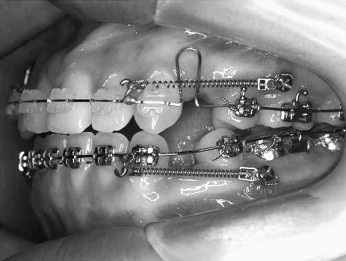
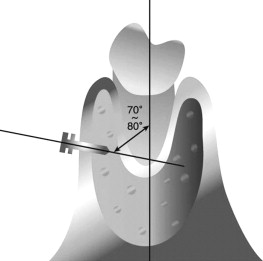
The OMIs were placed at the attached gingiva just adjacent to the mucogingival junction ( Fig 2 ) with a 70° to 80° angle to the long axis of the teeth ( Fig 3 ). Placement of the OMIs was done by 4 clinicians and checked by a supervisor (C.H.M.). To reduce the possibility of failure and give enough experience for OMI placement, the first 10 OMIs of each clinician were not included in this study.
Orthodontic loading (150-200 g) was applied to the OMIs 2 to 3 weeks after placement by using elastomerics (Energy chain, Rocky Mountain Orthodontics, Denver, Colo) or nickel-titanium closed coil springs (Super-elastic Coil Springs, yellow, Tomy, Tokyo, Japan). The OMI was judged a success when orthodontic force could be applied for at least 10 months without pain or clinically detectable mobility, or its purpose was accomplished.
To analyze the effect of clinical variables such as patients’ sex and age, soft-tissue management, placement position, sagittal skeletal classification, arch-length discrepancy, and placement side on the success rate of the OMIs, the samples were divided as follows.
- 1.
According to sex: male (n =110, 257 OMIs) and female (n = 196, 521 OMIs).
- 2.
According to age: teenagers (n = 168; mean age, 14.45 ± 2.65 years; range, 10-19 years; 422 OMIs), twenties (n = 114; mean age, 23.73 ± 2.70 years; range, 20-29 years; 301 OMIs), and adults (n = 24; mean age, 37.04 ± 7.26 years; range, 30-55 years, 55 OMIs).
- 3.
According to soft-tissue management: incision group (cross-shaped stab incision [3-4 mm], reflection of the gingival flaps, placement of the OMI [soft tissue was not sutured]) and nonincision group (the OMI was placed without a soft-tissue incision).
- 4.
According to placement position: U1 (between the maxillary first and second premolars), U2 (between the maxillary second premolar and first molar), U3 (between the maxillary first and second molars), L1 (between the mandibular first and second premolars), L2 (between the mandibular second premolar and first molar), and L3 (between the mandibular first and second molars).
- 5.
According to sagittal skeletal classification: Class I malocclusion (0°<ANB<4°), Class II malocclusion (ANB, ≥4°), and Class III malocclusion (ANB, ≤0°).
- 6.
According to arch-length discrepancy: crowding (<–2 mm), normal (≥–2 to <2 mm), and spacing (>2 mm).
- 7.
According to placement side: right and left.
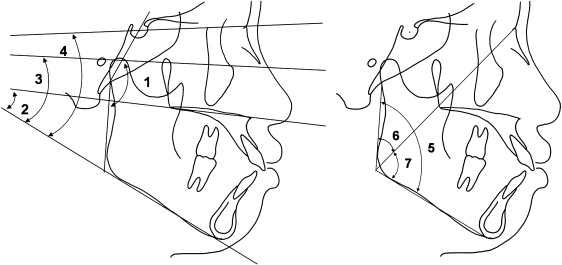
The skeletal variables such as articular angle, mandibular plane to palatal plane angle, Frankfort-mandibular plane angle, mandibular plane angle, gonial angle, upper gonial angle, and lower gonial angle were measured from the lateral cephalograms at pretreatment ( Fig 4 ). According to Korean norms, each variable was divided into 3 groups: low, average, and high ( Fig 4 ).
Statistical analysis
Analysis of variance (ANOVA), chi-square tests, and multiple logistic regression analysis were used to estimate differences in the success rates and odds ratios of the OMIs according to the clinical and skeletal variables.
Results
The overall success rate was 79.0% with a mean period of 12.21 ± 7.88 months ( Table I ). The mean period of the failed OMIs was 1.84 ± 2.09 months ( Table I ). Dislodgement of OMIs occurred most frequently in the first month (32.5%), and 80% of failures occurred within the first 4 months ( Table II ).
| Number of OMIs (percentage) | Duration | ||
|---|---|---|---|
| Mean (mo) | SD (mo) | ||
| Success | 615 (79.0%) | 12.21 | 7.88 |
| Failure | 163 (21.0%) | 1.84 | 2.09 |
| Duration (mo) | Number of OMIs | Percentage (%) | Cumulative percentage (%) |
|---|---|---|---|
| <1 | 53 | 32.5 | 32.5 |
| ≥1, <2 | 44 | 27 | 59.5 |
| ≥2, <3 | 22 | 13.5 | 73.0 |
| ≥3, <4 | 12 | 7.4 | 80.4 |
| ≥4, <5 | 9 | 5.5 | 85.9 |
| ≥5, <6 | 7 | 4.2 | 90.2 |
| ≥6, <7 | 10 | 6.1 | 96.3 |
| ≥7, <8 | 4 | 2.5 | 98.8 |
| ≥8, <9 | 1 | 0.6 | 99.4 |
| 9 | 1 | 0.6 | 100 |
| Total | 163 | 100.0 | 100 |
In the clinical variables, age had a marginal significance on the success rate ( P = 0.055, Table III ). Teenagers (76.1%) had a relatively lower success rate than did the twenties (81.7%) and adults (87.3%) ( Table III ). There was a significant difference in the success rates according to placement position ( P <0.05, Table III ). The areas between the mandibular second premolar and first molar, and the mandibular first and second molars showed lower success rate than other areas ( Table III ). However, there were no significant differences in the success rates according to the patients’ sex, soft-tissue management, arch-length discrepancy, sagittal skeletal classification, and placement side ( Table III ). In addition, age, sex, soft-tissue management, placement position, arch-length discrepancy, sagittal skeletal classification, and placement side had no significant differences in the odds ratios of success rates ( Table IV ).
| Clinical variable | Success rate (%) | Number of OMIs | P value | |
|---|---|---|---|---|
| Age | Teenagers | 76.1 | 321 | 0.055 |
| Twenties | 81.7 | 246 | ||
| Adults | 87.3 | 48 | ||
| Soft-tissue management | Incision | 79.5 | 171 | 0.837 |
| Nonincision | 78.9 | 444 | ||
| Sex | Male | 78.2 | 201 | 0.708 |
| Female | 79.5 | 414 | ||
| Placement position | U1 | 84.5 | 71 | 0.012* |
| U2 | 79.6 | 191 | ||
| U3 | 79.8 | 83 | ||
| L1 | 89.0 | 89 | ||
| L2 | 73.3 | 143 | ||
| L3 | 69.1 | 38 | ||
| Arch-length discrepancy | Crowding | 80.9 | 428 | 0.125 |
| Normal | 76.7 | 125 | ||
| Spacing | 72.1 | 62 | ||
| Sagittal skeletal classification | Class I | 78.8 | 331 | 0.945 |
| Class II | 78.7 | 129 | ||
| Class III | 79.9 | 155 | ||
| Placement side | Left | 80.0 | 264 | 0.594 |
| Right | 78.3 | 351 | ||
| Clinical variable | Odds ratio | 95% CI | P value | |
|---|---|---|---|---|
| Age | Teenagers | Reference | ||
| Twenties | 1.138 | 0.668-1.937 | 0.634 | |
| Adults | 2.431 | 0.843-7.008 | 0.100 | |
| Soft-tissue management | Incision | Reference | ||
| Nonincision | 0.86 | 0.461-1.602 | 0.634 | |
| Sex | Male | Reference | ||
| Female | 1.235 | 0.729-2.094 | 0.433 | |
| Placement position | U1 | Reference | ||
| U2 | 0.802 | 0.378-1.702 | 0.565 | |
| U3 | 0.716 | 0.303-1.694 | 0.447 | |
| L1 | 1.791 | 0.692-4.638 | 0.230 | |
| L2 | 0.582 | 0.274-1.236 | 0.159 | |
| L3 | 0.528 | 0.206-1.356 | 0.185 | |
| Arch-length discrepancy | Crowding | Reference | ||
| Normal | 0.64 | 0.389-1.054 | 0.079 | |
| Spacing | 0.725 | 0.385-1.367 | 0.320 | |
| Sagittal skeletal classification | Class I | Reference | ||
| Class II | 1.071 | 0.621-1.848 | 0.804 | |
| Class III | 0.905 | 0.513-1.595 | 0.730 | |
| Placement side | Left | Reference | ||
| Right | 0.924 | 0.533-1.602 | 0.778 | |
Stay updated, free dental videos. Join our Telegram channel
VIDEdental - Online dental courses


