Introduction
A precision 3-dimensional (3D) head model can be fabricated by integrating a digital dental model into a maxillofacial 3D image. The integration requires accurate registration of 2 image modalities. The aims of this study were to determine the registration errors for implementation of laser-scanned dental images into cone-beam computed tomography (CBCT) scan data and to examine the influence of the registration area on the accuracy of registration.
Methods
The CBCT scans were obtained from 30 adults, and the maxillofacial 3D images were reconstructed. Maxillary and mandibular dental casts were taken from the same subjects and scanned with a 3D laser scanner. The laser-scanned maxillary and mandibular dentition images were incorporated into the CBCT images of each arch in 3 ways according to the registration area: only the buccal surfaces, only the lingual surfaces, and both the buccal and lingual surfaces. Surface-based registration was performed by using an iterative closest point algorithm, and its errors were evaluated by measuring the 3D Euclidean distances between the surface points on the 2 images.
Results
The registration errors ranged from 0.27 to 0.33 mm. The mandibular arch did not show significant differences in registration errors according to the selected area for the registration. The maxillary arch, however, showed significant differences according to the registration area. When the lingual surfaces only were used for registration, the errors were greater than for the other 2 methods. The errors were least when both the buccal and lingual surfaces were used for registration.
Conclusions
The results of this study indicate that accuracy in the integration of laser-scanned dental images into the maxillofacial CBCT images increases when a broad area is used for registration.
Accurate analyses of the skeletal structures and occlusion are essential for a precise diagnosis of dentofacial deformities. Among the many diagnostic tools in contemporary orthodontics, cephalometric radiography still plays a major role in diagnosis, treatment planning, and evaluation of the treatment results. However, cephalometric radiographic images might provide misleading information because complex 3-dimensional (3D) structures are projected onto flat 2-dimensional surfaces, possibly creating image distortion and subsequent magnification errors.
The development of computed tomography (CT) has reduced the possibility of these errors significantly and improved the ability to understand the 3D nature of the facial structures. Three-dimensional CT imaging is used to construct a skeletal model of patients, establish a treatment plan, and simulate orthognathic surgery, resulting in improved predictability of the treatment results and a more credible simulation of the posttreatment outcome. However, a drawback of 3D CT imaging is that detailed occlusal and accurate interocclusal data cannot be obtained. Moreover, orthodontic brackets and dental restorations cause streaking artefacts. The image quality obtained from CT is insufficient for a precise representation of the teeth.
For these reasons, some attempts have been made to combine a maxillofacial CT image with a digital dental model to fabricate a precision 3D head model. Gateno et al reported a technique for creating a computerized composite skull model using a combination of a 3D CT bone model and a digital dental model obtained from a laser scanner. Uechi et al also suggested a method for fabricating a virtual skull model integrated with a laser-scanned dental model using a multimodal image-fusion technique. Swennen et al introduced a technique to set up a 3D virtual augmented skull model with a detailed dental surface using a double cone-beam CT (CBCT) scan procedure.
Although all these techniques suggest an acceptable degree of registration accuracy, the procedures are rather complicated for practitioners because they use fiducial markers for registration. Titanium spheres, ceramic balls, or softened gutta percha were used in these studies. More recently, Swennen et al, who had used fiducials once for the registration, adopted a new approach to augment a 3D virtual skull model with detailed occlusal and intercuspation data, using the so-called “triple CBCT scan” procedure. Their approach did not use fiducial markers for registration while the subjects were scanned with CT more than once.
As an another method without the use of fiducial markers, Nkenke et al suggested the fusion of CT scan data and digital surface data of a plaster cast using surface-based registration. The registration was carried out by using an iterative closest point algorithm, also without fiducial markers. The registration uses the surface information from 2 data sets to calculate the rotation and translation between data sets. The corresponding points and shapes are searched, and the distance is minimized after rotation and translation. The error of matching 2 surfaces can be evaluated by measuring the 3D Euclidean distances between many surface points on the 2 images. The purposes of this study were to determine the registration errors for implementation of the laser-scanned dental images into the CBCT scan data and examine the influence of the registration area on the accuracy of registration.
Material and methods
Thirty adults (13 men, 17 women; mean age, 24.5 years) with normal occlusion and no missing teeth were enrolled in this study. Subjects with prosthetic crown restorations were excluded. All subjects provided informed consent to participate.
The scans were obtained with a CBCT scanner (Alphard Vega; Asahi Roentgen, Kyoto, Japan) under the following conditions: 80 kV; 5 mA; voxel size, 0.39 × 0.39 × 0.39 mm; field of view, 200 × 179 mm. Each maxillary and mandibular dental plaster cast was obtained from impressions taken with alginate (Cavex Impressional; Cavex Holland BV, Haarlem, The Netherlands). The plaster casts were then scanned by using a 3D laser scanner (Orapix, Seoul, Korea).
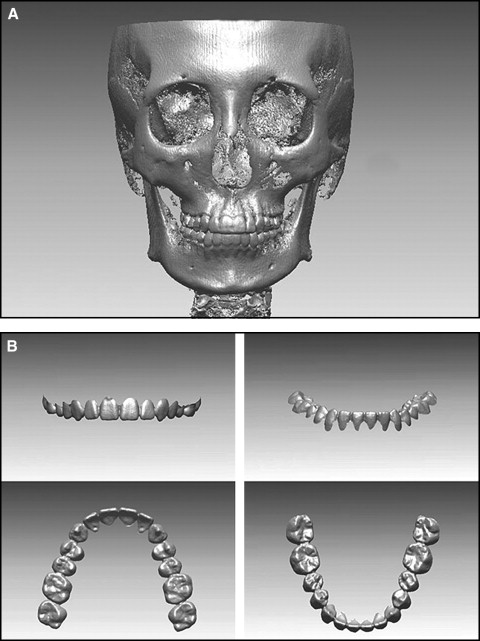
The digital imaging and communication in medicine (DICOM) file obtained from the CBCT was reconstructed into 3D images and then converted to stereolithography format by using a DICOM viewer program (version 1.0, Orapix) ( Fig 1 , A ). The laser-scanned file of the plaster casts was converted to a 3D image by using a 3D reverse engineering software program (Rapidform 2006; Inus, Seoul, Korea). The laser-scanned data, which was a PTS file (Rapidform points file, Inus), was changed from the data consisting of points to polygonal form by using the “triangulate” function. At this time, all data with a side of the polygon greater than 0.5 mm and a facing angle greater than 70° were excluded. After auto-alignment, the dental images were completed by filling detailed parts that could not pass through a laser beam while being scanned, mainly interproximal areas by repeating the “smooth and curvature option” of the “fill hole” function 2 or 3 times. In addition, the data were converted to a FCS file (Rapidform polygon file, Inus). Since the soft-tissue area could increase the error range, the remaining areas were cut out along with the gingival margin to superimpose the clinical crowns alone ( Fig 1 , B ).
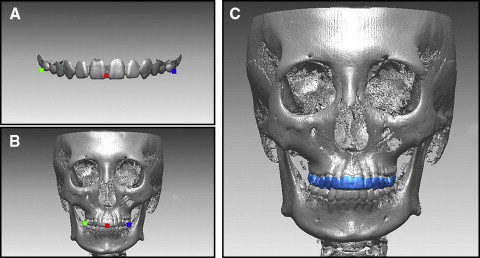
Each laser-scanned image of both arches was registered onto a CBCT image by using the Rapidform 2006 software. Each arch was integrated in 3 ways according to the registration area. First, the initial registration was performed by selecting 3 points corresponding to each laser-scanned image and CBCT image. Subsequently, the regional registration was used to finalize the registration. When a registration area is selected for a regional registration, 3 types of implementation were performed according to the registration area: only the buccal surfaces, only the lingual surfaces, and both the buccal and lingual surfaces ( Fig 2 ).
Surface-based registration was performed with an iterative closest point algorithm, and its errors were evaluated by measuring the 3D Euclidean distances between the surface points on the 2 images, by using the “shell/shell deviation” function in the program. The absolute values were used as the measurements in this study; to remove outliers, the threshold value was set at 1 mm by using the program function. In addition, the differences between the 2 images were evaluated with color-mapping methods.
Statistical analysis
Statistical analysis was carried out by using SPSS software (version 17.0; SPSS, Chicago, Ill). The means and standard deviations of the shell/shell deviation were calculated for all registration methods in each maxillary and mandibular arch. One-way analysis of variance (ANOVA) was used to analyze the differences in shell/shell deviation according to the registration area, and the Tukey test was used for post-hoc comparisons.
Results
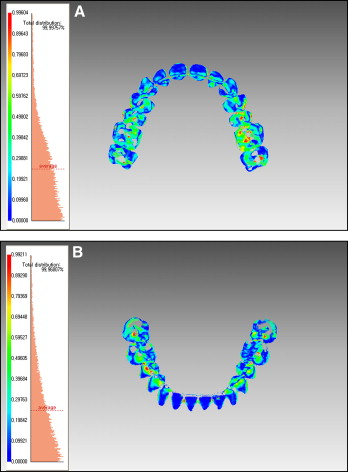
After each registration of the laser-scanned image onto the CBCT image, the differences between the 2 images were expressed in a color scale. Although the gingival margin, occlusal surface, and interdental area showed some discrepancies between the 2 images, most areas showed a blue color, indicating good fitness ( Fig 3 ).
The Table lists the means and standard deviations of the shell/shell deviation in each arch according to the 3 registration methods. Overall, the shell/shell deviation ranged from 0.27 to 0.33 mm. The registration errors were highest with the lingual method and lowest with both the buccal and lingual methods in each arch. Although ANOVA showed no significant differences in the errors according to the registration area in the mandibular arch, there were significant differences between the registration areas in the maxillary arch. The lingual method, which has the smallest registration area, showed a significantly greater error than did the other 2 methods.


