Introduction
The aim of this meta-analysis was to gain more insight into the prevalence of peg-shaped maxillary permanent lateral incisors and their associations with race, population type, sex, and sidedness.
Methods
Electronic searches and supplementary hand searches initially yielded 3337 records. After applying inclusion and exclusion criteria, 30 articles about 36 studies were included. The overall pooled prevalence estimate was calculated with a random-effects model. An estimated risk ratio was used for sex comparison.
Results
The overall prevalence of peg-shaped maxillary permanent lateral incisors was 1.8%. No publication bias was found. The occurrence rates were higher in Mongoloid (3.1%) than in black (1.5%) and white (1.3%) patients, and in orthodontic patients (2.7%) than in the general population (1.6%) and dental patients (1.9%). Women were 1.35 times more likely than men to have peg-shaped maxillary permanent lateral incisors. The prevalence rates of unilateral (0.8%) and bilateral peg-shaped maxillary permanent lateral incisors were approximately the same. However, among the unilateral lateral incisors, the left side (0.4%) was twice as common as the right side (0.2%). In addition, contralateral lateral incisor hypodontia was seen in 55.5% of the subjects with unilateral lateral incisors.
Conclusions
The prevalence of peg-shaped maxillary permanent lateral incisors varies by race, population type, and sex. The prevalence rates were higher among Mongoloid people, orthodontic patients, and women. Although the prevalence of unilateral and bilateral lateral incisors was the same, the left side was twice as common as the right side. Subjects with unilateral peg-shaped maxillary permanent lateral incisors might have a 55% chance of having lateral incisor hypodontia on the contralateral side.
A peg-shaped tooth, defined by Grahnén as the incisal mesiodistal width of the tooth crown shorter than the cervical width, is usually a maxillary permanent lateral incisor (peg-lateral). Leading to esthetic, orthodontic, and periodontal problems for affected persons, peg-laterals are a major concern of general dentists and dental specialists. Although the prevalence rates of peg-laterals have been reported in some survey studies, they varied dramatically from 0.6% to 9.9%.
For over 40 years, the literature has suggested that the occurrence of peg-laterals is associated with the same genetic mechanism that causes agenesis of the maxillary lateral incisors, claiming that the defective gene can express differently in distinct teeth. Granat and Chapelle advocated that in the evolution within a species a tooth is reduced in volume and becomes conic before disappearing. Furthermore, Brook proposed a multifactorial model based on an underlying continuous distribution of tooth size, with thresholds determining hypodontia and supernumerary teeth, and found a general trend that the more severe the hypodontia, the smaller the size of the tooth formed.
In a previous meta-analysis, Polder et al found differences in the prevalence rates of dental agenesis between races, sexes, and continents of origin. Additionally, several studies in the last 15 years have focused on dental anomalies among orthodontic populations and have shown different prevalence values compared with former data derived from general populations. Thus, considering the generally accepted strong association between dental agenesis and peg-laterals, it became an interest to investigate the epidemiologic features of peg-laterals.
According to Jukić et al, the incidence and degree of expression of dental anomalies can provide important information for phylogenic and genetic studies and help understand variations within and between populations. However, the occurrence rate of peg-laterals has not been analyzed in an integrated approach. The aims of this study were to shed insight into the prevalence of peg-laterals using a meta-analysis and to detect its potential relationship with races, sexes, population types, and continents of origin.
Material and methods
This systematic review was written according to the MOOSE standards for the reporting of meta-analyses of observational studies in epidemiology.
The following abstract databases were searched from inception to October 2011: PubMed, Embase, Google Scholar, Cochrane Central Register of Controlled Trials, metaRegister of Controlled Trials, and OpenGrey. To identify underlying useful information in dental surveys, we adopted the search term combinations of “tooth abnormalities” and “prevalence” ( Table I ). After electronic searches and the initial selection process, a supplementary hand search was implemented by checking the references of remaining key studies. No restrictions for language or publication date were used.
| Electronic databases | Search strategy | Hits (n) |
|---|---|---|
| PubMed | (“tooth abnormalities”[MeSH] OR (“tooth”[All Fields] AND “abnormalities”[All Fields]) OR “tooth abnormalities”[All Fields]) AND (“epidemiology”[Subheading] OR “epidemiology”[All Fields] OR “prevalence”[All Fields] OR “prevalence”[MeSH]) | 1624 |
| EMBASE | “tooth”/exp OR tooth AND (“abnormalities”/exp OR abnormalities) AND (“prevalence”/exp OR prevalence) | 1291 |
| Google Scholar | intitle:tooth abnormalities AND prevalence anomalies OR tooth | 400 |
| Cochrane Central Register of Controlled Trials | (tooth abnormalities) AND prevalence | 3 |
| metaRegister of Controlled Trials | (tooth abnormalities) AND prevalence | 0 |
| OpenGrey | (tooth abnormalities) AND prevalence | 0 |
Studies reporting the occurrence rate of peg-laterals were included. The diagnostic standard of peg-shaped teeth similar to that of Grahnén was used: the incisal mesiodistal width of the tooth crown shorter than the cervical width. Prevalence was defined as the number of people with peg-laterals divided by the number of people studied. We excluded all studies that were irrelevant to the prevalence of peg-laterals, studies of other populations or subjects in the primary dentition, and studies that provided no adequate data after we contacted the authors. The details on the predefined inclusion and exclusion criteria are given in Table II .
| Criteria category | Inclusion criteria | Exclusion criteria |
|---|---|---|
| Study design | Cross-sectional or retrospective studies reporting prevalence of peg-shaped maxillary permanent lateral incisors | Studies regarding other tooth abnormalities Studies mixing peg-shaped teeth with microdontia Studies regarding deciduous dentition Studies with each tooth as a study unit |
| Studies using a diagnostic standard the same as or similar to any reduction in mesiodistal crown diameter in a gingivo-incisal direction | Studies concerning treatment, etiology, and theory of peg-shaped teeth Studies about an association between peg-shaped teeth and syndromes |
|
| Studies with each participant as a study unit | Case reports/case series Reviews/systematic reviews |
|
| Characteristics of subjects | Presented exact race and population type of participants (general/patients) | Failed to mention race and population type of participants |
All references identified were compiled into a reference manager (NoteExpress 2; Aegean Software, Beijing, China). Two authors (F.H. and W.B.) performed the search independently using the inclusion and exclusion criteria. Any disagreement was resolved by consultation with a third author (H.H.) until mutual agreement was reached. Full texts were retrieved mainly through the literature delivery service of the library at Wuhan University in China or by directly contacting the corresponding authors. For 7 studies with insufficient data, the authors were contacted, and we received 2 responses.
Two authors (F.H. and W.B.) independently reviewed the selected articles and tabulated the study characteristics with Excel for Windows software (Microsoft, Redmond, Wash). Any difference was resolved by consultation with a professor (H.H.) until mutual agreement was reached. The following data were recorded: demographic information, study design, publication year, sidedness of peg-laterals, number of people affected with peg-laterals (the numerator), and number of people studied (the denominator).
Two authors (F.H. and W.B.) independently performed structured quality assessments according to published methods. The quality system was the following: (1) reasonable age range, (2) proper sample size (neither too large nor too small), (3) either random or consecutive sampling, (4) description of examination method, and (5) exclusive focus on maxillary lateral incisors. Quality was categorized as low (1-2 scores), medium (3-4 scores), or high (5 scores).
Statistical analysis
For data synthesis and heterogeneity assessment, the data were imported into the STATA software (version 12.0; StataCorp, College Station, Tex) to calculate pooled estimates and 95% confidence intervals (CIs) of prevalence. Occurrence rates of comparable subgroups were summarized when possible. For sex comparisons, the estimated risk ratio was obtained using Review Manager 5 software (the Nordic Cochrane Centre, Copenhagen, Denmark).
The Q statistic was used to identify the heterogeneity across studies by checking their P values. The random-effects model was used when heterogeneity was found ( P <0.1); otherwise, the fixed-effects model was adopted. Considering the low power of Q to detect heterogeneity in small samples of studies, we also reported the I 2 metrics.
Small study effects and publication bias were evaluated by visually checking funnel plot asymmetry and quantified through the tests of Begg and Mazumdar and Egger et al using the STATA software.
To investigate the robustness of the pooled estimate, we performed additional sensitivity analyses based on potentially influential factors: study quality, sample size, and age ranges of the subjects.
Results
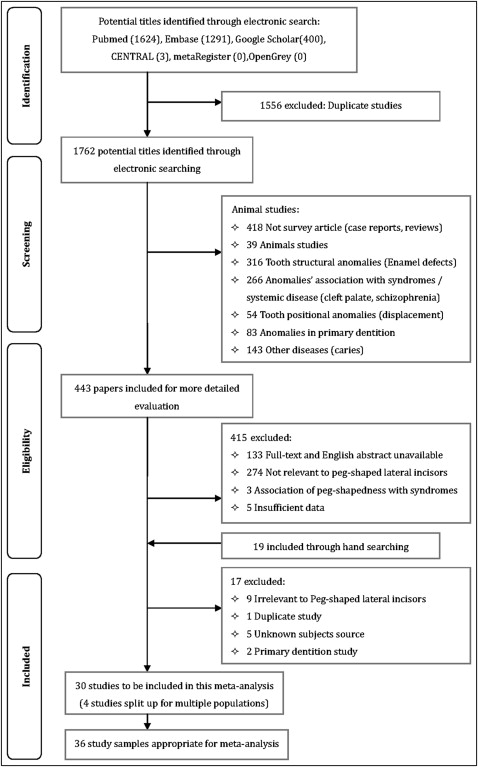
Figure 1 shows the selection process. The searches initially yielded 3337 records (3318 from electronic searches, 19 from hand searches). However, after application of the inclusion and exclusion criteria, only 30 articles from 17 countries comprising 87,172 subjects remained ( Table III ). In studies that included multiple samples of subjects, only those that met our inclusion criteria were used. Three surveys concerned 2 different populations and were thus split into 6 substudies. Another study regarding 4 ethnic groups was divided into 4 substudies. Therefore, this meta-analysis included 36 study and substudy samples on which the following research was based.
| Study | First author, publication year | Country/location | Ethnicity | Population | Age (y) | Subjects (n) (male/female) | Affected (n) (male/female) ∗ | Affected (n) (left only/right only/bilateral) | Overall prevalence (%) | Quality criteria met † |
|---|---|---|---|---|---|---|---|---|---|---|
| 1 | Onyeaso, 2006 | Nigeria/Ibadan | Black | SC | 11-12 | 171/190 | 1/4 | – | 1.4 | 1,3,4 |
| 2 | Sawyer, 1984 | Nigeria/Lagos | Black | SC | 10-19 | 1093/1110 | 14/20 | – | 1.5 | 1,2,3,4 |
| 3 | Rose, 1906 | Germany/– | White | Recruits | – | 12250/0 | 221/0 | – | 1.8 | 4,5 |
| 4 | Dolder, 1936 | Switzerland/– | White | SC | 6-15 | 10000 | 87 | – | 0.9 | 4 |
| 5 | Rantenen, 1955 | Finland/– | White | SC | – | 2200 | 22 | – | 1.0 | 2,4,5 |
| 6 | Grahnén, 1956 | Sweden/– | White | SC | 11-14 | 531/475 | 17 | – | 1.7 | 1,2,4 |
| 7 | Grahnén, 1956 | Sweden/– | White | SC | 17-43 | 547/517 | 14 | – | 1.3 | 1,2,4 |
| 8 | Thilander, 1973 | Sweden/Umea | White | SC | 7-13 | 2664/2795 | 33 | – | 0.6 | 1,2,3,4 |
| 9 | Magnusson, 1977 | Iceland/Reykjavík | White | SC | 8-16 | 521/595 | 6/15 | –/–/11 | 1.9 | 1,2,3,4 |
| 10 | Backman, 2001 | Sweden/Umea | White | Children | 7 | 368/371 | 1/5 | 2/2/2 | 0.8 | 1,2,3,4 |
| 11 | Ling, 1992 | China/Hong Kong | Mongoloid | SC | 12 | 292/161 | 1/2 | – | 0.7 | 1,3,4 |
| 12 | King, 2010 | China/Hong Kong | Mongoloid | SC | 12 | 358/367 | 24 | – | 3.3 | 1,2,3,4 |
| 13 | Wu and Feng, 2005 | China/Beijing | Mongoloid | College students | 17-21 | 3017/3436 | 132/197 | – | 5.1 | 1,2,3,4 |
| 14 | Ooshima, 1996 | Japan/Osaka | Mongoloid | HSS | 15-18 | 391/354 | 13/14 | –/–/12 | 3.6 | 1,2,3,4 |
| 15 | Chung, 1972 | USA/Hawaii | White | HSS | 12-18 | 589 | 10 | – | 1.7 | 1,2,3,4 |
| 16 | Chung, 1972 | USA/Hawaii | Mongoloid | HSS | 12-18 | 828 | 16 | – | 1.9 | 1,2,3,4 |
| 17 | Chung, 1972 | USA/Hawaii | Mongoloid | HSS | 12-18 | 6022 | 97 | – | 1.6 | 1,2,3,4 |
| 18 | Chung, 1972 | USA/Hawaii | Mongoloid | HSS | 12-18 | 833 | 26 | – | 3.1 | 1,2,3,4 |
| 19 | Meskin, 1963 | USA/Minnesota | White | College students | – | 5165/3124 | 43/30 | 25/13/35 | 0.9 | 1,2,3,4,5 |
| 20 | Nayak, 2011 | India/Jodhpur | Indian | SC | 6-15 | 290/210 | 1/1 | – | 0.4 | 2,3,4 |
| 21 | Al-Hummayani, 2005 | Saudi Arabia/Jeddah | White | SC | 11-19 | 0/1500 | 0/20 | – | 1.3 | 1,2,3,4,5 |
| 22 | Salem, 1989 | Saudi Arabia/Gizan | White | SC | 4-12 | 2393 | 89 | – | 0.4 | 2,3,4 |
| 23 | Ucheonye, 2010 | Nigeria/Ibadan | Black | DP | – | 405 | 4 | 0/3/1 | 1.0 | 2,4,5 |
| 24 | Shah, 1978 | Canada/Vancouver | White | DP | – | 7886 | 11/14 | –/–/6 | 0.3 | 2,3,4 |
| 25 | Fujita, 2009 | Japan/Kitakyushu | Mongoloid | DP | 5-19 | 625/723 | 3/6 | 3/2/4 | 0.7 | 1,2,3,4,5 |
| 26 | Stecker, 2007 | USA/Minnesota | Mongoloid | DP | – | 435 | 33 | – | 7.5 | 2,3,4 |
| 27 | Gupta, 2011 | India/Indore | Indian | DP | >14 | 572/551 | 11/18 | –/–/21 | 2.6 | 1,2,3,4 |
| 28 | Albashaireh, 2006 | Jordan/– | White | DP | 16-45 | 1045 | 24 | – | 2.3 | 1,2,4,5 |
| 29 | Ucheonye, 2010 | Nigeria/Ibadan | Black | Ortho | – | 302/363 | 7/8 | –/–/5 | 2.3 | 2,4,5 |
| 30 | Thongudomporn, 1998 | Australia/Queensland | White | Ortho | 10.2-26.4 | 46/65 | 5/6 | 2/0/9 | 9.9 | 1,4 |
| 31 | Basdra, 2001 | Germany/Heidelberg | White | Ortho | 7.2- 45.8 | 204/211 | 3/5 | 4/2/2 | 1.9 | 1,2,3,4 |
| 32 | Basdra, 2000 | Germany/Heidelberg | White | Ortho | 7-44 | 106/161 | 5/15 | 4/3/13 | 7.5 | 1,2,3,4 |
| 33 | Thilander, 1973 | Sweden/Umea | White | Ortho | 7-13 | 429/510 | 16 | – | 1.7 | 1,2,3,4 |
| 34 | Kositbowornchai, 2010 | Thailand/KhonKaen | Mongoloid | Ortho | 12-40 | 124/446 | 31 | –/–/24 | 5.4 | 1,2,3,4 |
| 35 | Kazanci, 2011 | Turkey/Erzurum | White | Ortho | 9-25 | 1225/1940 | 23/45 | 23/11/34 | 2.1 | 1,2,3,4 |
| 36 | Altug-Atac, 2007 | Turkey/Ankara | White | Ortho | 8.5-14.75 | 1385/1658 | 22/24 | –/–/26 | 1.5 | 1,2,4 |
∗ A number without a virgule (/) shows the overall nunber of affected subjects (the study provided no data by sex).
† 1 , reasonable age range; 2 , proper sample size; 3 , either random or consecutive sampling; 4 , description of examination method; 5 , exclusive focus on maxillary lateral incisors.
Characteristics and quality assessments of all included studies are shown in Table III . The articles in this meta-analysis generally reported the number and sex of affected participants, the corresponding sample size, and the sidedness of the peg-laterals. Three types of population were involved in the included surveys: general populations (mainly schoolchildren and college students), dental patients (outpatients who visited dental clinics or hospitals), and orthodontic patients (those who received orthodontic treatment). When we compared the potential impact of races, the studies could be divided into 4 groups: black, white, Mongoloid, and Indian according to a published grouping method.
In general, the overall quality of all included studies was medium ( Table III ). Among the 36 studies and substudies, 3 were low quality, 3 were high quality, and the rest were medium quality.
The authors of 7 studies failed to report the ages of the subjects. Three other studies gave no clear evidence of using radiographs as an aid for diagnosis and included children whose ages were less than 8 years. Since the average ages for permanent lateral incisors to develop complete crowns and emerge are usually 5.5 and 8.25 years, respectively, the inclusion of these studies might have caused a selection bias in this analysis.
In 3 studies, the sample sizes were relatively small (under 500 for the general population study, under 200 for the patient study); this might have compromised their representativeness of the underlying population. On the other hand, the sample sizes of 2 studies were too large (beyond 10,000), causing the danger of overlooking affected subjects and therefore underestimating the prevalence rates. The inclusion of studies with improper sample sizes can lead to information bias.
The pooled overall prevalence of peg-laterals in this analysis was 1.8% (95% CI, 1.5-2.1) ( Fig 2 ).
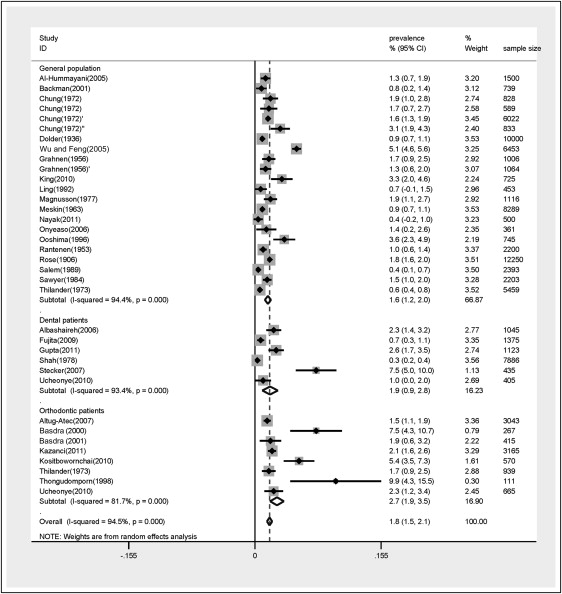
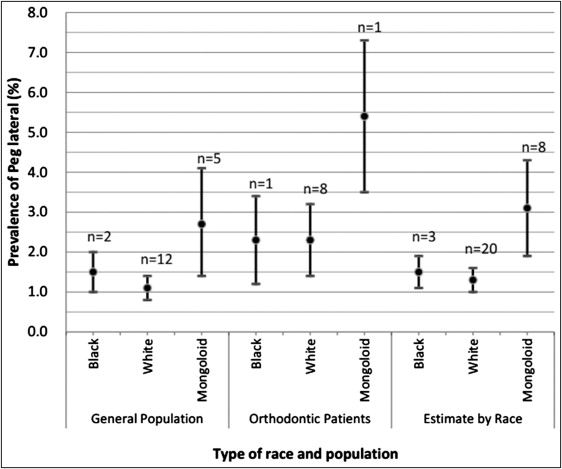
The pooled estimates according to race and population type are presented in Table IV , which also shows the heterogeneity and significance information of each subgroup. The occurrence rate of peg-laterals among Mongoloid subjects (3.1%; 95% CI, 1.9-4.3) was significantly higher than that of black (1.5%; 95% CI, 1.1-1.9) and white (1.3%; 95% CI, 1.0-1.6) subjects ( Fig 3 ).
| Race | Population | Cases/total (number of studies) | Pooled estimate (%) | 95% CI | Heterogeneity | Significance | ||
|---|---|---|---|---|---|---|---|---|
| I 2 | P value | Z | P value | |||||
| Black ∗ | G | 39/2564 (2) | 1.5 | 1.0-2.0 | 0.0% | 0.881 | 6.22 | 0.000 |
| DP | 4/405 (1) | 1.0 | 0.0-2.0 | – | – | |||
| Ortho | 15/665 (1) | 2.3 | 1.2-3.4 | – | – | |||
| Subtotal | 58/3634 (4) | 1.5 | 1.1-1.9 | 0.0% | 0.401 | 7.45 | 0.000 | |
| White | G | 613/46605 (12) | 1.1 | 0.8-1.4 | 88.2% | 0.000 | 7.51 | 0.000 |
| DP | 49/8931 (2) | – | – | – | 1.25 | 0.212 | ||
| Ortho | 169/7940 (6) | 2.3 | 1.4-3.2 | 79.1% | 0.000 | 5.29 | 0.000 | |
| Subtotal | 831/63476 (20) | 1.3 | 1.0-1.6 | 92.5% | 0.000 | 8.61 | 0.000 | |
| Mongoloid | G | 522/16059 (5) | 2.7 | 1.4-4.1 | 95.9% | 0.000 | 3.94 | 0.000 |
| DP | 42/1810 (2) | – | – | – | 1.17 | 0.241 | ||
| Ortho | 31/570 (1) | 5.4 | 3.5-7.3 | – | – | |||
| Subtotal | 595/18439 (8) | 3.1 | 1.9-4.3 | 96.0% | 0.000 | 5.23 | 0.000 | |
| Indian | G | 2/500 (1) | 0.4 | −0.2-1.0 | – | – | ||
| DP | 29/1123 (1) | 2.6 | 1.7-3.5 | – | – | |||
| Subtotal | 31/1623 (2) | – | – | – | 1.33 | 0.182 | ||
| Overall | G | 1176/65728 (22) | 1.6 | 1.2-2.0 | 94.4% | 0.000 | 8.32 | 0.000 |
| DP | 124/12269 (6) | 1.9 | 0.9-2.8 | 93.4% | 0.000 | 3.83 | 0.000 | |
| Ortho | 215/9175 (8) | 2.7 | 1.9-3.5 | 81.7% | 0.000 | 6.28 | 0.000 | |
| Total | 1515/87172 (36) | 1.8 | 1.5-2.1 | 94.5% | 0.000 | 11.03 | 0.000 | |
The prevalence values in the general population, dental patients, and orthodontic patients were pooled at 1.6% (95% CI, 1.2-2.0), 1.9% (95% CI, 0.9-2.8), and 2.7% (95% CI, 1.9-3.5), respectively. Because of insufficient data, pooled prevalence values for the Indian race and dental patients of white and Mongoloid ethnicities were not obtainable (z-value, P >0.05).
For investigations on the impact of continent of origin, difference between sexes, and prevalence by side, not all studies could be used due to insufficient information. In studying the impact of continent of origin among general populations of the same race, the prevalence for Mongoloid people in Asia (3.2%; 95% CI, 0.8-5.5) was found to be a little higher than that for Mongoloid people in North America (2.0%; 95% CI, 1.3-2.8), and the prevalence for white people in Europe (1.2%; 95% CI, 0.8-1.6) was also slightly higher than that for North American white people (0.9%; 95% CI, 0.7-1.1) ( Table V ).


