Introduction
Recent studies have shown some contradictory results when evaluating the consequences of orthodontic-surgical treatments on the pharyngeal airway. Therefore, the purpose of this study was to correlate the amount of jaw displacement with the volume variation and the minimal cross-sectional area of the pharyngeal airway. A comparison was made between the correlations with the percentage and the absolute values of the measurement variations.
Methods
Forty-two patients were divided into 2 groups according to the kind of orthognathic surgery that they had undergone. Group 1 had 22 subjects who had undergone maxillary advancement associated with mandibular setback, and group 2 had 20 patients who had undergone maxillomandibular advancement. The pharyngeal airway was divided into the upper segment and the lower segment, and the sum of these volumetric measures resulted in the total volume. The maxillary and mandibular displacements were assessed using closest point iteration after a voxel-wise cone-beam computed tomography superimposition. Hence, jaw displacements were correlated, using Pearson’s correlation and linear regression analysis, to the volume variations of the pharyngeal airway (first time separately and then both groups together) and to the minimal cross-sectional area variation.
Results
The strongest correlation found was between maxillary displacement and the upper segment in group 2 (r = 0.898, R 2 = 0.888; P ≤0.001). With the groups’ data combined, the variables mandibular displacement and the lower segment showed a linear correlation (r = 0.921, R 2 = 0.914; P ≤0.001). Maxillary displacement showed a strong positive correlation with the minimal cross-sectional area variation in group 2 (r = 0.710, R 2 = 0.604; P ≤0.01).
Conclusions
Correlations with the percentage values were substantially stronger than the correlations with the absolute values. Stronger positive correlations were found between the jaw’s displacement and the volume variation of the volume segment that was closer to it in both kinds of surgeries. Only the maxillary displacement is a reliable predictor of the minimal cross-sectional area variation after maxillomandibular advancement.
Highlights
- •
Jaw displacement was correlated with percentage of volume variation.
- •
Mandibular displacement influenced the upper volume segment.
- •
Pharyngeal airway changes should be assessed by comparing percentage values, not absolute values.
- •
Variation of the pharyngeal airway upper volume should be predicted separately for each kind of orthognathic surgery.
Alterations of the dimensions of the pharyngeal airway (PA) after surgical-orthodontic treatment have been the subject of numerous studies confirming the importance of the dimensions of the PA to a good quality of life. A recent systematic review elucidated the importance of craniofacial and PA morphologies on the etiology of obstructive sleep apnea. Nevertheless, there is still sparse evidence of the type and severity of these alterations, especially regarding the 3-dimensional (3D) measurements. This is true primarily because most of the studies assessing these changes had used cephalometric radiographs that provided only 2-dimensional (2D) measurements in a lateral view, worsened by structure superimpositions. In addition, those that actually had used 3D images adopted different methodologies, compromising comparisons between them and weakening the evidence.
Cone-beam computed tomography (CBCT) has given a greater power of analysis to orthodontists and oral surgeons, providing accurate 2D and 3D measurements of the PA—for example, cross-sectional area and volume, respectively. Although with the current technology the patient might be exposed to a higher level of radiation than customary orthodontic digital records, the benefits for surgical-orthodontic patients are evident: a more comprehensive sagittal and lateral analysis; the possibility of multiple 2D or 3D virtual planning simulations of the surgical movements; and prototyping of a surgical guide—in association with digital models—for more predictable surgical results. Moreover, current imaging technology allows a voxel-wise computed cranial base superimposition of the preoperative and postoperative CBCT scans, permitting a reliable assessment of jaw displacement after the orthognathic surgery.
Few studies have tried to correlate the surgical displacement of the jaws with the PA’s dimension alterations, and most used 2D cephalometric radiographs in their evaluations. The studies that used 3D assessment had correlated the jaw displacements with the absolute values of the volume variation ; this seems not to be a reliable correlation concerning the wide variation of the PA volume according to face morphology and other factors.
Therefore, the purpose of this study was to correlate the degrees of maxillary and mandibular displacement arising from surgical-orthodontic treatment with the volume and the minimal cross-sectional area variation of the PA and compare the strength of these correlations between absolute and percentage assessments of the measurement variations.
Material and methods
The project was approved by the research ethics committee of the Institute of Collective Health Studies from the Federal University of Rio de Janeiro. A sample calculation, based on previous studies, showed that at least 17 subjects would be necessary in each group to detect differences of 65 mm 2 in the minimal cross-sectional area and 2500 mm 3 in the PA volume, with a power of 0.8 and a significance level of 0.05.
All the patients were selected from the archives of Hospital da Face (São Paulo, SP, Brazil) from a pool of 338 operated patients. None had a documented diagnosis of obstructive sleep apnea. The selection process was carried out in 2 phases. In the first phase, these inclusion criteria were applied: (1) patients from 18 to 30 years of age, (2) preoperative and postoperative CBCT scans taken with the same machine, (3) the postoperative scan taken from 5 to 8 months after surgery (immediately after bracket debonding), and (4) craniocervical inclination between 90° and 110°. Exclusion criteria applied were (1) important maxillary and mandibular transverse asymmetry, (2) chin augmentation, (3) syndromic patients, and (4) evident airway pathology. The second phase comprised 2 specific steps: preoperative (T1) and postoperative (T2) scans of the eligible patients were loaded into Dolphin Imaging software (version 11.5; Dolphin Imaging & Management Solutions, Chatsworth, Calif). The head orientation was performed by an experienced operator (D.P.B.): the horizontal reference was the Frankfort horizontal plane (FHP), defined bilaterally by porion and right orbitale landmarks, parallel to the floor; the midsagittal plane (MSP), vertically oriented and defined by nasion, anterior nasal spine, and basion; and the transporionic plane, defined by bilateral porion landmarks and oriented perpendicular to the FHP and the MSP.
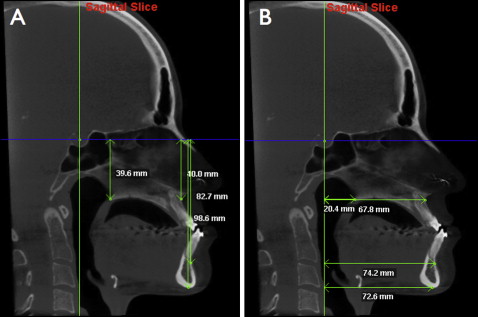
On step 1 of the second phase, 5 points were used on the MSP: S point, posterior nasal spine (PNS), A-point, B-point, and menton. S point served as a reference for the delineation of the horizontal reference line (parallel to the FHP) and the vertical reference line (perpendicular to the FHP). A vertical analysis ( Fig 1 , A ) and a horizontal analysis ( Fig 1 , B ) were performed on the T1 and T2 scans. The purpose of the vertical analysis was to exclude patients with substantial vertical variations (greater than 2 mm for any point between T1 and T2) from the sample. The horizontal analysis excluded patients with anteroposterior variations of less than 3 mm for either A-point or B-point, to ensure that only patients with significant anteroposterior jaw displacement would be selected.
In the second step, 2 customary cephalometric measurements were performed on the T1 and T2 scans as well. If the palatal plane or the occlusal plane had a variation greater than 5° (either clockwise or counterclockwise), the patient was eliminated from the study. This criterion was applied to better visualize the PA modifications after isolated anteroposterior jaw movements.
At the end of the selection, 42 subjects were selected, of which 22 (10 male, 12 female) had undergone maxillary advancement associated with mandibular setback and were allocated to group 1. The other 20 (8 male, 12 female) had undergone maxillomandibular advancement and constituted group 2 ( Table I ).
| Group | n | Age (y, mean ± SD) | P |
|---|---|---|---|
| 1 | 22 | 23.02 ± 2.98 | 0.029 |
| 2 | 20 | 24.77 ± 2.79 |
All CBCT scans were taken with an i-CAT machine (Imaging Sciences International, Hatfield, Pa) by the same radiology technician. The scanning protocol was 120 kV, 5 mA, 13 × 17 cm field of view, 0.4 mm voxel, and scanning time of 20 seconds. The patients had been told to maintain natural head position, to keep the teeth in occlusion, to not swallow, and to breathe smoothly during the examination. All scans were requested as a part of the initial or final records of the orthodontic treatment. The same oral surgeon (L.V.) was responsible for all the surgical procedures, performing a LeFort 1 osteotomy for the maxilla and a bilateral sagittal split osteotomy for the mandible. Titanium plates were used for rigid fixation of the jaws.
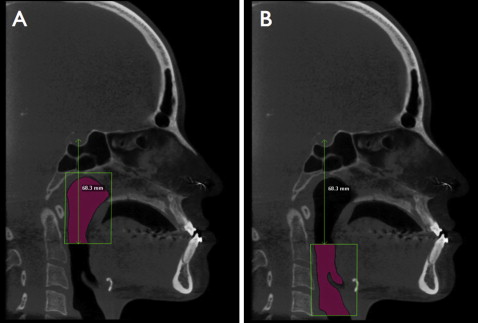
For the volume assessment, the PA was divided into 2 segments using the “sinus/airway” tool of the Dolphin3D software. The superior segment (VolA) had the following limits (on the MSP): superior limit, line parallel to the FHP through the most superior point of the PA ; anterior limit, line perpendicular to the FHP through the most anterior and inferior point of the sphenoidal sinus; inferior limit, line parallel to the FHP through the most concave point of the anterior and inferior wall of the second cervical vertebra; posterior limit, line perpendicular to the FHP through the most posterior point of the pharynx (posterior wall) ( Fig 2 , A ). The lower segment (VolB) had the same anterior and posterior limits as VolA. Its superior limit was the same as VolA’s inferior limit, and its inferior limit was a line parallel to the FHP through the most inferior and anterior point of the fourth cervical vertebra ( Fig 2 , B ). The total volume (VolTo) was obtained by the sum of both segments’ volumes. The division limit of the 2 segments was measured (perpendicular distance from the limit line to S point) at T1 and reproduced on the T2 scan, with the aid of the reference line. The minimal cross-sectional area (min CSA) was assessed by the “sinus/airway” tool as well. The upper and lower limits and the threshold (sensitivity) used were the same as the ones determined for the volumetric measurements; once they were set, the software indicated the most constricted point of the PA. All measurements were performed on the T1 and T2 scans, and their variations were assessed through percentage (T2/T1−1) and absolute (T2−T1) values.
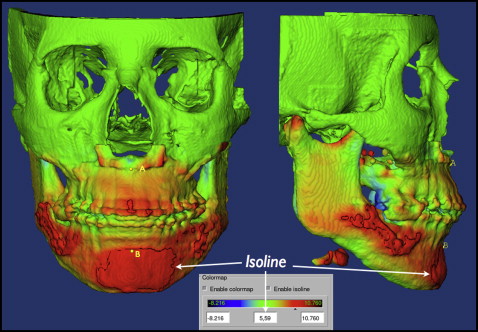
To obtain the jaw displacement, a method of CBCT scan superimposition that has already been described and tested in the literature was used. In summary, the cranial base and both jaws were segmented from the T1 and T2 scans using the ITK-SNAP open-source software. With the software IMAGINE (developed by the National Institutes of Health, Bethesda, Md, and modified at the University of North Carolina, Chapel Hill), a voxel-wise method for cranial base superimposition was performed using T1 as the reference and moving T2 with 6 degrees of freedom. Then, 3D surface models were imported to CMF software (Maurice Muller Institute, Bern, Switzerland) that allows quantifying the distance between 2 surfaces at any location. Details of this methodology of superimposition can be found in the study of Carvalho et al. Two tools of the CMF—color map and isoline—were used to assess the distance of A-point and B-point between the T1 and T2 scans ( Fig 3 ). The A-point distance represented maxillary 3D displacement and B-point the mandibular 3D displacement.
The volume variation of each segment and the min CSA area were correlated (Pearson correlation) with the jaw displacement, and a linear regression model was proposed. At first, the groups were analyzed separately, and then the data were combined and the tests redone just for the volume variations. All measurements of the 20 patients were repeated after a 2-week interval for the calibration test. A t test for independent samples was performed to detect differences between the groups concerning baseline volumetric measurements and the amount of displacement of the jaws. All statistical tests were performed using SPSS software (version 17.0; SPSS, Chicago, Ill).
Results
All the measurements showed excellent intraclass correlation coefficients, higher than 0.9 ( Table II ). The baseline measurements had no statistical differences between sexes or groups.
| Measurement | ICC |
|---|---|
| VolA | 0.941 |
| VolB | 0.934 |
| VolTo | 0.948 |
| min CSA | 0.902 |
| Maxillary displacement | 0.964 |
| Mandibular displacement | 0.939 |
VolA variation percentages for groups 1 and 2 were 14.90% ± 6.51% and 31.11% ± 12.48%, respectively, and VolB’s were −2.05% ± 2.57% and 26.49% ± 9.34%, respectively. The maxilla had similar displacements in the 2 groups ( P = 0.098), whereas the mandible had evident differences ( Table III ).
| Group | Mean | SD | Median | Minimum | Maximum |
|---|---|---|---|---|---|
| 1 | |||||
| Mx (A-point) | 5.06 | 0.86 | 4.95 | 3.87 | 6.98 |
| Md (B-point) | −5.25 | 0.95 | −5.02 | −7.27 | −4.18 |
| 2 | |||||
| Mx (A point) | 4.74 | 1.09 | 4.71 | 3.09 | 7.36 |
| Md (B point) | 6.34 | 1.58 | 6.00 | 4.16 | 9.14 |
The majority of the correlations—13 of 16—showed greater strengths when made with the percentage value and so were used to describe the results ( Table IV ). Stronger correlations were found between the jaw and the volume segment that was closer to it in both groups ( Fig 4 ). In contrast, jaws seem to have little influence on the more distant segments. The strongest correlation and best goodness of fit to the linear regression model (expressed by R 2 ) were observed between the maxillary displacement and VolA percentage variation (VolA%) in group 2 (r = 0.898, R 2 = 0.888; P ≤0.001). “R 2 = 0.888” means that 88.80% of the variation in VolA% could be explained by the respective maxillary displacement, showing that the latter is a good predictor of VolA’s percentage variation. When total volume correlations were analyzed (Max-VolTo% and Mand-VolTo%), the maxilla showed a higher influence than did the mandible. When the volumetric data of both groups were analyzed together (n = 42), the variables Max-VolA% showed a bad adjustment to the regression model (r = 0.587, R 2 = 0.345; P ≤0.01). There was a statistical difference on the VolA% variation in the groups ( P ≤0.001), despite their similar maxillary displacements ( P ≤0.001) ( Fig 5 ). Regarding the correlation Mand-VolB% with the combined data, the strongest correlation and the best adjustment to the regression model (r = 0.921, R 2 = 0.914; P ≤0.001) of the entire study were found ( Fig 5 ).
| Group | Mean ± SD | Median | Minimum | Maximum |
|---|---|---|---|---|
| 1 | ||||
| VolA | 14.90 ± 6.51 | 13.62 | 4.36 | 30.71 |
| VolB | −2.05 ± 2.57 | −1.64 | −7.01 | 2.46 |
| VolTo | 6.04 ± 3.63 | 6.04 | 1.30 | 13.97 |
| min CSA | −9.73 ± 27.42 | −5.5 | −50.53 | 27.42 |
| 2 | ||||
| VolA | 31.11 ± 12.48 | 29.81 | 16.52 | 71.73 |
| VolB | 26.49 ± 9.34 | 21.89 | 16.21 | 45.98 |
| VolTo | 28.50 ± 8.74 | 25.37 | 16.44 | 52.30 |
| min CSA | 56.91 ± 25.10 | 54.61 | 12.9 | 108.43 |
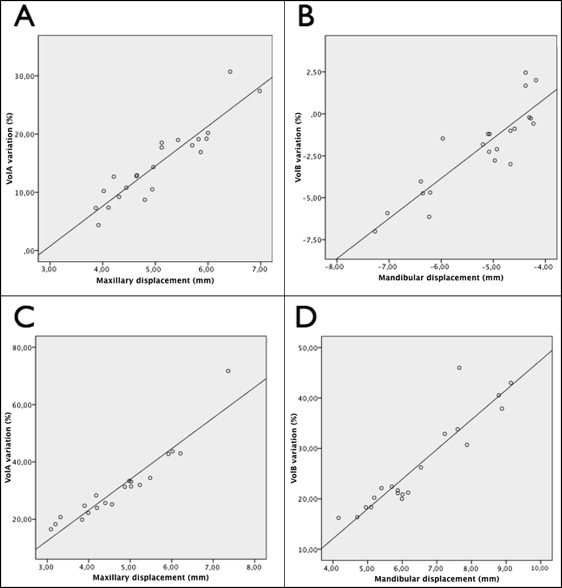

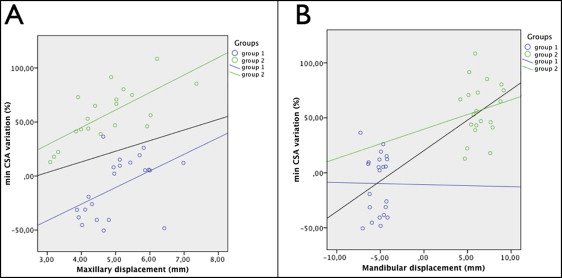
The min CSA percentage variation presented a linear variation just when correlated with the maxillary displacement (r = 0.710, R 2 = 0.604; P ≤0.01) on the maxillomandibular advancement surgery ( Fig 6 ). In group 1, neither the maxillary nor the mandibular displacement could be considered a good predictor for the min CSA% variation ( Table V ).
| Group | Absolute (T2−T1) | Percentage (T2/T1−1) | ||
|---|---|---|---|---|
| r | R 2 | r | R 2 | |
| 1 | ||||
| Max-VolA | 0.677 † | 0.612 † | 0.841 ‡ | 0.812 ‡ |
| Max-VolB | 0.056 | 0.003 | 0.106 | 0.011 |
| Max-VolTo | 0.656 † | 0.402 † | 0.783 ‡ | 0.611 ‡ |
| Mand-VolA | 0.053 | 0.003 | 0.159 | 0.025 |
| Mand-VolB | 0.702 † | 0.503 † | 0.879 ‡ | 0.769 ‡ |
| Mand-VolTo | 0.494 ∗ | 0.244 ∗ | 0.411 ∗ | 0.169 |
| Max-min CSA | 0.212 | 0.045 | 0.486 ∗ | 0.312 |
| Mand-min CSA | 0.81 | 0.038 | 0.084 | 0.051 |
| 2 | ||||
| Max-VolA | 0.810 ‡ | 0.668 ‡ | 0.898 ‡ | 0.888 ‡ |
| Max-VolB | 0.280 | 0.078 | 0.205 | 0.093 |
| Max-VolTo | 0.708 † | 0.573 † | 0.804 ‡ | 0.647 ‡ |
| Mand-VolA | 0.146 | 0.021 | 0.160 | 0.026 |
| Mand-VolB | 0.794 † | 0.679 † | 0.861 ‡ | 0.846 ‡ |
| Mand-VolTo | 0.559 ∗ | 0.311 ∗ | 0.644 † | 0.414 ∗ |
| Max-min CSA | 0.485 ∗ | 0.258 ∗ | 0.710 † | 0.604 † |
| Mand-min CSA | 0.308 | 0.172 | 0.215 | 0.088 |
Stay updated, free dental videos. Join our Telegram channel
VIDEdental - Online dental courses


