Introduction
To obtain the balance and harmony of the soft tissue facial profile in orthodontic treatment, it is necessary to identify the characteristics of overlying soft tissues according to the horizontal and vertical skeletal patterns. The aim of this study was to evaluate the perioral soft tissue characteristics of skeletal Class II Division 1 subjects (group II) with various vertical patterns compared with skeletal Class I subjects (group I).
Methods
Lateral cephalograms of 99 Korean adults (44 women, 45 men; mean age, 23.4 years) were divided into 4 groups based on horizontal and vertical skeletal pattern (SN-MP angle): group I, 22 subjects; group II-low angle (<27°), 14 subjects; group II-normal angle (27°-36°), 33 subjects; and group II-high angle (>37°), 30 subjects. The correlations and multiple linear regression tests were used to determine the skeletal and dental variables influencing soft tissue characteristics.
Results
Group II-high angle showed significantly greater values than did group II-low angle for basic lower lip thickness and lower lip length. The perioral soft tissue measurements of group II were correlated with the inclination and anteroposterior position of the maxillary and mandibular incisors along with facial depth (N-Go) and facial length (S-Gn). Upper lip strain of group II was not influenced by any skeletal variables but only by the inclination and anteroposterior position of the maxillary incisors.
Conclusions
Clinicians need to evaluate lip strain and lip thickness based on the skeletal pattern as well as dental inclination to obtain balance in the perioral muscle activity.
Highlights
- •
We evaluated soft tissue thickness and length in skeletal Class II Division 1 subjects.
- •
Upper lip strain was influenced by maxillary incisor anteroposterior position.
- •
Upper lip strain was not influenced by skeletal variables.
- •
Lower lip thickness and length were greater with a high mandibular plane angle than with low.
- •
Lip strain and lip thickness were affected by skeletal and dental patterns.
There is no doubt that improving the balance and harmony of the face is a main purpose of orthodontic treatment, satisfying objective treatment goals and subjective patient desires simultaneously. Therefore, it is necessary to consider facial appearance determined by soft tissue analysis as well as the underlying skeletal pattern in orthodontic treatment planning. The important aspect of soft tissue analysis has been acknowledged by several investigators, and it has been suggested that it is inadequate to use hard tissue analysis alone for orthodontic diagnosis and treatment planning.
The interrelationship between the soft tissue profile and the underlying skeletal pattern has been reported by many researchers, but this issue still remains controversial. Riedel stated that there are strong interconnections between the skeletal pattern and the soft tissue profile, whereas others have suggested that the soft tissue profile was not matched to the skeletal pattern because of the variations of individual factors. In this study, we assumed that the soft tissue thickness would be influenced by the sagittal and vertical positions of the underlying hard tissues, including the skeletal and dental positions.
Evaluating soft tissue thickness is important to determine the facial profile, and it is considered a major factor for predicting treatment outcomes for orthodontic retraction of the maxillary incisors. Previous studies have reported a high correlation between soft tissue change and osseous change after incisor retraction, and different soft tissue responses have been explained by soft tissue thickness and lip strain. Oliver found a stronger correlation between dental changes and soft tissue changes in patients with thin lips compared with those with thick lips. Holdaway analyzed upper lip strain to visualize final lip position and reported that lip strain was affected by protruding teeth and lack of vertical growth. Therefore, obtaining information on the characteristics of soft tissue thickness is crucial for establishing treatment objectives to achieve a balanced facial profile.
Most of the studies that evaluated the soft tissue thicknesses have been carried out with subjects with normal skeletal patterns, and a few studies have investigated the soft tissue thickness of patients with different skeletal classifications. Utsuno et al investigated the soft tissue thickness of patients with different skeletal classifications in Japanese girls (ages 6-16 years) and women (ages 17-33 years). They reported differences among them in mean facial soft tissue thicknesses, and the greatest differences were found between skeletal Class II and Class III, with Class I being intermediate. Kamak and Celikoglu made similar measurements in Turkish adults and found soft tissue thickness differences among skeletal classifications at the labrale superius, stomion, and labrale inferius for both men and women.
However, these studies had limitations because they evaluated only specific age, sex, and ethnic groups. For example, ethnic diversities exist in the midface structures, with Asian populations having less convexity than white populations. Therefore, more objective soft tissue cephalometric guidelines providing reference values of overlying soft tissue thicknesses for each ethnic group would be requisite for enhanced treatment planning.
About 25% of patients have a skeletal Class II malocclusion, and some distinct aspects of the soft tissues have been observed. Several studies have evaluated the differences in the soft tissue thicknesses between skeletal Class I and Class II groups. In the study of Kim et al, soft tissue characteristics according to lateral cephalometry of skeletal Class II were evaluated and showed significant differences in the length of the soft tissues between skeletal Class I and Class II patients. However, this study did not divide the skeletal Class II subjects into Division 1 and Division 2 groups. Soft tissue profiles can be influenced not only by skeletal pattern but also by dental position, and this is the focus with the characteristics of skeletal Class II Division 1 in this study.
Also, because differences in the vertical pattern could result in diverse demonstrations in soft tissue facial profiles, it should be considered when planning the treatment as well. Therefore, we evaluated the perioral soft tissue characteristics of skeletal Class II Division 1 patients with different vertical patterns. The aims of this study were to determine the characteristics of perioral soft tissues in Korean adults with skeletal Class II Division 1 malocclusions according to vertical mandible patterns compared with subjects with normal occlusion in skeletal Class I and to evaluate correlative skeletal and dental variables affecting soft tissue thickness using cephalometric analysis.
Material and methods
Based on the inclusion criteria, the study sample included 99 Korean adults, comprising 22 controls (11 men, 11 women; mean age, 24.6 years) and 77 in the experimental group (34 men, 43 women; mean age, 23.2 years). The control group (group I) was from the normal occlusion sample (77 men, 113 women; mean age, 26.9 years; range, 18.1-53.5 years) at the Institute of Craniofacial Deformity at Yonsei University in Seoul, Korea, selected from dental students who volunteered between 2000 and 2010. The experimental group (group II) was screened from adult skeletal Class II patients who were untreated and visited the Yonsei University dental hospital between 2008 and 2011. The inclusion criteria for group I were skeletal Class I, natural dentition, no missing teeth except for the third molars, no alteration of facial morphology or crowding of dental occlusion, and Class I canine and molar relationships with normal overjet (2 mm) and overbite (2 mm). The inclusion criteria for group II were skeletal Class II Division 1 (ANB angle, >4°; Wits appraisal, >0 mm; maxillary central incisor to SN, >95°) and Class II canine and molar relationship with mild crowding (arch length discrepancy, <4 mm). Exclusion criteria were previous orthodontic treatment or orthognathic surgery, or a craniofacial anomaly. Patients with a large overjet exceeding 10 mm and anterior open bite were also excluded from group II. Subjects with the lips open on the radiographs were excluded from this study.
The experimental group was stratified into 3 groups according to vertical pattern based on the sella-nasion to mandibular plane angle (SN-MP) : (1) low angle (group II-L): SN-MP <27° (n = 14; 7 men, 7 women; mean age, 23.9 years), (2) normal angle (group II-N): SN-MP 27° to ≤36° (n = 33; 17 men, 16 women; mean age, 23.0 years), and (3) high angle (group II-H): SN-MP >36° (n = 30; 10 men, 20 women; mean age, 23.3 years). MP was defined as a plane from constructed gonion to menton. The mean SN-MP angles were 32.4° ± 2.8° for group I and 24.5° ± 2.7°, 31.9° ± 2.7°, and 43.4° ± 5.1° for groups II-L, II-N, and II-H, respectively.
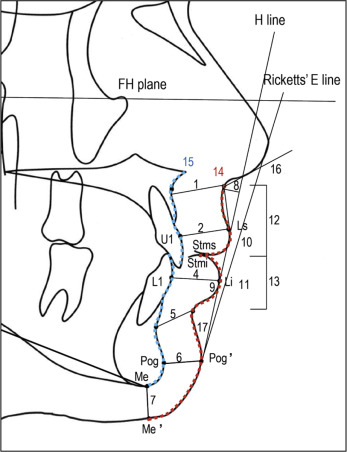
Standardized digital lateral cephalograms were taken with the Cranex3+ Ceph (Soredex, Milwaukee, Wis) with the head in a natural position. When the lateral radiographs were taken, the patients were guided to close their lips in the rest position. V-Ceph software (version 3.5; Cybermed, Seoul, Korea) was used to obtain the cephalometric measurements. The radiographic magnification of the cephalograms was standardized at 100% actual size, with a 100-mm metal ruler image captured in the digital film as the reference. The following skeletal and dental measurement were identified: SNA, SNB, ANB, Wits appraisal (AO-BO), SN-MP, FMA, facial length (S-Gn), facial depth (N-Go), facial height ratio (S-Go/N-Me), U1 to SN, U1 to NA (in millimeters and degrees), L1 to NB (in millimeters and degrees), IMPA, interincisal angle, maxillary incisor exposure, overjet, and overbite. The soft tissue measurements are summarized in the Figure .
Statistical analysis
All statistical analyses were performed with SPSS software (version 18.0; SPSS, Chicago, Ill). Cephalometric measurements were made with the V-Ceph software by an experienced, masked operator (Y.J.L.). Within a period of 2 weeks, 10 cephalograms, randomly selected, were digitized by the same operator, and intraclass correlation coefficients were determined to assess intraobserver reliability. The mean and the standard deviation for each cephalometric variable were determined in each group. All statistical analyses assumed normal distribution according to the Kolmogorov-Smirnov test ( P >0.05). The comparisons among the groups (groups I, II-L, II-N, and II-H) were performed using 1-way analysis of variance. The post hoc Scheffé test was used to analyze the differences between the groups. In addition to these tests, the independent t test was used to compare the mean values of the measurements between the sexes. The Pearson correlation analysis and multiple linear regression were used to determine the variables affecting soft tissue characteristics. A P value less than 0.05 was considered statistically significant.
Results
The average intraclass correlation coefficient of the cephalometric analysis was 0.93 (range, 0.89-0.99) for the linear and angular measurements. The error of the method was measured according to Dahlberg’s formula : 0.45 mm for linear measurements and 1.2° for angular measurements. Kolmogorov-Smirnov normality tests showed that the data had a normal distribution.
Facial length (sella-gnathion) showed a significantly greater value in group I than in groups II-N and II-H ( Table I ). Facial depth (nasion-gonion) had a lower value in group II-H than in groups II-L and II-N. The values for L1 to NB (in millimeters and degrees) were statistically lower in group I than in groups II-N and II-H. Also, the values for L1 to NB (in millimeters and degrees) were significantly lower in group II-L than in groups II-N and II-H.
| Group I | Group II-L | Group II-N | Group II-H | Significance | ||||||
|---|---|---|---|---|---|---|---|---|---|---|
| I/II-L | I/II-N | I/II-H | II-L/II-N | II-L/II-H | II-N/II-H | |||||
| Skeletal measurements | ||||||||||
| SN to MP (°) | 32.4 ± 2.8 | 24.5 ± 2.7 | 31.9 ± 2.7 | 43.3 ± 5.1 | ∗ | NS | ∗ | ∗ | ∗ | ∗ |
| FMA (°) | 24.5 ± 3.1 | 17.3 ± 3.5 | 25.5 ± 3.6 | 33.8 ± 6.4 | ∗ | NS | ∗ | ∗ | ∗ | ∗ |
| SNA (°) | 81.3 ± 3.9 | 84.4 ± 2.7 | 83.8 ± 3.0 | 80.4 ± 2.9 | NS | NS | NS | NS | NS | NS |
| SNB (°) | 78.8 ± 3.7 | 78.8 ± 2.8 | 77.7 ± 2.6 | 74.3 ± 2.9 | NS | NS | ∗ | NS | ∗ | ∗ |
| ANB (°) | 2.5 ± 1.0 | 5.7 ± 1.3 | 6.0 ± 1.4 | 6.2 ± 1.5 | ∗ | ∗ | ∗ | NS | NS | NS |
| Wits (mm) | −2.4 ± 2.2 | 4.7 ± 2.7 | 3.5 ± 2.4 | 2.4 ± 2.0 | ∗ | ∗ | ∗ | NS | ∗ | NS |
| Facial length (mm) | 139.1 ± 9.1 | 131.1 ± 10.1 | 131.9 ± 9.6 | 130.6 ± 8.3 | NS | ∗ | ∗ | NS | NS | NS |
| Facial depth (mm) | 134.6 ± 5.2 | 137.2 ± 9.2 | 132.1 ± 8.0 | 127.0 ± 7.5 | NS | NS | ∗ | NS | ∗ | ∗ |
| Facial height ratio (%) | 67.7 ± 2.8 | 74.5 ± 2.7 | 68.6 ± 2.6 | 60.1 ± 4.0 | ∗ | NS | ∗ | ∗ | ∗ | ∗ |
| Dental measurements | ||||||||||
| U1 to SN (°) | 106.4 ± 5.0 | 108.0 ± 10.8 | 108.9 ± 7.5 | 103.2 ± 7.1 | NS | NS | NS | NS | NS | NS |
| U1 to NA (°) | 25.1 ± 3.6 | 24.2 ± 10.4 | 25.1 ± 7.6 | 22.8 ± 6.2 | NS | NS | NS | NS | NS | NS |
| U1 to NA (mm) | 6.2 ± 2.0 | 5.9 ± 2.8 | 6.6 ± 3.0 | 5.7 ± 2.8 | NS | NS | NS | NS | NS | NS |
| U1 exposure (mm) | 2.0 ± 2.0 | 2.1 ± 2.0 | 2.3 ± 1.8 | 2.9 ± 1.9 | NS | NS | NS | NS | NS | NS |
| L1 to NB (°) | 28.2 ± 4.5 | 27.8 ± 7.3 | 34.0 ± 5.0 | 34.4 ± 6.7 | NS | ∗ | ∗ | ∗ | ∗ | NS |
| L1 to NB (mm) | 7.4 ± 2.2 | 7.2 ± 2.6 | 10.0 ± 3.0 | 10.4 ± 3.5 | NS | ∗ | ∗ | ∗ | ∗ | NS |
| IMPA (°) | 96.5 ± 5.6 | 103.6 ± 7.5 | 104.4 ± 5.6 | 96.8 ± 7.6 | ∗ | ∗ | NS | NS | ∗ | ∗ |
| Interincisal angle (°) | 124.2 ± 6.2 | 122.1 ± 10.6 | 114.9 ± 8.1 | 116.7 ± 10.6 | NS | ∗ | ∗ | NS | NS | NS |
| Overjet (mm) | 2.6 ± 0.7 | 7.8 ± 2.8 | 5.9 ± 2.7 | 5.5 ± 1.9 | ∗ | ∗ | ∗ | ∗ | ∗ | NS |
| Overbite (mm) | 2.8 ± 1.2 | 5.9 ± 2.3 | 4.3 ± 1.8 | 3.1 ± 1.9 | ∗ | ∗ | NS | ∗ | ∗ | ∗ |
∗ P <0.05; post-hoc Scheffé test was used to analyze the differences between groups.
For the soft tissue analysis of all subjects, lower lip thickness was significantly increased in group II-L compared with group I ( Table II ). Basic lower lip thickness had a significantly greater value in group II-H than in group II-L. Lower lip length was significantly greater for groups II-N and II-H compared with group II-L. Also, there were statistical differences between groups II-L and II-H in soft tissue contours, hard tissue contours, and contour ratios.
| Soft tissue measurements | Group I | Group II-L | Group II-N | Group II-H | Significance | |||||
|---|---|---|---|---|---|---|---|---|---|---|
| I/II-L | I/II-N | I/II-H | II-L/II-N | II-L/II-H | II-N/II-H | |||||
| Basic upper lip thickness (mm) | 15.3 ± 1.9 | 15.0 ± 2.3 | 14.7 ± 2.4 | 14.3 ± 2.0 | NS | NS | NS | NS | NS | NS |
| Upper lip thickness (mm) | 13.1 ± 1.6 | 13.0 ± 2.3 | 12.7 ± 2.1 | 12.2 ± 2.2 | NS | NS | NS | NS | NS | NS |
| Upper lip strain (mm) | 2.1 ± 1.0 | 2.0 ± 1.6 | 2.0 ± 1.9 | 2.1 ± 1.6 | NS | NS | NS | NS | NS | NS |
| Lower lip thickness (mm) | 15.2 ± 1.3 | 17.1 ± 2.6 | 16.2 ± 2.3 | 16.7 ± 1.9 | ∗ | NS | ∗ | NS | NS | NS |
| Basic lower lip thickness (mm) | 19.0 ± 1.7 | 16.5 ± 1.9 | 18.0 ± 3.0 | 19.0 ± 2.9 | ∗ | NS | NS | NS | ∗ | NS |
| Chin thickness-H (mm) | 13.2 ± 2.4 | 12.8 ± 2.6 | 12.9 ± 2.9 | 12.8 ± 2.8 | NS | NS | NS | NS | NS | NS |
| Chin thickness-V (mm) | 9.0 ± 2.1 | 7.9 ± 1.7 | 8.4 ± 1.9 | 7.7 ± 2.1 | NS | NS | NS | NS | NS | NS |
| Subnasale to H-line (mm) | 12.4 ± 3.1 | 11.8 ± 2.8 | 14.1 ± 3.9 | 14.4 ± 2.9 | NS | NS | NS | NS | NS | NS |
| Lower lip to H-line (mm) | 1.8 ± 2.1 | 0.3 ± 2.0 | 1.9 ± 1.9 | 3.0 ± 2.7 | NS | NS | NS | NS | ∗ | NS |
| Ricketts’ E-line-upper (mm) | −0.3 ± 2.4 | 0.8 ± 2.3 | 1.9 ± 2.2 | 2.4 ± 2.6 | NS | ∗ | ∗ | NS | NS | NS |
| Ricketts’ E-line-lower (mm) | 1.5 ± 2.3 | 0.5 ± 2.3 | 2.6 ± 2.5 | 4.2 ± 3.4 | NS | NS | ∗ | NS | ∗ | NS |
| Upper lip length (mm) | 27.5 ± 3.0 | 25.7 ± 3.1 | 26.1 ± 4.1 | 26.9 ± 3.5 | NS | NS | NS | NS | NS | NS |
| Lower lip length (mm) | 18.6 ± 1.9 | 16.5 ± 2.1 | 18.8 ± 2.6 | 19.1 ± 2.4 | ∗ | NS | NS | ∗ | ∗ | NS |
| Soft tissue contour (mm) | 97.7 ± 7.9 | 88.4 ± 8.0 | 93.8 ± 11.2 | 97.4 ± 9.7 | ∗ | NS | NS | NS | ∗ | NS |
| Hard tissue contour (mm) | 95.4 ± 6.1 | 88.3 ± 7.6 | 95.3 ± 10.3 | 101.9 ± 9.7 | NS | NS | NS | NS | ∗ | ∗ |
| Contour ratio (%) | 102.3 ± 3.7 | 100.4 ± 5.3 | 98.2 ± 6.4 | 96.4 ± 4.5 | NS | ∗ | ∗ | NS | ∗ | NS |
| Nasolabial angle (°) | 96.9 ± 9.4 | 98.6 ± 10.3 | 96.6 ± 9.6 | 101.4 ± 8.6 | NS | NS | NS | NS | NS | NS |
| H-angle (°) | 16.7 ± 3.3 | 21.4 ± 3.4 | 22.5 ± 3.2 | 22.5 ± 3.0 | † | † | † | NS | NS | NS |
Most measurements of soft tissue thickness at both the vertical and sagittal planes were greater in the men than in the women in all experimental groups ( Table III ). The values for basic upper lip thickness and upper lip thickness were significantly greater in men than in women in all groups ( P <0.05).
| Soft tissue measurements | Group II-L | Group II-N | Group II-H | ||||||
|---|---|---|---|---|---|---|---|---|---|
| Male | Female | Significance | Male | Female | Significance | Male | Female | Significance | |
| Basic upper lip thickness (mm) | 16.6 ± 1.3 | 13.6 ± 1.9 | ∗ | 15.8 ± 2.5 | 13.5 ± 1.8 | ∗ | 16.2 ± 1.8 | 13.3 ± 1.4 | ∗ |
| Upper lip thickness (mm) | 14.5 ± 2.0 | 11.3 ± 1.6 | ∗ | 13.4 ± 1.6 | 11.9 ± 2.2 | ∗ | 13.8 ± 2.5 | 11.4 ± 1.5 | ∗ |
| Upper lip strain (mm) | 2.1 ± 1.9 | 2.3 ± 1.2 | NS | 2.4 ± 2.0 | 1.6 ± 1.7 | NS | 2.4 ± 1.8 | 1.9 ± 1.4 | NS |
| Lower lip thickness (mm) | 19.0 ± 1.3 | 15.2 ± 2.0 | ∗ | 17.0 ± 1.9 | 15.4 ± 2.4 | ∗ | 17.6 ± 2.6 | 16.2 ± 1.4 | NS |
| Basic lower lip thickness (mm) | 16.7 ± 1.8 | 16.3 ± 2.0 | NS | 19.4 ± 3.0 | 16.4 ± 2.1 | ∗ | 20.0 ± 2.5 | 18.5 ± 3.0 | NS |
| Chin thickness-H (mm) | 14.7 ± 2.2 | 11.0 ± 1.2 | ∗ | 13.1 ± 3.0 | 12.6 ± 2.7 | NS | 12.9 ± 2.4 | 12.8 ± 3.1 | NS |
| Chin thickness-V (mm) | 9.4 ± 2.1 | 6.9 ± 1.3 | ∗ | 8.6 ± 1.9 | 8.1 ± 1.8 | NS | 8.8 ± 2.0 | 7.1 ± 2.0 | ∗ |
| Subnasale to H-line (mm) | 11.3 ± 2.8 | 12.3 ± 3.0 | NS | 15.8 ± 4.3 | 12.4 ± 2.7 | ∗ | 14.7 ± 3.5 | 14.2 ± 2.6 | NS |
| Lower lip to H-line (mm) | −0.8 ± 1.8 | 1.4 ± 1.7 | ∗ | 2.0 ± 2.1 | 1.9 ± 1.9 | NS | 3.0 ± 2.6 | 3.0 ± 2.8 | NS |
| Ricketts’ E line-upper (mm) | 0.1 ± 1.7 | 1.4 ± 2.7 | NS | 2.7 ± 2.3 | 1.0 ± 1.9 | ∗ | 2.5 ± 2.5 | 2.3 ± 2.8 | NS |
| Ricketts’ E line-lower (mm) | −0.6 ± 1.8 | 1.5 ± 2.4 | ∗ | 3.1 ± 2.5 | 2.1 ± 2.4 | NS | 4.5 ± 3.5 | 4.0 ± 3.5 | NS |
| Upper lip length (mm) | 26.6 ± 3.1 | 24.5 ± 2.6 | NS | 28.1 ± 4.2 | 23.9 ± 2.9 | ∗ | 27.2 ± 4.2 | 26.7 ± 3.3 | NS |
| Lower lip length (mm) | 16.6 ± 2.4 | 16.0 ± 1.9 | NS | 20.0 ± 2.6 | 17.4 ± 1.7 | ∗ | 20.4 ± 2.0 | 18.5 ± 2.4 | ∗ |
| Soft tissue contour (mm) | 90.2 ± 8.1 | 84.1 ± 8.7 | NS | 99.8 ± 11.6 | 87.4 ± 6.2 | ∗ | 101.6 ± 8.7 | 95.3 ± 9.7 | NS |
| Hard tissue contour (mm) | 89.3 ± 6.6 | 85.0 ± 9.8 | NS | 100.7 ± 9.7 | 89.7 ± 7.7 | ∗ | 106.4 ± 9.4 | 99.6 ± 9.3 | NS |
| Contour ratio (%) | 101.3 ± 5.1 | 99.0 ± 5.9 | NS | 99.1 ± 7.3 | 98.2 ± 5.3 | NS | 96.2 ± 5.1 | 96.3 ± 4.4 | NS |
| Nasolabial angle (°) | 99.6 ± 8.3 | 95.4 ± 13.2 | NS | 96.7 ± 9.7 | 96.5 ± 9.8 | NS | 101.1 ± 8.1 | 101.5 ± 9.1 | NS |
| H-angle (°) | 21.6 ± 3.1 | 21.1 ± 3.9 | NS | 23.9 ± 2.9 | 21.1 ± 3.0 | ∗ | 21.8 ± 3.3 | 22.8 ± 2.9 | NS |
Stay updated, free dental videos. Join our Telegram channel
VIDEdental - Online dental courses


