Introduction
Proximal enamel thickness (PET) at the mesial and distal contact areas of the complete permanent dentition has not been previously reported. Anatomic investigation of PET is essential for interproximal reduction treatment. Our objectives were to measure the PETs of the complete maxillary and mandibular dentitions at the contact areas, to compare the PETs of adjacent teeth, and to evaluate the vertical position of each contact area.
Methods
We evaluated 720 extracted teeth; of these, 109 intact teeth were selected. The mesial and distal contact areas were demarcated, and each tooth was embedded in transparent epoxy resin. Blocks were prepared so that the 2 demarcated contact areas were exposed, and 6 measurements were taken and statistically analyzed.
Results
Both jaws showed the same PET pattern characterized by 5 features: PET increased progressively from incisor (0.63 mm) to first molar (1.48 mm). Per tooth, mesial and distal PET did not differ. Total maxillary (26.86 mm) and mandibular (24.52 mm) PETs were similar. Paired PETs at the interproximal interface were similar, with the exception of the lateral incisor-canine interfaces. From incisor to first molar, the contact area becomes located farther gingivally.
Conclusions
The existing guideline of maximal 0.5-mm interproximal reduction per 2 adjacent teeth should be kept in the anterior region and could be increased to 1 mm in the posterior region, when an equal amount is removed.
Highlights
- •
Proximal enamel thickness (PET) at the contact areas was measured histologically.
- •
PET increased progressively from incisor to molar.
- •
Mesial and distal PET measurements did not differ per tooth.
- •
From incisor to molar, the contact area becomes located farther gingivally.
- •
Interproximal reduction per 2 adjacent teeth could be increased in the posterior region to 1 mm.
Dental crowding is a common characteristic of malocclusion, defined as a discrepancy between tooth size and arch length. Although crowding may occur in the anterior or posterior region of each arch, adults are most likely to have crowding in the mandibular anterior region. Late anterior crowding is considered to be a normal physiologic phenomenon in which a developmental reduction in arch length causes increased crowding.
As oral esthetic demands become more exacting, resolving dental crowding has become a common complaint, especially among adult patients. Furthermore, this condition makes it difficult to maintain oral hygiene and gingival health. Also, it may compromise the esthetics and functionality of prosthetic rehabilitation.
In orthodontics, the patient-driven trend demanding faster treatment, with minor interventions, has marginalized extraction-based therapy to use in only severe malocclusions. The technique of removing tooth material by reducing the thickness of interproximal enamel has come into use when the amount of space required to resolve an orthodontic problem is not extreme. This is commonly referred to as “interproximal reduction.” The principle of interproximal reduction is to partially reduce the enamel layer and consequently the mesiodistal tooth size without affecting the dentin. This technique was first described by Ballard in 1944 and was primarily dedicated to the treatment of mild or moderate crowding. It is based on the natural phenomenon of physiologic interproximal wear and allows the fitting of the dental units to the arches. The major advantage of interproximal reduction is that a precise amount of space is created to unravel the crowding, as opposed to tooth extraction, which often results in more space than required to resolve the dental crowding.
Incomplete enamel removal raises 2 major questions: what is the minimal enamel layer necessary after interproximal reduction to protect the dentin layer, and how much enamel thickness is available in different dental units? Regarding the former, in a long-term study, 10 years after interproximal reduction to the mandibular incisors, the treated teeth demonstrated no increases in sensitivity or in the distance between the roots. However, there are no reports comparing the sensitivity of varying thicknesses of residual layers of enamel after interproximal reduction. There are, however, 4 indirect indicators that suggest that even a thin layer of enamel can provide adequate protection of the underlying tissues: (1) the enamel thickness adjacent to the cementoenamel junction of the labial crown surface of the maxillary anterior teeth is normally about 13 μm ; (2) occlusal attrition is frequently associated with exposure of the dentin layer with no evidence of sensitivity; (3) dentinal reaction to enamel reduction is characterized by occluded dentinal tubules; and (4) additional dentinal reaction is in the form of buildup of secondary dentin.
Interproximal reduction was developed further by Sheridan. Several studies have reported on proximal enamel thickness (PET) on posterior and anterior dentitions. Macha et al and Fernandes et al suggested a strong right-left symmetry for the same contralateral teeth, but their analyses were based only on the maxillary first and second premolars. Right-left symmetry from incisors to premolars was also found by Vellini-Ferreira et al. Stroud et al suggested, based on bitewing measurements, that PET increases toward the distal aspect in the mandibular posterior dentition except for the second premolar, with no sex dimorphism.
Currently, orthodontic interproximal reduction is limited to 0.5 mm per interproximal region, about 0.25 mm from each of the 2 teeth. The technique is based on removing enamel from the proximal wall starting at the contact area. The principle of orthodontic interproximal reduction for the intact dentition should follow 3 guidelines: leaving a thin layer of enamel, removing more enamel from teeth with greater PET, and performing selective reduction at the 2 contact areas between paired adjacent teeth. “Selective reduction” refers to greater reduction at the contact area with greater PET. However, these guidelines cannot be implemented precisely because of lack of data.
To make up for these deficiencies, the objectives of this study were to map the PET of the complete maxillary and mandibular dentitions at the contact areas, to compare the PET of 2 adjacent contact areas (ie, the distal contact area of the anterior tooth and the mesial contact area of the adjacent posterior tooth), and to evaluate each contact area in relation to the vertical dimension of the crown. Four null hypotheses were postulated in this study: (1) the PETs are similar per arch between teeth and between sides (mesial vs distal), (2) maxillary and mandibular PETs share a similar pattern, (3) adjacent contact areas of paired teeth have the same amount of PET, and (4) the contact area is located in all teeth at the same distance from the cementoenamel junction or the occlusal plane.
Material and methods
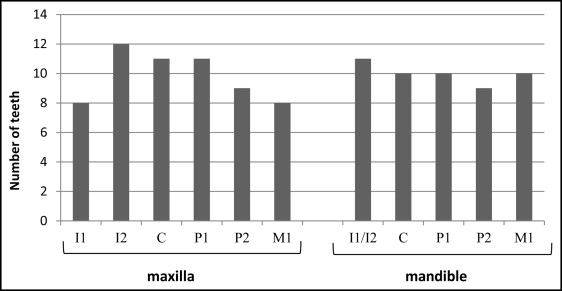
We obtained 720 extracted permanent teeth from the Department of Maxillofacial Surgery at Tel Aviv University in Israel. Upon examination using a Toolmakers microscope (Mitutoyo, Tokyo, Japan), we excluded 611 because of peripheral preparations, proximal restorations, or extensive proximal loss (ie, interproximal wear facet spread buccolingually to the edges of the proximal wall), or impaired proximal walls during extraction (proximal wall scratched or damaged). Therefore, 109 (59 maxillary, 50 mandibular) intact teeth were included in the study ( Fig 1 ); 48 (44%) of these teeth were derived from male subjects and 61 (56%) from female subjects. All were of white ethnicity. The mean age of the subjects was 34.3 ± 10.3 years, with a range from 12 to 59 years.
The teeth, which were stored in 8% formaldehyde (Bio Lab, Jerusalem, Israel), were rinsed in water (3 hours) and dehydrated in ascending ethanol concentrations (40%, 70%, 95%, and 100%) every 2 hours, and then placed in Xylen (Bio Lab) for an additional 2 hours. Each tooth was then classified according to type, jaw, and side, and the mesial and distal contact areas were demarcated with red and blue markers, respectively. The identification of the contact area was based on differential brightness of the enamel during wear. That is, the proximal facet in the contact area may appear as a polished surface or a bright plain area, according to the method described by Sarig et al.
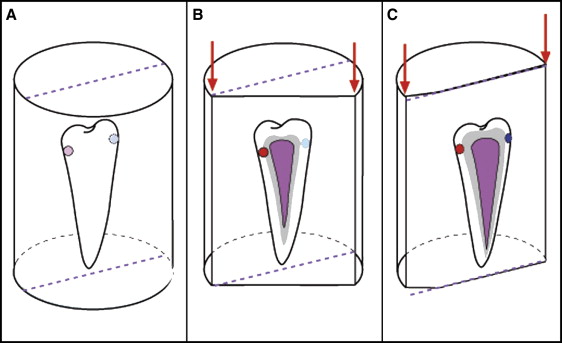
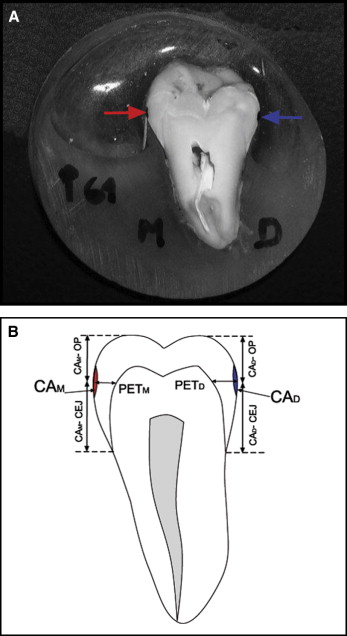
Each tooth was positioned vertically in a 20-mL vial with the long axis parallel to the long axis of the vial using molding paste at the bottom of the vial. Subsequently, each tooth was embedded in transparent epoxy resin (Polysciences, Warrington, Pa). After curing, the block was sectioned. Since the purpose was to measure the enamel on a plane where the 2 contact areas were present, the sectioning was carried out in 2 steps ( Fig 2 ). First, using an apparatus for microstructural analysis (Isomet low speed saw; Buehler, Lake Bluff, Ill), each tooth was bisected parallel to but 2 mm away from the contact area plane, producing 2 unequal portions ( Fig 2 , A and B ). Second, the portion including the 2 demarcated contact areas was then trimmed (Single Wheel Orthodontic Model Trimmers; Wehmer, Lombard, Ill) up to the point where both the mesial and distal contact areas were part of the exposed surface ( Fig 2 , C ). The exposed surface was then polished (Ecomet, variable speed grinder-polisher; Buehler) using P320 and P120 waterproof abrasive paper (WS flex 18-G; Hermes Schliefmittel, Hamburg, Germany). Six measurements were made on each tooth with the Toolmakers microscope with a closed camera and a monitor (Koyo Electronics Industries, Tokyo Japan) at 10-times magnification. The measurements included the following ( Fig 3 ).
- 1.
Mesial proximal enamel thickness (PET M ), the distance from the midmesial contact area to the dentinoenamel junction (measured on a line parallel to the long axis of the tooth passing through the contact area).
- 2.
Distal proximal enamel thickness (PET D ), the distance from the middistal contact area to the dentinoenamel junction (measured on a line parallel to the long axis of the tooth passing through the contact area).
- 3.
Mesial contact area to occlusal plane (CA M -OP), the distance from the midmesial contact area to the occlusal highest point on the mesial side (measured on a line parallel to the long axis of the tooth passing through the contact area).
- 4.
Mesial contact area to the cementoenamel junction (CA M -CEJ), the distance from the midmesial contact area to the mesial cementoenamel junction (measured on a line parallel to the long axis of the tooth passing through the contact area).
- 5.
Distal contact area to occlusal plane (CA D -OP), the distance from the middistal contact area to the occlusal highest point on the distal side (measured on a line parallel to the long axis of the tooth passing through the contact area).
- 6.
Distal contact area to cementoenamel junction (CA D -CEJ), the distance from the middistal contact area to the distal cementoenamel junction (measured on a line parallel to the long axis of the tooth passing through the contact area).
Statistical analysis
The intraclass correlation coefficient was calculated to determine the intratester and intertester reliabilities of the measurements (repeated measurements of 10 teeth). Intratester reliability was assessed by 1 investigator (C.S.), and intertester reliability involved 2 testers (C.S., R.S.). The testers were unaware of each other’s results. The intraclass correlation coefficient values for the intratester and intertester tests were 0.93 and 0.91, respectively. Statistical analysis was carried out with SPSS software (version 18.0; SPSS, Chicago, Ill). Data analysis was carried out using t test analysis and 1-way analysis of variance with post hoc analysis (Tukey B). The level of significance was set at P <0.05. No significant difference was found between the sexes regarding PET (the lowest nonsignificant P value was in the maxillary canine, P = 0.329, on the distal side); therefore, the teeth of both sexes were used in all statistical analyses.
Results
Categorizing the contact area of the maxillary dentition according to PET greater than or less than 1 mm, we found that the central and lateral incisors demonstrated PETs of less than 1 mm on both the mesial and distal contact areas, and that the canine, the first and second premolars, and the first molar had PET greater than 1 mm on both the mesial and distal contact areas. The mesial PETs for the canine and the first premolar were significantly less than those of the second premolar ( P <0.01). PET of the second premolar did not statistically differ from that of the first molar. Additionally, the second premolar had the greatest PET (1.41 ± 0.27 mm) at the mesial contact area ( Table ). As for the distal side, PETs of the lateral incisor and the canine differed significantly from those of the first and second premolars and the first molar ( P <0.01) ( Table ).
| Tooth | PET M (mm) | PET D (mm) | PET M vs PET D ( P value) | Comparison of tooth types | |
|---|---|---|---|---|---|
| PET M (Tukey B) | PET D (Tukey B) | ||||
| Maxilla | |||||
| I 1 | 0.81 ± 0.06 | 0.81 ± 0.27 | 0.998 | I 1 , I 2 , ≠ M 1, P 1 , C, P 1 ≠ P 2 P ≤0.01 |
I 1 , I 2 , C ≠ P 1 , P 2 , M 1 P ≤0.01 |
| I 2 | 0.76 ± 0.14 | 0.86 ± 0.28 | 0.206 | ||
| C | 1.10 ± 0.21 | 1.11 ± 0.26 | 0.747 | ||
| P 1 | 1.13 ± 0.15 | 1.25 ± 0.37 | 0.593 | ||
| P 2 | 1.41 ± 0.27 | 1.36 ± 0.30 | 0.652 | ||
| M 1 | 1.35 ± 0.29 | 1.48 ± 0.17 | 0.137 | ||
| Mandible | |||||
| I 1 and I 2 | 0.64 ± 0.19 | 0.60 ± 0.18 | 0.581 | I 1 , I 2 ≠ C ≠ P 1 , P 2 P 1 ≠ M 1 P ≤0.01 |
I 1 , I 2 ≠ C, P 1 , P 2 , M 1 P ≤0.01 |
| C | 0.97 ± 0.21 | 1.30 ± 0.61 | 0.133 | ||
| P 1 | 1.16 ± 0.13 | 1.05 ± 0.24 | 0.227 | ||
| P 2 | 1.23 ± 0.10 | 1.30 ± 0.20 | 0.305 | ||
| M 1 | 1.37 ± 0.12 | 1.40 ± 0.20 | 0.720 | ||
Stay updated, free dental videos. Join our Telegram channel
VIDEdental - Online dental courses


