Introduction
The purpose of this study was to morphometrically investigate the growth pattern of the adenoids in growing subjects with hyperdivergent and hypodivergent vertical craniofacial features.
Methods
In this retrospective study, we used a longitudinal sample of lateral cephalometric radiographs of 28 hyperdivergent and 30 hypodivergent subjects from 4 to 13 years of age. The radiographs were obtained from the American Association of Orthodontists Foundation Craniofacial Growth Legacy Collection. Measurements were made using digital tracings of the lateral cephalograms and point distribution models. Mixed-model analyses were used for statistical analysis.
Results
The mean distance between the sphenoid bone and the posterior nasal spine increased up to 5.3 mm over a 9-year span (95% CI, 4.1-6.5 mm; P <0.001). Furthermore, the mean distance between the sphenoid bone and the posterior nasal spine differed significantly ( P = 0.029) between facial types; it was consistently greater (1.8 mm; 95% CI, 0.2-3.3 mm) in the hyperdivergent group. The nasopharyngeal airway area showed a trend to increase with age up to 12-fold ( P <0.001). A significant interaction ( P = 0.004) was found between age and facial type. Assessment of the adenoid shapes showed greater convexities in the hyperdivergent group, which were observable from an earlier age and for a longer duration.
Conclusions
Clear differences in the morphometric growth pattern of the adenoids were found between facial types. Evaluation of adenoid shapes showed more prominent convexities that lasted longer in the long facial types than in the short facial types.
Highlights
- •
We examined the growth pattern of the adenoids in different facial types.
- •
We morphometrically assessed adenoid growth patterns in a longitudinal sample.
- •
Clear differences were observed between long and short facial types.
Hypertrophic adenoids have been shown to be a significant risk factor for pediatric sleep breathing disorders, such as obstructive sleep apnea (OSA). Several studies have shown that restriction of the upper airways caused by enlarged adenoids, and hence mouth breathing, may also be directly linked to specific craniofacial morphologies such as the long face syndrome. A study conducted on monkeys, where varying degrees of nasal respiratory obstruction were simulated, further supported these findings. Although variations exist, the typical characteristics of this long facial morphology include increased anterior facial height, incompetent lips, steep mandibular plane angle, anterior open bite, and retrognathic mandible. The term “long face syndrome” encompasses a variety of facial types with specific clinical and cephalometric features including the so-called adenoid face that has been associated with mouth breathing and OSA. Although various theories have been postulated on how nasopharyngeal restriction alters craniofacial morphology, this is still a matter of debate. It is unclear whether alterations in the facial skeleton predispose a person to OSA, or whether these alterations are caused by OSA.
Results from investigations into the growth pattern of the adenoid tissues have also been somewhat controversial. Several findings from the early to mid-20th century, including Scammon’s curves of systematic growth, have demonstrated that lymphatic tissues undergo rapid growth from infancy until a peak about 10 to 13 years of age. Subsequent regression in maturity follows. On the contrary, research in this field in later years generally proposed a different pattern of growth where adenoids were seen to hypertrophy as early as 2 years of age but generally peaked during the preschool and early school years, or around 4 to 6 years of age. Adenoidal regression until adulthood was then noted. A few studies observed a slight and temporary enlargement in the adenoids about 11 years of age and suggested that it was due to the influence of sex hormones at puberty. In this research, however, adenoid changes were investigated using either only cephalometric methods or a subjective assessment of adenoid hypertrophy, with limited information regarding the actual changes of adenoid shapes over time.
The purpose of this study was to morphometrically investigate the growth pattern of the adenoids in growing subjects with long and short faces to obtain new insight into the association between adenoid growth and craniofacial morphology. We hypothesized that the growth pattern of the adenoid tissues would follow those described in the literature. That is, peak adenoid size would be reached at approximately 4 to 6 years of age followed by regression until approximately 10 to 11 years of age. A brief period of adenoid enlargement would be expected about 11 years of age with subsequent regression to the size seen in maturity. Furthermore, morphometric analysis was expected to show prominent convexities on the anteroinferior surface of the adenoids during peak growth at 4 to 6 years of age, followed by flattening of this surface corresponding to reduction in the size of the adenoids. Increased adenoid growth and more prominent convexities were hypothesized in the hyperdivergent group compared with the hypodivergent group.
Material and methods
A convenience sample of lateral cephalometric radiographs was obtained from the American Association of Orthodontists Foundation (AAOF) Craniofacial Growth Legacy Collection Web site. At the time of sample selection, 696 participants with approximately 8700 corresponding lateral cephalograms were available online for analysis.
The sella-nasion–mandibular-plane angle (SN-MP) was measured for each subject at 13 years of age to define the vertical craniofacial pattern. It has been shown that the mean value of the SN-MP angle is 32° with a standard deviation of 5°. For the purpose of this research, subjects with an SN-MP angle greater than 39.5° and less than 24.5° (1.5 SD above and below the mean) were selected as the hyperdivergent and hypodivergent groups, respectively. Both groups were then checked for the following inclusion criteria: (1) radiographs available for download from the AAOF Web site with at least 8 lateral cephalograms between the ages of 4 and 13 years, (2) radiographs of adequate quality (at least 300 dpi), and (3) nasopharynx, adenoids, and soft palate clearly visible. The exclusion criterion was poor radiographic quality, making identification of the nasopharynx, adenoids, or soft palate difficult.
The required sample size was estimated by using previous data showing the variability of the nasopharyngeal area in a cohort of healthy participants. In this study, we aimed to detect a medium-to-large effect size (Cohen’s d ≥ 0.2) using a repeated-measurements study design. The correlation among repeated measurements was estimated at 0.3. To detect this effect size, and setting α error to 0.05 and β error to 0.20, we estimated that about 34 participants per group were needed.
From a pool of 453 lateral cephalograms, 58 participants (30 hypodivergent, 28 hyperdivergent) fulfilled the selection criteria and were included in this study. Table I shows the number of radiographs that were available from 4 to 13 years of age, based on facial type.
| Age (y) | Available radiographs (n) | Missing or excluded radiographs (n) | Available radiographs (n) | Missing or excluded radiographs (n) |
|---|---|---|---|---|
| 4 | 9.0 | 19.0 | 13.0 | 17 |
| 5 | 19.0 | 9.0 | 19.0 | 11 |
| 6 | 25.0 | 3.0 | 25.0 | 5 |
| 7 | 28.0 | 0.0 | 26.0 | 4 |
| 8 | 27.0 | 1.0 | 28.0 | 2 |
| 9 | 22.0 | 6.0 | 20.0 | 10 |
| 10 | 24.0 | 4.0 | 25.0 | 5 |
| 11 | 25.0 | 3.0 | 26.0 | 4 |
| 12 | 22.0 | 6.0 | 24.0 | 6 |
| 13 | 25.0 | 3.0 | 21.0 | 9 |
| Total | 226.0 | 54.0 | 227.0 | 73 |
All lateral cephalograms available from ages 4 to 13 were retrieved from the online collection for each participant. The age at which these radiographs were taken was rounded to the nearest full year of chronologic age. If multiple lateral cephalograms had been taken in 1 year, only the radiograph taken nearest to each full year was measured. All downloaded images were scaled according to the recommendations of the AAOF.
One investigator (J.E.P.) performed all digital tracings using a custom-made script in MatLab (The MathWorks, Inc, Natick, Mass) (R21012b), which allowed the conversion of digital landmarks to Cartesian coordinates so that morphometric shape analysis could be conducted. On each radiograph, landmarks were identified and constructed in the same order to describe the shapes of the structures of interest. A total of 29 points or landmarks were used for each image ( Fig 1 ).
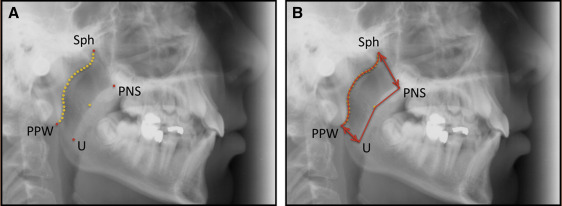
To evaluate the accuracy and reproducibility of the methods, 25 radiographs chosen at random were digitally retraced. The reliability was determined with Dahlberg’s formula using the x- and y-coordinates of several representative landmark points, which included 2 fiducials, the most superior point of the adenoid tissue where it meets the sphenoid bone (Sph), the most inferior point of the adenoid where it meets the posterior pharyngeal wall at or just below the level of the anterior tubercle of the first cervical vertebrae (PPW), the posterior nasal spine (PNS), and the tip of the uvula (U). The resulting errors for the x-coordinates were 0.1, 0.1, 2.0, 1.1, 2.2, and 1.9 mm, respectively. The errors for the y coordinates were 0.1, 0.1, 1.8, 2.4, 1.7, and 1.6, respectively.
The distances for Sph-PNS and PPW-U for every radiograph were calculated by application of the Pythagorean theorem. Nasopharyngeal area measurements were also obtained. A mixed-model analysis was used to investigate the relationships between the 2 distance measurements (Sph-PNS and PPW-U) and the nasopharyngeal airway area with age, sex, and facial type.
Morphometric analysis for the shape of the adenoids was conducted as in our previous research. Digitized data points were clustered according to age group and vertical facial type. In each cluster, the shape was defined by “n” points (semilandmarks) in 2-dimensional space. Using Procrustes analysis, which finds the minimum of the least-squared error of all shapes in the same cluster subject to scale, rotation, and translation, we constructed a point distribution model. After this step, a template was made for adenoid shape, by finding the mean semilandmark point after aligning the shapes in each cluster. Morphometric analysis was carried out separately for the hypodivergent and hyperdivergent groups across different ages.
Results
The mean values for the linear measurement of Sph-PNS for the whole sample varied significantly with age (F = 57.5; P <0.001), showing a trend to increase over time ( Table II ). There was also a significant difference in the mean values of Sph-PNS between the hyperdivergent and hypodivergent groups (F = 5.0; P = 0.029). There was no significant sex effect (F = 2.2; P = 0.146) and no significant interaction between age and facial type.
| Age (y) | Sph-PNS (mm) | PPW-U (mm) | Area (cm 2 ) | |||||||||
|---|---|---|---|---|---|---|---|---|---|---|---|---|
| Hyperdivergent | Hypodivergent | Hyperdivergent | Hypodivergent | Hyperdivergent | Hypodivergent | |||||||
| Mean | SD | Mean | SD | Mean | SD | Mean | SD | Mean | SD | Mean | SD | |
| 4 | 21.0 | 3.0 | 19.2 | 1.9 | 13.4 | 3.7 | 13.5 | 2.9 | 4.7 | 2.0 | 4.5 | 1.9 |
| 5 | 21.8 | 2.8 | 20.2 | 2.5 | 13.0 | 2.6 | 13.7 | 2.1 | 5.0 | 1.9 | 4.7 | 2.5 |
| 6 | 22.3 | 3.2 | 20.8 | 2.9 | 13.0 | 2.5 | 13.8 | 2.3 | 4.8 | 2.2 | 4.8 | 2.5 |
| 7 | 23.3 | 3.5 | 21.3 | 3.0 | 13.1 | 3.2 | 13.7 | 3.2 | 5.4 | 2.5 | 5.2 | 2.9 |
| 8 | 24.1 | 3.5 | 22.4 | 3.0 | 12.9 | 2.4 | 15.1 | 2.7 | 5.8 | 2.6 | 5.8 | 3.0 |
| 9 | 24.4 | 3.4 | 23.6 | 3.1 | 12.9 | 2.6 | 14.1 | 1.8 | 5.5 | 2.4 | 6.2 | 2.7 |
| 10 | 25.2 | 3.7 | 23.2 | 3.6 | 13.6 | 3.6 | 15.4 | 2.6 | 5.2 | 1.8 | 6.7 | 3.3 |
| 11 | 24.7 | 3.3 | 23.4 | 3.3 | 13.4 | 2.5 | 15.0 | 2.3 | 6.2 | 2.6 | 6.4 | 3.0 |
| 12 | 25.6 | 3.8 | 24.4 | 4.0 | 14.6 | 2.4 | 15.2 | 3.1 | 6.8 | 3.0 | 7.6 | 3.8 |
| 13 | 26.7 | 3.3 | 24.7 | 3.4 | 14.9 | 3.6 | 15.3 | 1.5 | 6.9 | 2.9 | 8.5 | 3.7 |
The mean values for the linear measurement of PPW-U for the whole sample showed significant changes with age (F = 5.4; P < 0.001), with a trend to increase over time ( Table II ). However, there were no significant effect by facial type (F = 2.6; P = 0.110) or sex (F = 0.6; P = 0.449) and no significant interaction between age and facial type.
The mean nasopharyngeal area measurements for the hyperdivergent and hypodivergent groups varied significantly with age (F = 51.3; P <0.000), showing a trend to increase over time ( Table II ). No statistically significant sex effects were observed (F = 1.2; P = 0.268). Facial type did not have significant effects on area measurements (F = 0.2; P = 0.636). However, there was a significant interaction (F = 2.7; P = 0.004) between age and facial type. In other words, the effect of age on the nasopharyngeal airway area differed between facial types. The hyperdivergent types started with greater airway areas than the hypodivergent types. However, this relationship reversed over time.
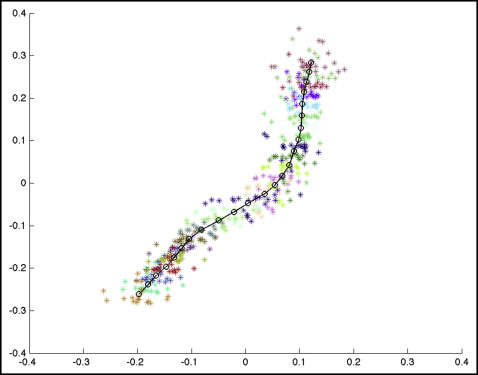
Morphometric assessment of the adenoids was undertaken using point distribution models. Figure 2 shows an example of the point distribution model with individual landmarks in the hypodivergent group at 9 years of age. Different colors were used for each landmark, and subjects can be seen as points of the same color in each cluster. The mean adenoid shape is represented by the black circles joined by lines.