, Hai-Yang Yu2, Jing Zheng1, Lin-Mao Qian1 and Yu Yan3
(1)
Tribology Research Institute, Southwest Jiaotong University, Chengdu, People’s Republic of China
(2)
West China College of Stomatology, Sichuan University, Chengdu, People’s Republic of China
(3)
Institute of Advanced Materials and Technology, University of Science and Technology, Beijing, People’s Republic of China
Abstract
Due to its excellent mechanical and tribological behavior, enamel is one of those unique natural substances that still cannot be substituted effectively for with artificial restorative materials. As shown in Fig. 5.1, enamel uniquely consists of aligned “prism-shaped” rods (4–8 μm in diameter), which run approximately perpendicular from the dentin-enamel junction (DEJ) toward the tooth surface [1].
5.1 Introduction
Due to its excellent mechanical and tribological behavior, enamel is one of those unique natural substances that still cannot be substituted effectively with artificial restorative materials. As shown in Fig. 5.1, enamel uniquely consists of aligned “prism-shaped” rods (4–8 μm in diameter), which run approximately perpendicular from the dentin-enamel junction (DEJ) toward the tooth surface [1].
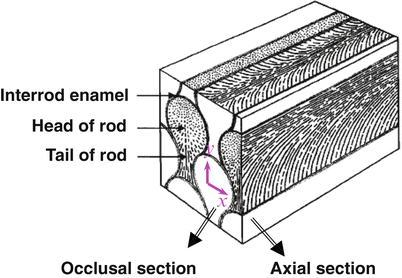

Fig. 5.1
Schematic diagram of human enamel
On the microstructure level, the enamel is constructed via enamel rods (abbreviated as “R”) and interrod enamel (abbreviated here as “IR”). As shown in Fig. 5.2, each rod consists of tightly packed fiber-like hexagonal carbonated HA crystals. These HA crystallites are roughly rectangular in cross section, with a mean width of 68.3 nm and a mean thickness of 26.3 nm, and are “glued” together by a thin protein layer less than 2 nm thick [2, 3]. The interfacial area between rods is called the interrod enamel, which is rich in protein and is mostly a result of the incoherence of combining crystals of different orientations. The interrod enamel has a width of about 1 μm. The HA crystallites in enamel rod are arranged parallel to each other and oriented along the rod’s axis [3, 4]. However, the HA crystallites in the interrod enamel are arranged with a certain inclination to the adjacent enamel rod’s axis. Since the organic matrix and water are mainly contained in interrod enamel, the elastic modulus and hardness in the interrod enamel are lower than those in the area of the rods. The unique microstructure endows the enamel with inhomogeneous and anisotropic mechanical properties [1–4]. The mechanical properties, chemistry, and microstructure of the enamel have been reported to be a function of the location in a whole tooth [2].
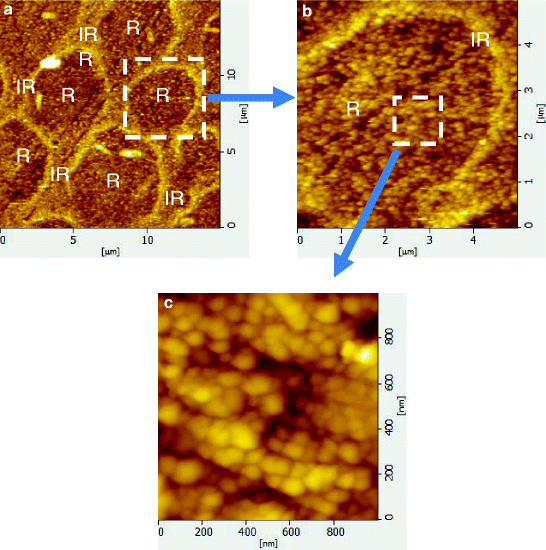

Fig. 5.2
AFM image of the occlusal section of human tooth: (a) 15 × 15 μm; (b) single enamel rod, 5 × 5 μm; (c) HA particles, 1 × 1 μm (R enamel rod, IR interrod enamel)
Human tooth enamel is composed of hierarchical structures with important features down to the nanometer or micrometer scale. Hence, a technique that can probe the mechanical and tribological properties at these scales has the potential to address questions that are relevant to the microscopic mechanism of tooth wear. As a powerful tool for measuring the nanoscale and microscale mechanical properties of materials, nanoindentation has been widely used to investigate the mechanical properties of human teeth [2–9]. Habelitz et al. [4] reported that the average elastic modulus and hardness measured in the direction parallel to the axes of enamel rods were higher than those measured in the direction perpendicular to the axes of enamel rods. The differences were assigned to the unique alignment of fiber-like apatite crystals and the composite nature of enamel rods [4]. Ge et al. [5] showed that both the hardness and the modulus of interrod enamel were lower than those of enamel rod.
Since the nanoscratch technique has a typical working force range of 1 μN to 500 mN and a displacement range of 1 nm to 300 μm, it provides a powerful tool for the microtribological characterization of tissues and other biomaterials with a submicron resolution [10–13]. The results can help us to study the role of various structural and chemical components in providing mechanical strengths. Very recently, the nanoscratch technique has been used to study the tribological properties of human teeth [14–17]. Guidoni et al. [14] presented that the tooth enamel was brittle at a low load (50 μN) but ductile at a high load (100 μN) by scratching with a sharp indenter tip (tip radius R = 20–50 nm). Asperity deformation and fatigue wear dominated the damage during scratching by a rounded conical tip (~1,200 nm radius), but ploughing and wedge formation were the main damage mechanism by using a sharp indenter tip (20–50 nm) [15]. The recovery effects and abrasion resistance were more evident under wet conditions than under dry conditions [16]. Despite all that, the anisotropy of the wear behavior of tooth enamel was not very clear and its microtribological behavior was still far from understood.
In this chapter, nanoindentation and nanoscratch tests were performed on the human tooth enamel to explore the contribution of the enamel microstructure to its mechanical and tribological behavior. The nanoindentation hardness and elastic modulus of enamel were characterized at various locations of a rod on the occlusal section of human tooth. The microtribological behavior of the tooth enamel on the longitudinal section was investigated by nanoscratch. The anisotropic tribological performance of the human tooth enamel was discussed. During the scratching process, the variation in the size of enamel HA particles was detected. Finally, the recovery of the scratched tooth sample in remineralization was verified by immersing it in artificial saliva.
5.2 Nanohardness and Elastic Modulus at Different Locations of a Rod of Human Teeth
Human tooth enamel specimens were prepared from freshly extracted human mandibular third permanent molars (M3) without caries, which were from individuals of either gender who were between 18 and 25 years of age. The teeth were stored in distilled water at 4 °C before use.
Five teeth were used in this study. Each tooth was cut into two halves using a diamond saw along the direction perpendicular to the buccolingual division line. As shown in Fig. 5.3, each half of the tooth was embedded into a steel-made mold with self-setting plastic (10 × 10 × 20 mm in size). One half of each tooth was ground and polished on the occlusal surface. The process was careful to remove only 0.2–0.3 mm of each specimen in order to obtain a surface similar to the original occlusal surface of enamel in the mouth. As a result, five specimens of the occlusal section were prepared. Specimens were first ground using abrasive papers of 360, 500, 800, 1,200, and 1,500 grit in turn, and then polished with diamond paste from 10, 5, 2.5, to 1 μm in turn. Cutting, grinding, and polishing were conducted under water-cooling conditions to avoid local overheat that can result in dehydration and changes in both the microstructure and chemistry of human teeth. After polishing, specimens were stored in distilled water at 4 °C. The average roughness R a of the specimens was controlled at 0.10 μm using a high-resolution surface profilometer (TALYSURF6, Taylor Hobson Limited, Leicester, UK). All specimens were cleaned with alcohol before testing.
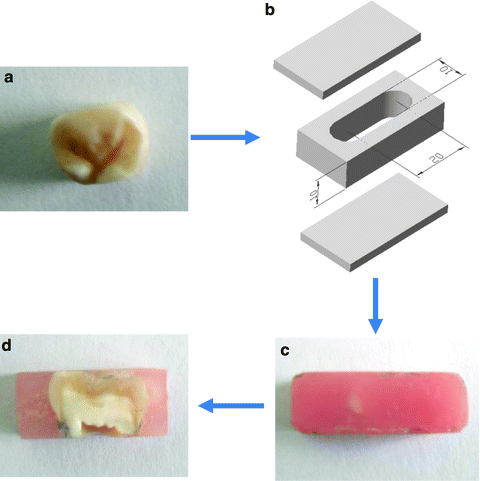

Fig. 5.3
Preparation of the tooth sample: (a) a typical human molar; (b) the mould to prepare sample; (c) the tooth sample taken out from the mould; (d) the tooth sample after polishing
Four specimens, which were randomly selected from five specimens of the occlusal section, were used to measure the nanoindentation hardness and elastic modulus of the enamel. In order to orient the indentations, the surface of each specimen was etched for 1 min in an aqueous 0.001 M citric acid solution before nanoindentation. It was found that such slight etching did not significantly change the surface profile, composition, and mechanical properties of the enamel [17]. By using a nanoindenter (CSM Instruments, Peseux, Switzerland), 200 indentations under a peak load of 2 mN were made on each specimen surface. The space between the indentations was 3 μm. At each test, the loading speed was adjusted to keep 30 s of loading time, 2 s of delay at peak load, and 30 s of unloading time. The whole process of indentations was completed at 25 °C and at a relative humidity of 60 %.
Because surface roughness could influence the measurement accuracy of the nanoindentation to some extent, an extremely low load should not be applied during the nanoindentation process. In addition, the moderate space between indentations must be taken into account in order to avoid their interaction. Hence, the number of indentations within a single enamel rod was limited, as shown in Fig. 5.4 [1]. Considering that the nanoindentation test zone was really small on the surface of each specimen in this study, it was hypothesized that both the shape and mechanical properties of enamel rods were similar to each other within the test zone. Based on the above hypothesis, a coordinate system was set up for each rod so that every indentation was oriented by its coordinate position. As a result, all the indentations can be superimposed in the same coordinate system, as shown in Fig. 5.5.
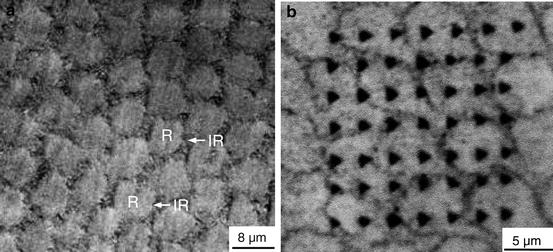
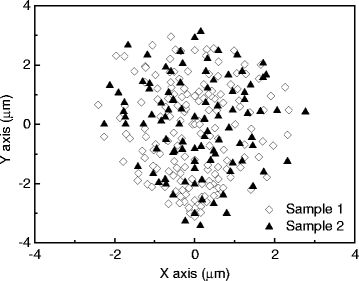

Fig. 5.4
Microstructure observations of (a) the polished enamel surfaces and (b) nanoindentations on the occlusal section

Fig. 5.5
Nanoindentation distribution in the occlusal cross section of a single enamel rod obtained from indentation superposition
Figure 5.6 shows the distribution map of both the hardness and elastic modulus in a single enamel rod. It was observed that both the hardness and elastic modulus varied with the location within an enamel rod. Both the hardness and elastic modulus are highest in the central area and decrease slowly with the increase in distance from the central point.
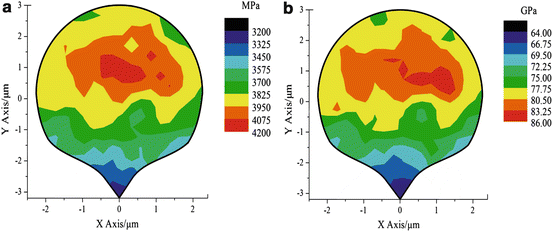

Fig. 5.6
Nanomechanical-property maps of an enamel rod over its occlusal cross section: (a) hardness and (b) elastic modulus
Figure 5.7 shows the distribution of the nanoindentation hardness and elastic modulus along the y-axis of the enamel rod over its occlusal cross section. As shown in Fig. 5.7a, the largest hardness, which is 4,100 MPa, is located in the head area, and the lowest hardness, 3,250 MPa, is measured in the tail area. The elastic modulus shows a similar trend to the hardness. The largest elastic modulus in the head area is about 85 GPa, and the lowest elastic modulus in the tail area is about 70 GPa.
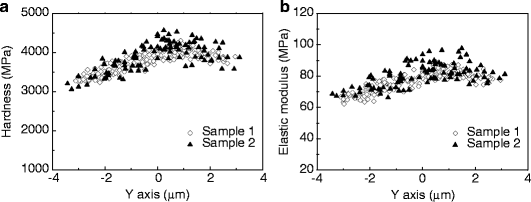

Fig. 5.7
Distribution of the nanoindentation hardness and elastic modulus along the enamel rod’s y-axis over its occlusal cross section: (a) hardness and (b) Young’s modulus
Figure 5.8 shows the distribution of the nanoindentation hardness and elastic modulus along the x-axis of the enamel rod over its occlusal cross section. The hardness and elastic modulus in the center were a little higher than those measured at the edge of an enamel rod.
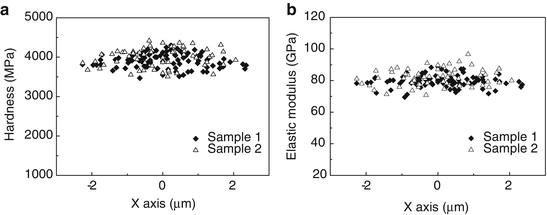

Fig. 5.8
Distribution of the nanoindentation hardness and elastic modulus along the enamel rod’s x-axis over its occlusal cross section: (a) hardness and (b) Young’s modulus
Table 5.1 gives the average values of the mechanical properties obtained from these indentations. Here, the head area refers to the area between y = 0~2 μm and the tail area refers to the area between y = −3 ~ −1 μm. The hardness and elastic modulus tended to be lower in the tail area of both the rods and the interrod enamel in comparison with those in the head area of the rods. Such results were consistent with those of Habelitz et al. [4].
Table 5.1
Distribution of the nanoindentation hardness and elastic modulus in an enamel rod
|
Tooth sample
|
||||||
|---|---|---|---|---|---|---|
|
Position
|
1
|
2
|
3
|
4
|
Average
|
|
|
Hardness
|
Head area
|
4.16 ± 0.22
|
4.25 ± 0.38
|
3.99 ± 0.26
|
4.20 ± 0.31
|
4.17 ± 0.29
|
|
(GPa)
|
Tail area
|
3.57 ± 0.17
|
3.58 ± 0.30
|
3.73 ± 0.19
|
3.64 ± 0.33
|
3.69 ± 0.29
|
|
Elastic modulus
|
Head area
|
83.3 ± 5.3
|
91.8 ± 6.9
|
89.0 ± 4.7
|
86.0 ± 6.1
|
85.9 ± 6.2
|
|
(GPa)
|
Tail area
|
74.1 ± 5.0
|
84.1 ± 6.3
|
84.6 ± 2.6
|
79.9 ± 6.4
|
79.7 ± 6.7
|
To understand the possible reasons for the heterogeneous mechanical properties of a single enamel rod, the EDX detection was conducted on the various positions of an enamel rod. As shown in Fig. 5.9, the contents of the C, O, P, and Ca elements are almost the same on the head, tail, and edge locations of the enamel rod. The quantitative analysis of the Ca and P elements is shown in Fig. 5.10. No obvious difference was identified from the content of Ca and P on various positions of the enamel rod. Therefore, the heterogeneous mechanical behavior on the various positions of an enamel rod cannot be attributed to the composition of the enamel rod.
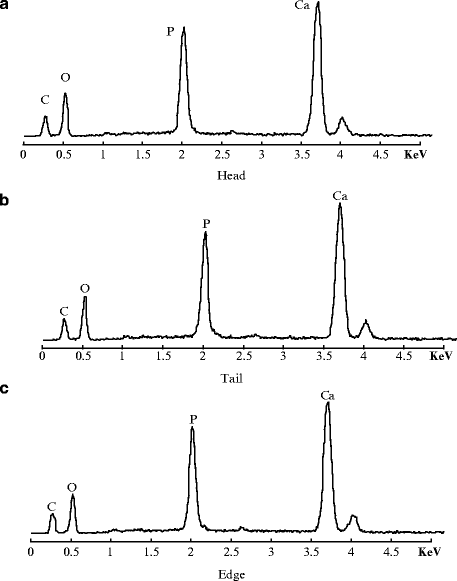
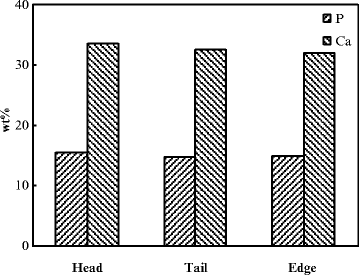

Fig. 5.9
Detection of EDX spectra on the various positions of enamel rod

Fig. 5.10
Detection of Ca/P ratio on the various positions of the enamel rod
Stay updated, free dental videos. Join our Telegram channel

VIDEdental - Online dental courses


