Figure 10.1 • SEM images (back-scattered electron detector) of endodontic treated teeth.
A – Low magnification image of the half-tooth showing the end portion of the root canal.
B – Dental pulp, predentin and dentin (from right to left) in zone where materials were not removed
by the mechanical treatment and not attacked by the chemical one. The oxidation only changed the pulp (on the top-right) appearance.
C – Pulpal canal showing the debris after mechanical and chemical treatment. Note how debris covers a large part of the canal surface.
D – Pulpal canal showing the debris after 140-mJ-pulse power Er:YAG laser treatment. Note the high canal surface cleanliness.
Field width: A = 2100 µm; B = 230 µm; C = D = 917 µm.
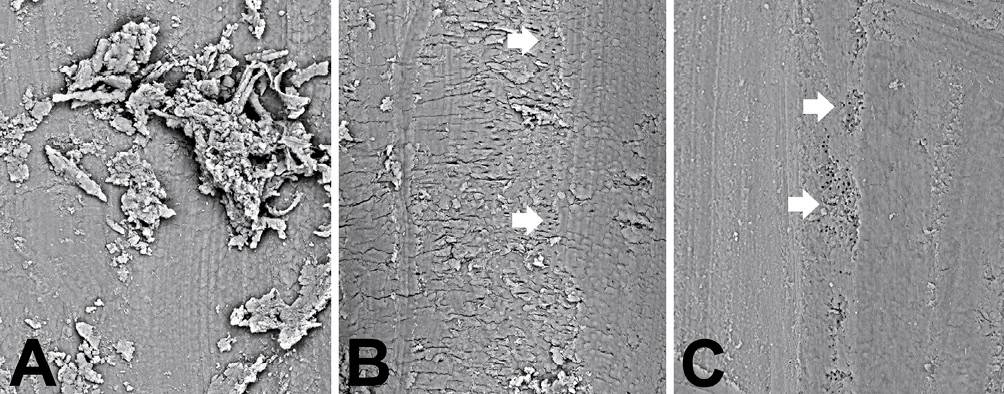
Figure 10.2 • SEM images (back-scattered electron detector) of root canals.
A – High magnification image showing the debris after mechanical and chemical treatment.
B – Canal surface after 60-mJ-pulse power Er:YAG laser treatment. The arrows point to small zones where the open tubule orifices are visible.
C – Canal surface after 100-mJ-pulse power Er:YAG laser treatment.
Note the high canal surface cleanliness. The arrows point to zones where the open tubule orifices are visible.
Field width: A = B = C = 230 µm.
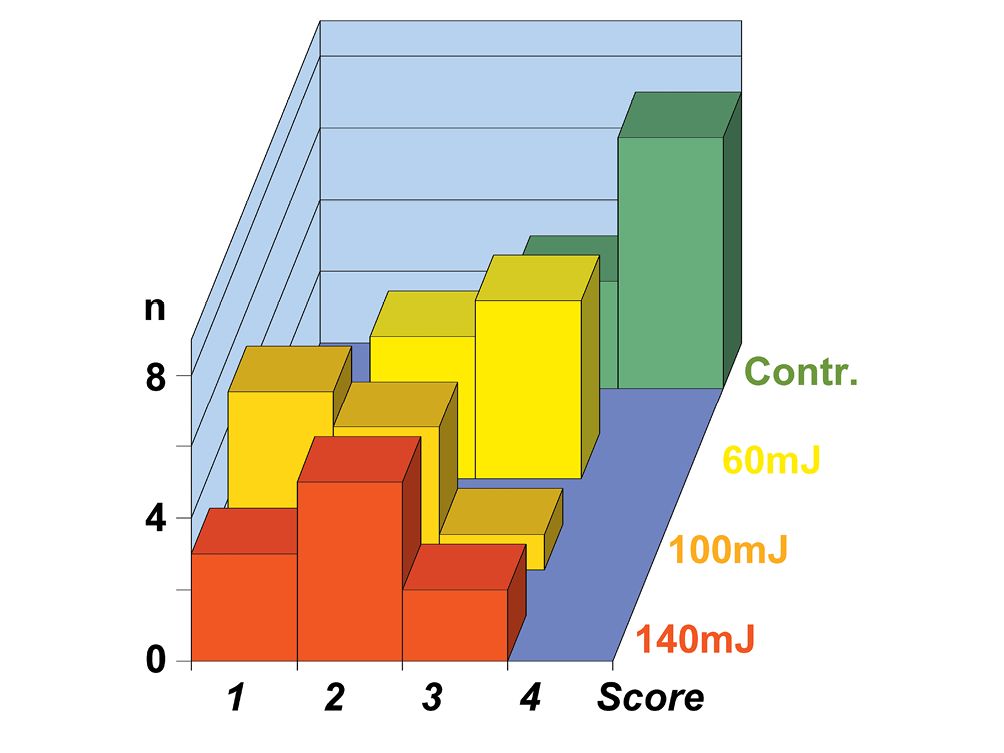
Figure 10.3 • Graph showing the cleanliness behavior after mechano-chemical treatment (Contr.) and after Er:YAG laser treatment, at the pulse power of 60 mJ, 100 mJ e 140 mJ of 10 premolar teeth groups. Note how higher is the power, better the cleanliness (lower scores).
Score 1 = 0,5 ÷ 2% debris; Score 2 = 2 ÷ 5% debris; Score 3 = 5 ÷ 20% debris; Score 4 = 20 ÷ 50% debris.
Also at low power, the Er:YAG laser use in endodontic treatments allows to achieve the root canal disinfection thanks to its bactericidal effect. Thus the Er:YAG laser has capability to produce multiple effects: sizing, cleaning and disinfection of the root canal. Nevertheless, the laser gives off a coherent light beam that go apically out from the probe with direction parallel to the longitudinal axis of the probe. The light has then a crown-apical direction when the probe is introduced inside the mechanically treated root canal. The dental operator inserts the probe until the root canal end and he extracts the probe after activating the control board. To realize the better root canal surface irradiation, the operator maintains more possible sloped the probe during the extraction. It goes without saying that the cleaning depends on several factors: laser beam power, time of treatment, achievable slope. How SEM shows, higher the power better the results. Several authors highlighted the total disappearance of the smear-layer that covers the dentinal tubules, but using very high powers: 400-500 mJ up to 750 mJ. As aforesaid, the laser beam is mainly directed towards the tooth apex, so it is to notice that the high power light can easy overstep the apex acting on the surrounding tissues, so it finds difficult thinking to an in vivo salutary effect. After experimental confirmation, better results can probably be obtained using a different device. The probe would allow to apically emitting a laser beam having an orthogonal direction of propagation with respect the main probe axis. This beam, orthogonally emitted and, perhaps, also rotating, would effectively act onto the root canal surface allowing not only to achieve a surface almost without debris but also the almost tubule orifice opening, without very high (400-700 mJ) power use.
A confirmation of the aforesaid suggestion could be obtained after a careful analysis of the behavior of the dentinal smear layer to the chemical or laser treatment. These studies are normally conducted on “ex-in vivo” teeth, yet in pulpal canals that need sectioned to be examined. The latter can be a further variable that sometimes almost invalidate the observation of the results. The creation of artificial root canals, which mime the half-canals obtained by cutting, may be preferred to obviate such problem and mainly to full verify the capability of the chemical treatment (Fig. 10.4A). The rotary instrument produces both the smear layer and debris on the artificial root surface during the formation of these half-canals on thick teeth sections. Due to the different treatment processes, the debris amount results lower respect to that of the normal root canal treatment (Fig.10.4C). These specimens, consisting in 1 millimeter-thick sections of premolar teeth previously alcohol fixed and methacrylate engulfed (not embedded), perfectly grinded and alumina polished, each having two mechanically produced half-canals (Fig. 10.4A), have been chemically treated (after rehydration by water) or with the laser (Fig. 10.4B). Sections have been treated with the chemical irrigant more frequently used in the literature. The dentinal surface has been treated for 5 minutes with 5% Sodium Hypochlorite (NaClO), 15% Ethylene Diamine Tetra Acetic Acid (EDTA), 10% Citric Acid or 10% Phosphoric Acid (H3PO4). An Er:YAG laser at a pulsed power of 100 mJ has been used to produce spots (Fig. 10.4B), about 1 millimeter apart, to successfully analyze both the effect on the dentin of canal and of the horizontal surface.
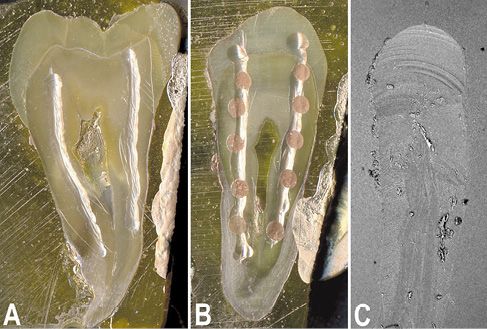
Figure 10.4 • Stereomicroscope (A, B) and SEM (back-scattered electron detector) images of 1 millimeter-thick sections of premolar teeth engulfed in PMMA, polished with emery paper and alumina finished. A – Image of a section prepared for the SEM analysis, gold sputtered, and showing the 2 artificial pulpal canals (half-canals) produced using a rotary device. B – Image of a section whose canals were Er:YAG laser treated before preparation for the SEM analysis.
C – SEM image of the initial portion of a mechanically prepared pulpal canal. Note how few debris covers the surface due to the section washing. Field width: A = 11 mm; B = 9.3 mm; C = 1000 µm.
The mechanical treatment and the cleaning with aqueous solutions to adequately prepare sections for a right SEM analysis surely reduced the debris amount detectable inside the root canals artificially produced (Fig. 10.5A and 10.5B). This do not happens in vivo where the cleansing with liquids is surely has a lower effectiveness, due to both the smallness of access and the gravity that may produce debris accumulation. The dentin surface may show some scattered open tubule. It generally appears highly irregularly shaped due to the indentations produced by the rotary device, in particular onto the lateral surface of the canal (Fig. 10.5C). The bottom of the canal results more uniform due to the homogeneous smear layer spreading of the dentinal surface (Fig. 10.5D).
The treatment with only NaClO performed by several authors in literature, results almost ineffective. Both at low (Fig. 10.5E and 10.5F) and high magnification (Fig. 10.5G and 10.5H) and comparing the treatment results with those of controls (Fig. 10.5A-D) it results that the oxidizing agent NaClO was not able to produce modification of dentinal surfaces. The lateral wall grooves appear more evident, perhaps their more cleaning (Fig. 10.5G), but the smear layer appear more evident in the bottom of the canal, correctly earning the appellation of dentinal smear, where some small debris particles (sized about 5-10 µm) additionally result (Fig. 10.5H).
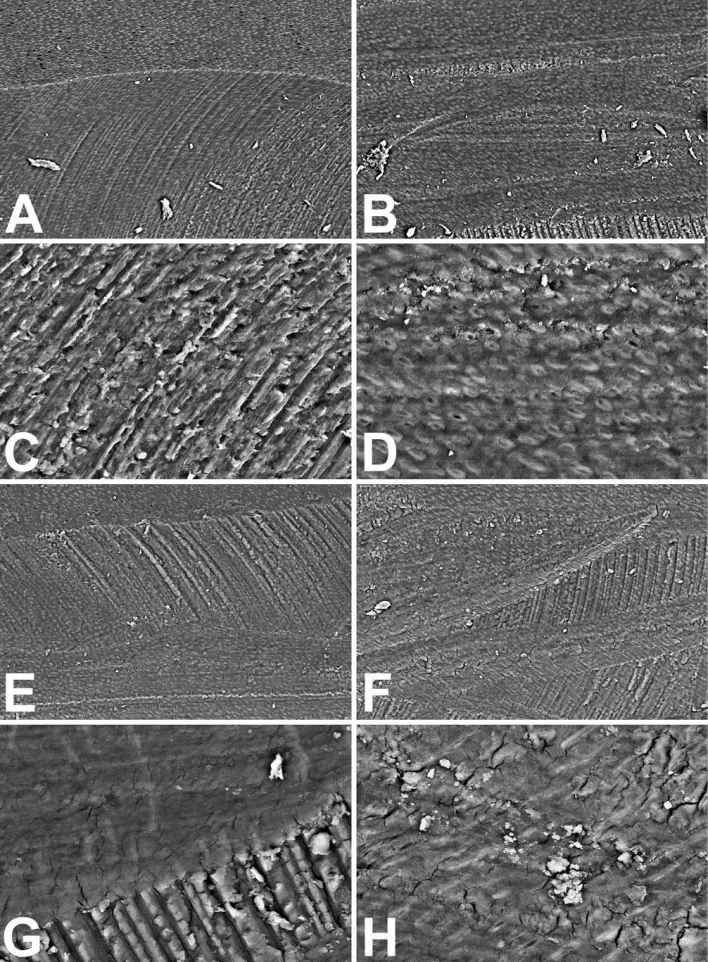
Figure 10.5 • SEM images (back-scattered electron detector) of the edge (A, C, E, G and H) and the bottom (B, D and F) of artificial pulpal canals treated with water (A-D) or with 5% (NaClO) Sodium Hypochlorite (E-F) for 5 minutes. Note in controls (A-D) the clear rotary device marks and the debris on the smear layer that cover the dentinal surface, at low (A-B) and high (C-D) magnification. The Hypochlorite treatment (E-H) does not introduce improvement of the dentinal surface appearance. The smear layer results untouched and the debris on the surface too.
Field width: A = B = E = F = 500 µm; C = D = G = H = 125 µm.
The treatment with only EDTA seems to decidedly modify the aspect of dentinal surfaces (Fig. 10.6A and 10.6B). The canal surfaces result much more detailed than those treated with only NaClO at low magnification. Grooves produced by the rotary device result yet clear; indicating that fraction up to few microns is the thickness of the superficial removing of the calcified material. Nevertheless, a blurry aspect of the dentinal surface results at higher magnification (Fig. 10.6E). Images seem to be produced by an inexpert SEM operator. Blurred picture of the surface are always obtained even using the autofocus function. This appearance is due to the EDTA action: the chemical agent removes the mineral component but only a very low portion of the organic component of dentin. The most part of the amorphous matrix and almost the totality of fibrillar one remain untouched after EDTA use. It’s exactly the presence of this organic component on the dentinal surface that forming a semitransparent thin layer confers a blurry aspect to images. The analyses of the aspect of the dentinal surface, treated before with EDTA, washed by water and then with NaClO, at low magnification (Fig. 10.6C and 10.6D), which looks strictly to that of only EDTA treatment, but principally at higher magnification of the dentinal surface (Fig. 10.6F-H), may confirm the aforesaid suggestion. SEM images of the dentinal surface, after oxidation of the organic component demineralized by EDTA, appear sharp and now they show open tubule orifices, having an oval shape when the sectioning plane was not perfectly orthogonal to their longitudinal axis (Fig. 10.6F). The mean tubular lumen results about 2.2 µm (twice than that obtaining by fracture), most likely due to the erosion of the hypomineralized dentinal sheath and to a partial erosion of the peritubular dentin (Fig. 10.6G). The oxidizing effect of NaClO, even though effective in the removal of the organic component demineralized by EDTA, resulted rather moderate since it partially eliminated the cytoplasmic processes of odontoblasts fixed by the ethanol (Fig. 10.6G and 10.6H). This later appearance must do to reflect upon the use of only NaClO in the cleansing of the root canal. The NaClO is not only disgusting and bore hard by patients, it may affect the surrounding tissues when comes out the root apex because contains NaOH, but also it is not capable of completely oxidizing the smear layer, so it is almost unable to attack the smear. The NaClO has probably only a chemical-physical cleaning effect, operation that probably might have better performed by a biological detergent.
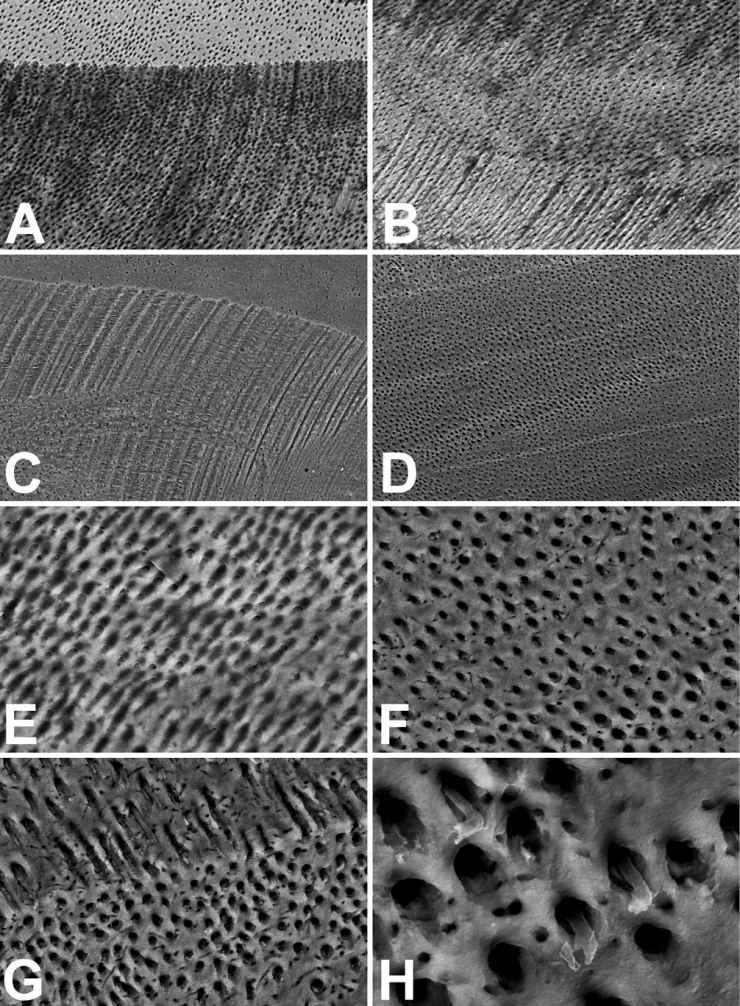
Figure 10.6 • SEM images (back-scattered electron detector) of the edge (A, C, G and H) and the bottom (B, D, E and F) of artificial pulpal canals treated with 15% (EDTA) Ethylene Diamine Tetra Acetic Acid for 5 minutes (A, B and E) or before EDTA and then NaClO (C, D, F, G and H). Note how the images related to the only EDTA treatment (A, B as E) result as out of focus. The presence of material covering the dentinal surface and the tubules orifices is visible in E. The NaClO oxidation cleans the dentinal surface and the tubules orifices both in the bottom (D and F) and in the lateral wall of the canal (C, G e H), and in the horizontal surface of the section. The oxidation, effective against the fibrillar and amorphous component of the EDTA decalcified dentin, partly saved the protoplasms of some cytoplasmic odontoblast processes (G e H), surrounded by a wide room. Field width: A = B = C = D = 500 µm; E = F = G = 125 µm; H = 31 µm.
The treatment with Citric Acid (Fig. 10.7) results to more aggressive if compared with that of EDTA. The great erosion (Fig. 10.7A) does not almost allow appreciating the edge delimitating the horizontal surface of the section (top) from the lateral surface of the artificial canal (below), at low magnification yet. The high erosion level of Citric Acid is better appraisable at higher SEM magnification. The holes of the bottom surfaces of the artificial canal (Fig. 10.7D) do not correspond to the open tubule orifices but to the small channels that orthogonally radiate from tubules. These small channels, which normally have lumen about 100 nm wide, are here about 1 µm wide. The approximate value of the tubule diameter could be calculated in images of almost tangentially sectioned tubules (Fig. 10.7C), like those near the edge of the lateral wall of the canal. The dentinal tubules had a size of about 5-6 µm due to the erosion of the peritubular dentin and also perhaps the intertubular one. The decalcification with Citric Acid may produce tubule merging in zone with high tubular density where tubules may be 5-10 µm apart. The Citric Acid treatment can produce breakable tubular walls, mechanically hazardous for the following treatment of the root canal with the plastic filler due to very low reliability of the interface dentin-sealant.
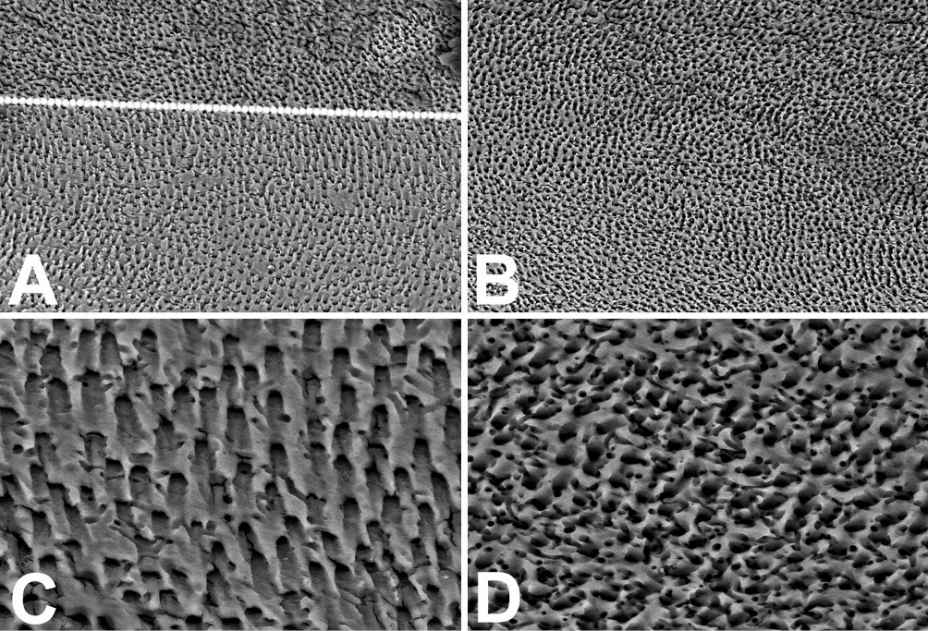
Figure 10.7 • SEM images (back-scattered electron detector) of the edge (A and C) and the bottom (B and D) of artificial pulpal canals treated with 10% Citric Acid, followed by NaClO, for 5 minutes each. The overlap dotted line in A has been exactly positioned on the canal edge, otherwise not detectable due to the absence of difference in the morphology of the horizontal surface of the section ant the sloped surface of the canal. The holes visible in C and D are not those of tubules (which appeared obliquely cut in C) but those of small channels that orthogonally radiate from tubules. Field width: A = B = 500 µm; C = D = 125 µm.
The effect previously seen with the EDTA treatment, and happening also with the Citric Acid, is better visible (Fig. 10.8 A, 10.8 B, 10.8 E) when the dentin undergoes the H3PO4 treatment without the following oxidation with NaClO. The morphology of the artificial canal produced in the dentin of the tooth section is clearly cognizable at low SEM magnification (Fig. 10.8A) but blurred images are achievable. The presence of a semitransparent thin layer (the dentin organic matrix decalcified by the acid) that covers the dentinal surface and the tubule orifices is clearly visible at high magnification (Fig. 10.8E). A completely different morphology of the surface results after H3PO4 and NaClO treatment. The surface appears evenly granulated with the same morphology both of the horizontal surface and the canal at low SEM magnification (Fig. 10.8C and 10.8D), without differences between bottom and walls (Fig. 10.8C-D).
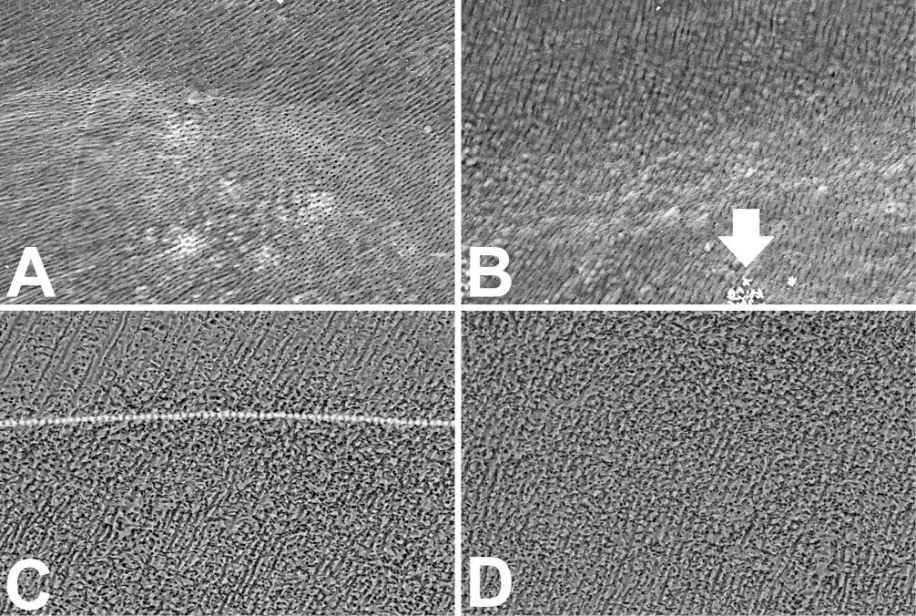
Figure 10.8 • The approximative size of tubules may be calculated in the G image where the tubules are tangentially cut. The arrow of B points to some crystals on the surface of the bottom of the canal. Note in H how the back-scattered electrons result darker the dentin close to the cavity treated with H3PO4 (on the right in H) and lighter the beneath dentin (on the left in H). The X rays microanalysis highlights a similar qualitative composition of two (dark and pale) dentins. Nevertheless, the mineral quantitatively differs both for the Phosphate amount (normal dentin: Ca = 23 Wt%, P = 11 Wt%; hypomineralized dentin: Ca = 15 Wt%, P = 8.5 Wt%), and for the Ca/P rate (normal dentin: Ca/P = 2.1; hypomineralized dentin: Ca/P = 1,76 – Wt/Wt). Field width: A = B = C = D = 500 µm; E = F = G = 125 µm; H = 315 µm.
Stay updated, free dental videos. Join our Telegram channel
VIDEdental - Online dental courses


