Introduction
This study was a cephalometric evaluation of the growth changes in untreated subjects with minimal overbite at 4 time points during 4 developmental stages from the early mixed dentition to the permanent dentition, as well as from the prepubertal phase to young adulthood.
Methods
A sample of 24 untreated subjects with minimal overbite (<1.5 mm) was selected retrospectively from the University of Michigan Growth Study and the Denver Child Growth Study. The sample was followed longitudinally from about 9 years of age through 17 years of age. Dentofacial changes at the 4 times (T1-T4), defined by the cervical vertebral maturation method, were analyzed on lateral cephalograms. Nonparametric statistical analysis was used for comparisons.
Results
Overbite on average increased by 2.3 mm during the overall observation period. Improvement occurred during the prepubertal interval (T1-T2; 2.4 mm), whereas no significant changes occurred in the pubertal and postpubertal stages. From prepubertal ages to young adulthood, the open-bite tendency improved in 91% of the subjects, with self-correction in 75%. Logistic regression analysis on the cephalometric variables at T1 with the value of overbite at T4 did not show a statistically significant correlation.
Conclusions
Subjects with an open-bite tendency show improvement of their occlusal condition during the prepubertal stage, but there is no significant improvement after this. These results provide useful indications for appropriate orthodontic treatment timing for patients with an open-bite tendency.
Open bite is an occlusal trait characterized by a lack of vertical overlap of the incisors. A reduced depth of the bite can be associated with skeletal hyperdivergence, otherwise referred to as long-face syndrome or high-angle disharmony. The incidence of anterior open bite varies according to age and ethnic group. In the United States, the reported incidence in children is 3.5%, with the prevalence decreasing during adolescence. Anterior open bite is more common in Africans and Afro-Caribbeans (5%-10%). Prolonged sucking habits and facial hyperdivergent characteristics have been shown to be significant risk factors for anterior open bite in the mixed dentition. Patients with open bite mainly seek treatment on esthetic grounds, but there can be functional problems such as difficulty incising food and speech problems such as lisping associated with this malocclusion.
There is no generally accepted method to identify a patient with an open-bite tendency. Various cephalometric characteristics have been ascribed to patients with an anterior open bite or an open-bite tendency, including a large mandibular plane angle, increased total and lower anterior face height, decreased posterior face height, increased gonial angle, short ramus, low posterior-to-anterior face height ratio, and large anterior dentoalveolar heights in both jaws.
Klocke et al, among others, stated that “there is general agreement that patients with anterior open bite or an open bite tendency are among the most challenging to treat.” Relapse is a common finding after open-bite correction with both orthodontic treatment and surgical orthodontic therapy. Despite the difficulty that this type of malocclusion poses for clinicians, few studies have analyzed changes in the depth of the bite in subjects with an open-bite tendency during growth. Studies have described the development of normal overbite and its variations during the mixed and permanent dentitions, sometimes by analysis of small subsamples with reduced overbite.
Bergersen investigated the changes in overbite from 8 to 20 years of age in subjects with increased overbite (>3 mm) and normal or decreased overbite (≤3 mm). The general trend in this study for the normal or decreased overbite group was about an even chance of an overbite less than 3 mm remaining the same or getting worse by 12 years of age. Bergersen wrote that if a child starts with an overbite less than 3 mm at 8 years of age, there is about 50% chance that it will be greater than 3 mm at 12 years of age and an equal chance that it will remain less than 3 mm at 12 years of age. Overbite changes were suggested to be due to exfoliation and eruption of teeth because open bite was found to increase during the exchange of incisors and deciduous molars at 8 to 11 years and to decrease during the eruption of the second and third molars between 13 and 20 years of age. Unfortunately, Bergersen’s study did not include any open-bite subjects (overbite <1 mm), and it also was semilongitudinal, because annual consecutive observations were not available for all subjects from the ages of 8 through 20 years.
A longitudinal cephalometric study of subjects with anterior open bite in the deciduous dentition was performed by Klocke et al. They reported that although only 1 subject had an open bite at 12 years of age, overbite remained reduced during the longitudinal follow-up. These findings were consistent with those reported by Worms et al, who showed that 80% of early open bites in a cross-sectional sample self-corrected. Although self-correction of open bite has been reported, there is a paucity of longitudinal research in this area. None of the studies mentioned above included an assessment of individual skeletal maturity, although this aspect is crucial to longitudinal studies of growing subjects.
The aim of this study was to provide a cephalometric evaluation of the growth changes in untreated subjects with minimal overbite at 4 time points during the developmental ages from the early mixed dentition to the permanent dentition, and from prepubertal phases to young adulthood. The main features of this investigation were a specific focus on growth changes of untreated subjects with minimal overbite at the initial observation (<1.5 mm), its longitudinal nature with the same subjects evaluated at all time points, and the use of a biologic indicator of skeletal maturity.
Material and methods
The files of the University of Michigan Growth Study (n = 706) and the Denver Child Growth Study (n = 155) were searched for longitudinal records of untreated subjects with an open-bite tendency. High-quality lateral cephalograms at 4 consecutive developmental intervals (T1 through T4) corresponding to the different stages in cervical vertebral maturation (CS 1-CS 6) had to be available for all selected subjects. The stages of cervical vertebral maturation are illustrated diagrammatically in the Figure 1 .
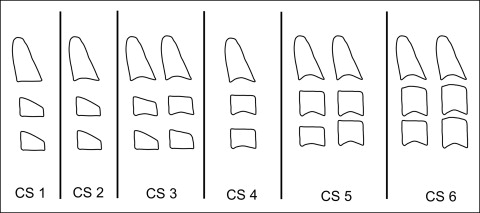
The first observation (T1) corresponded to CS 1 or CS 2 (prepubertal); the second observation (T2) corresponded to CS 2 or C3 (beginning of puberty); the third observation (T3) corresponded to either CS 4 or CS 5 (postpubertal); and the fourth observation (T4) corresponded to the appearance of CS 6 (young adulthood). Longitudinal records for all subjects therefore covered the entire circumpubertal period from the prepubertal through the young adult stages of skeletal development. All subjects were of European-American ancestry (white), with no craniofacial abnormalities or tooth anomalies (supernumeraries, congenitally missing teeth, impacted canines).
Subjects were included according to the presence of an overbite less than or equal to 1.5 mm and a Frankfort horizontal to mandibular plane angle greater than 23°. Both maxillary central incisors and all 4 mandibular incisors had to be erupted fully at T1. Permanent incisors were judged to be fully erupted when most of the anatomic crown was exposed, as assessed radiographically and on dental casts, with the incisal edges of the mandibular incisors at the same level. The sample consisted of 24 subjects (14 boys, 10 girls). Mean age at T1 was 8 years 9 months ± 11 months, with all subjects in the early mixed dentition; at T2, their chronologic age was 11 years 8 months ± 13 months, with subjects in the late mixed or early permanent dentitions; at T3, their age was 14 years 2 months ± 16 months, with all subjects in the permanent dentition; and at T4, it was 16 years 8 months ± 28 months, with all subjects showing permanent dentition. Class I occlusion was present in 10 subjects, Class II Division 1 malocclusion in 12 subjects, and Class III malocclusion in 2 subjects. No data were available on subjects from either growth study on digital habits.
Cephalograms were traced by an investigator (A.C.P.) and then verified for landmark location, anatomic contours, and tracing superimpositions by a second investigator (J.A.M.). Any disagreements were resolved by retracing the landmark or structure to the satisfaction of both observers. A customized digitization regimen and analysis from Dentofacial Planner (Dentofacial Software, Toronto, Ontario, Canada) was used for all cephalograms examined in this study. The customized cephalometric analysis containing measurements from the analyses of Steiner, Jacobson, Ricketts, and McNamara was used, generating 29 variables: 9 angular, 19 linear, and 1 ratio for each tracing.
Four serial cephalograms for each subject were traced at the same time. Fiducial markers were placed in the maxilla and the mandible on the first tracing and then transferred to the second, third, and fourth tracings in each subject’s cephalometric series, based on superimpositions of internal maxillary or mandibular structures. The maxillae were superimposed along the palatal plane by registering on the bony internal details of the maxilla superior to the incisors and the superior and inferior surfaces of the hard palate. Fiducial markers were placed in the anterior and posterior parts of the maxilla along the palatal plane. This superimposition describes the movement of the maxillary dentition.
The mandibles were superimposed on the outline of the mandibular canal, the anterior contour of the chin, and the bony structures of the symphysis. A fiducial marker was placed in the center of the symphysis and another in the body of the mandible near the gonial angle. This superimposition describes the movement of the mandibular dentition relative to the mandible.
The magnification of the 2 data sets was different, with the lateral cephalograms from the University of Michigan study having a magnification of 12.9% and those from the Denver study at 4%. Therefore, the lateral cephalograms from the 2 studies were corrected to an 8% enlargement factor.
The power of the study when assessing cumulative treatment changes (T1-T4) was calculated on the basis of an effect size equal to 1 (SigmaStat 3.5; Systat Software, Point Richmond, Calif). The power of our study with a sample size of 24 subjects was 0.93 at an alpha = 0.05.
A total of 42 lateral cephalograms randomly chosen from all observations were retraced and redigitized to calculate the method error with Dahlberg’s formula. The errors for linear measurements ranged from 0.2 mm (overjet) to 0.8 mm (Pg to nasion perpendicular); the errors for angular measurements varied from 0.4° (ANB) to 1.6° (interincisal angle).
The assessment of the stages in cervical vertebral maturation on the lateral cephalograms of each subject was performed by 1 investigator (A.C.P.) and then verified by an expert examiner (T.B.). Any disagreements were resolved to the satisfaction of both observers.
Statistical analysis
Descriptive statistics of the craniofacial measurements in the open-bite sample at all 4 observation periods were calculated, as well as the between-stage changes (T2-T1, T3-T2, T4-T3, and the overall T4-T1). The Kolmogorov-Smirnov test showed a lack of normal distribution for several measurements in the study. Therefore, comparisons of the values of the cephalometric variables at the 4 time periods were carried out with nonparametric statistics with the Friedman test (analysis of variance on ranks for repeated measures) followed by Tukey post hoc tests (SigmaStat 3.5).
Prevalence rates for the following changes in overbite were calculated at T2, T3, and T4 with respect to the initial values at T1, and they were expressed in terms of the numbers of subjects showing the change during specific time intervals (T1-T2, T1-T3, and T1-T4): improvement in overbite equal to or greater than +1.5 mm (more positive change), improvement in overbite equal to or greater than +0.5 mm (more positive change), or worsening in overbite equal to or less than −0.5 mm (more negative change).
The prevalence rates of subjects showing correction of open bite at T2, T3, and T4 were calculated. Correction of open bite was assessed when the overbite value was greater than 1.5 mm at the specific time point.
Logistic regression on the cephalometric variables at T1, with the value of overbite at T4 (classified as “self-corrected” when overbite was greater than 1.5 mm vs “not corrected” when overbite was still less than 1.5 mm) as the dependent variable, was performed (stepwise method, with P to enter <0.05 and P to remove >0.1). The basic idea of the stepwise method is to add variables (with P values smaller than 0.05) one at a time as long as these additions improve the model the most. After a variable has been added, all effects in the current model are checked to see whether any of them should be removed (with P values greater than 0.1). Then the process continues until the model cannot be further improved. The aim of logistic regression was to identify T1 predictive variables for favorable or unfavorable individual outcomes in overbite. Logistic regression was carried out with statistical software (version 17.0; SPSS, Chicago, Ill).
Results
Descriptive statistics for the cephalometric measurements at the 4 observation periods and the statistical comparisons among the stages are reported in Table I .
| Measurement n = 24 | T1 | T2 | T3 | T4 | Growth changes and statistical comparisons | |||||||
|---|---|---|---|---|---|---|---|---|---|---|---|---|
| Mean | SD | Mean | SD | Mean | SD | Mean | SD | T1-T2 prepubertal | T2-T3 pubertal | T3-T4 postpubertal | T1-T4 overall | |
| Cranial base | ||||||||||||
| NSBa (°) | 130.3 | 5.3 | 129.9 | 5.3 | 129.8 | 5.5 | 129.9 | 6.1 | −0.4 | −0.1 | 0.1 | −0.4 |
| Maxillary skeletal | ||||||||||||
| SNA (°) | 80.4 | 3.1 | 81.0 | 3.1 | 81.5 | 3.0 | 81.6 | 3.0 | 0.6 | 0.5 | 0.1 | 1.2 ∗ |
| Point A to nasion perpendicular (mm) | 0.1 | 2.7 | −0.1 | 2.8 | 0.4 | 3.0 | 0.5 | 3.1 | −0.2 | 0.5 | 0.1 | 0.4 |
| Co-Point A (mm) | 87.5 | 6.5 | 91.8 | 6.8 | 95.8 | 6.9 | 97.6 | 7.4 | 4.3 ∗ | 4.0 ∗ | 1.8 | 10.1 ∗ |
| Mandibular skeletal | ||||||||||||
| SNB (°) | 76.0 | 2.8 | 76.9 | 3.0 | 77.7 | 3.2 | 78.0 | 3.4 | 0.9 | 0.8 | 0.3 | 2.0 ∗ |
| Pg to nasion perpendicular (mm) | −8.2 | 4.3 | −7.8 | 5.0 | −6.5 | 5.5 | −5.7 | 6.0 | 0.4 | 1.3 | 0.8 | 2.5 ∗ |
| Co-Gn (mm) | 109.1 | 6.5 | 114.6 | 7.5 | 122.6 | 7.6 | 126.4 | 8.5 | 5.5 ∗ | 8.0 ∗ | 3.8 ∗ | 17.3 ∗ |
| Maxillomandibular | ||||||||||||
| ANB (°) | 4.5 | 1.9 | 4.1 | 1.7 | 3.8 | 2.0 | 3.6 | 2.0 | −0.4 | −0.3 | −0.2 | −0.9 ∗ |
| Wits (mm) | −1.9 | 2.3 | −1.0 | 2.8 | −0.7 | 3.2 | −0.1 | 3.1 | 0.9 | 0.3 | 0.6 | 1.8 ∗ |
| Maxillomandibular differential (mm) | 21.7 | 2.6 | 23.9 | 2.8 | 26.8 | 3.3 | 28.8 | 3.8 | 2.2 | 2.9 ∗ | 2.0 | 7.1 ∗ |
| Vertical skeletal | ||||||||||||
| Frankfort horizontal to palatal plane (°) | −2.9 | 2.4 | −2.0 | 2.9 | −1.8 | 3.1 | −2.0 | 3.2 | 0.9 | 0.2 | −0.2 | 0.9 |
| Frankfort horizontal to mandibular plane (°) | 28.2 | 3.6 | 27.6 | 4.1 | 26.7 | 4.2 | 25.9 | 4.4 | −0.6 | −0.9 | −0.8 | −2.3 ∗ |
| Palatal plane to mandibular plane (°) | 25.3 | 4.9 | 25.6 | 5.6 | 25.0 | 5.9 | 23.8 | 6.0 | 0.3 | −0.6 | −1.2 | −1.5 ∗ |
| N-ANS (mm) | 48.6 | 3.2 | 52.3 | 3.8 | 55.4 | 4.3 | 56.4 | 4.5 | 3.7 ∗ | 3.1 ∗ | 1.0 | 7.8 ∗ |
| ANS-Me (mm) | 66.7 | 5.0 | 69.5 | 6.0 | 73.5 | 6.9 | 75.8 | 7.4 | 2.8 | 4.0 ∗ | 2.3 | 9.1 ∗ |
| N-Me (mm) | 112.8 | 6.8 | 119.4 | 8.4 | 126.5 | 9.6 | 129.8 | 10.2 | 6.6 ∗ | 7.1 ∗ | 3.3 ∗ | 17.0 ∗ |
| S-Go (mm) | 68.6 | 5.4 | 74.3 | 6.5 | 80.3 | 7.4 | 83.8 | 9.0 | 5.7 ∗ | 6.0 ∗ | 3.5 | 15.2 ∗ |
| S-Go/N-Me (%) | 60.8 | 3.3 | 62.3 | 3.7 | 63.5 | 3.7 | 64.5 | 4.4 | 1.5 ∗ | 1.2 | 1.0 | 3.7 ∗ |
| Co-Go (mm) | 50.4 | 3.6 | 53.1 | 4.8 | 58.0 | 4.5 | 61.0 | 5.7 | 2.7 ∗ | 4.9 ∗ | 3.0 | 10.6 ∗ |
| ArGoiMe (°) | 130.4 | 3.8 | 128.6 | 3.7 | 126.9 | 4.2 | 125.1 | 4.9 | −1.8 ∗ | −1.7 ∗ | −1.8 ∗ | −5.3 ∗ |
| Interdental | ||||||||||||
| Overjet (mm) | 6.2 | 2.2 | 6.0 | 1.9 | 5.6 | 1.8 | 5.2 | 1.9 | −0.2 | −0.4 | −0.4 | −1.0 ∗ |
| Overbite (mm) | 0.0 | 1.5 | 2.4 | 2.1 | 2.4 | 2.0 | 2.3 | 2.2 | 2.4 ∗ | 0.0 | −0.1 | 2.3 ∗ |
| Molar relationship (mm) | 0.5 | 1.3 | 0.9 | 1.2 | 1.4 | 1.5 | 1.6 | 1.5 | 0.4 | 0.5 | 0.2 | 1.1 ∗ |
| Maxillary dentoalveolar | ||||||||||||
| U1 to Frankfort horizontal (°) | 116.3 | 5.0 | 114.2 | 5.6 | 113.5 | 6.1 | 113.2 | 6.4 | −2.1 ∗ | −0.7 | −0.3 | −3.1 ∗ |
| U1 vertical (mm) | 22.4 | 2.0 | 24.6 | 2.3 | 25.9 | 2.4 | 26.7 | 2.6 | 2.2 ∗ | 1.3 ∗ | 0.8 ∗ | 4.3 ∗ |
| U6 vertical (mm) | 25.5 | 2.2 | 27.3 | 2.5 | 29.2 | 2.8 | 30.3 | 2.9 | 1.8 ∗ | 1.9 ∗ | 1.1 ∗ | 4.8 ∗ |
| Mandibular dentoalveolar | ||||||||||||
| L1 to mandibular plane (°) | 95.9 | 5.2 | 95.2 | 6.0 | 94.9 | 6.5 | 94.5 | 6.4 | −0.7 | −0.3 | −0.4 | −1.4 |
| L1 vertical (mm) | 30.8 | 2.6 | 33.0 | 3.2 | 35.2 | 3.6 | 36.6 | 4.0 | 2.2 ∗ | 2.2 ∗ | 1.4 | 5.8 ∗ |
| L6 vertical (mm) | 28.9 | 3.1 | 30.6 | 3.5 | 32.9 | 3.6 | 34.1 | 4.0 | 1.7 ∗ | 2.3 ∗ | 1.2 | 5.2 ∗ |
Stay updated, free dental videos. Join our Telegram channel
VIDEdental - Online dental courses


