Introduction
It is important to reduce the method errors when evaluating posteroanterior cephalograms to see either small deviations from normal or transverse changes caused by orthodontic treatment. The aim of this study was to determine horizontal and vertical intraexaminer and interexaminer agreement in localization of landmarks in posteroanterior cephalograms of adult patients.
Methods
The sample was gathered retrospectively from the archives of the Department of Orthodontics of Yeditepe University in Istanbul, Turkey. Radiographs of 39 patients diagnosed with skeletal asymmetries (20 women, 19 men) were drawn manually, and a coordinate system was established with software. The tracings were made by 2 operators, after a calibration session on 29 landmarks (22 bilateral, 7 midline). Intraclass correlation coefficients and the Bland-Altman test were used for detecting interexaminer and intraexaminer agreement for each cephalometric variable.
Results
The interexaminer agreement test showed that the most problematic landmark was crista galli, which showed moderate consistency between 2 examiners in the y coordinates at 2 time points. Condylar and zygomatic landmarks showed good agreement. The greater wing inferior and superior orbit, maxillary point, menton, anterior nasal spine, antegonial notch, mandibular and maxillary molar point, maxillary and mandibular incisor point, and maxillary and mandibular incisor edge landmarks had excellent agreement between the 2 examiners at the 2 time points in both the x and y coordinates.
Conclusions
There are fewer errors in intraexaminer than in interexaminer correlations in landmark identifications on posteroanterior radiographs. All landmarks investigated except crista galli showed good agreement between measurements.
Highlights
- •
We examined agreement of 2 examiners locating landmarks on posteroanterior cephalograms of adults.
- •
Intraclass correlation coefficients were used to detect inter- and intraexaminer agreement.
- •
Intraexaminer error was lower than interexaminer correlation.
- •
All landmarks except crista galli had good agreement between measures.
Posteroanterior (PA) cephalometric radiographs help to evaluate maxillofacial structures in the transverse plane and are requested by the clinician if there is doubt about any problems in the transverse plane. Even though 3-dimensional (3D) cone-beam computed tomography technology is now available at most clinics, and it seems to give more reliable and extensive information on the asymmetry of the face, where this technology is not yet available, or when most of the available archive for comparison and longitudinal research is still only in 2-dimensional (2D) records, PA radiographs are still used. For the imaging to be useful, there should be reliably identified landmarks for accurate measurements. A recently published systematic review concluded that there is only 1 article on landmark errors that fulfilled the selection criteria, and that study was performed on dry skulls. This review article cautioned clinicians to take care in interpreting studies that used dry skulls because another article by Hägg et al stated that skeletal and dental angular errors are greater, up to 4 times greater for some measurements, in the presence of soft tissues. There are limitations in using these radiographs: eg, difficulty in positioning the head and reproducing head posture, radiographic errors related to projection, errors in identifying landmarks, and finding a straight reference line. Regarding errors in identifying landmarks, the most problematic points lie on the curved lines, in areas of low contrast, and with other structures superimposed. Errors of interpretation are reduced by clear definitions and training. Therefore, the aim of this study was to determine the horizontal and vertical intraexaminer and interexaminer identification errors in the localization of landmarks in the PA radiographs of adult patients. The null hypothesis was that there are no differences in the accuracy and reproducibility of landmark identifications between 2 orthodontists at 2 time points, 1 month apart.
Material and methods
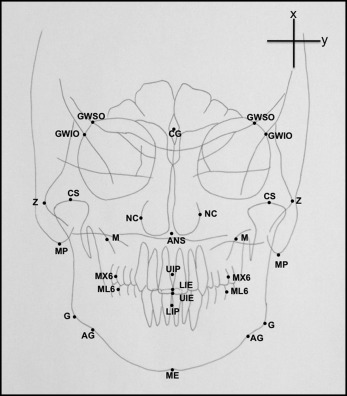
The sample PA radiographs of this study, which had the same resolution and quality, were gathered randomly from the 10-year archive at the Department of Orthodontics, Faculty of Dentistry, of Yeditepe University, Istanbul, Turkey. The radiographs belonged to 39 asymmetric patients (20 women, 19 men) ranging in age from 18 to 45 years (mean ± SD, 31.3 ± 12.2 years). The following were the inclusion criteria: no cleft and lip, and no diagnosed systemic diseases or craniofacial syndromes. Patient data were handled according to the requirements and recommendations of the Declaration of Helsinki. Ethical approval was obtained from the institutional review board of Yeditepe University. The cephalometric radiographs used in this study were created using a Promax x-ray device (Planmeca, Helsinki, Finland) with the patients were in natural head position. Source to ear rod distance was 160 cm, and ear rod to film distance was 17.5 mm. All radiographs were covered with tracing paper. For each radiograph, an individual coordinate system was formed. On each corner of the paper, a large plus sign was drawn to trace the papers identically, and the sign on the upper right corner was used used as the x and y coordinates ( Fig 1 ). The tracings were made by 2 operators (F.U. and D.G.C.), who are experienced orthodontists, after a calibration session with the written definitions of the points and practical trials were carried out together. A total of 29 landmarks were marked on tracing paper manually using a 0.1-mm pen (Ecco pigment; Faber-Castell, Stein, Germany): 22 landmarks were bilateral, and 7 were on the midline. The list and the definitions of landmarks marked on each PA cephalometric radiograph are given in Table I . The operators repeated the tracings 1 month later.
| Landmark | Definition |
|---|---|
| Bilateral skeletal landmarks (18 landmarks) | |
| Greater wing superior orbit (GWSO) | Intersection of the superior border of the greater wing of the sphenoid bone and the lateral orbital margin |
| Greater wing inferior orbit (GWIO) | Intersection of the inferior border of the greater wing of the sphenoid bone and the lateral orbital margin |
| Zygomatic (Z) | Most lateral aspect of the zygomatic arch |
| Condyle superior (CS) | Most superior aspect of the condyle |
| Mastoid process (MP) | Most inferior point on the mastoid process |
| Nasal cavity (NC) | Most lateral point on the nasal cavity |
| Maxillary point (MP) | Center of the concavity of the zygomatic process of the maxilla |
| Gonion (G) | Midpoint on the curvature at the angle of the mandible (gonion) |
| Antegonial (AG) | Deepest point on the curvature of the antegonial notch |
| Midline skeletal landmarks (3 landmarks) | |
| Crista galli (CG) | Geometric center of crista galli |
| Anterior nasal spine (ANS) | Center of the intersection of the nasal septum and the palate |
| Menton (ME) | Midpoint on the inferior border of the mental protuberance |
| Bilateral dental landmarks (4 landmarks) | |
| Maxillary molar (MX6) | Midpoint on the buccal surface of the maxillary first molar |
| Mandibular molar (ML6) | Midpoint on the buccal surface of the mandibular first molar |
| Midline dentoalveolar landmarks (4 landmarks) | |
| Upper incisor point (U1P) | Crest of the alveolus between the maxillary central incisors |
| Upper incisor edge (U1E) | Midpoint on the incisal edges of the maxillary incisors |
| Lower incısor edge (L1E) | Midpoint on the incisal edges of the mandibular incisors |
| Lower incisor point (L1E) | Crest of the alveolus between the mandibular central incisors |
The tracing papers were scanned into digital format at 300 dpi using a scanner (1680 Pro; Epson, Nagano, Japan) with 1600 dpi imaging, 40 × 800 pixels per line, and 48-bit color depth for both film and reflective scanning, and displayed on a 15-in, 1024 × 768 high-pixel resolution monitor (model FP581, Benq, Taipei, Taiwan) with a pixel pitch of 0.297 mm, a contrast ratio of 450:1, and brightness of 250 candela per square meter. Each scanned paper was saved as a portable document file (PDF). The coordinate system was established with software (AutoCAD, 2004 version; Autodesk, San Rafael, Calif).
Statistical calculations were carried out with software (NCSS, Kaysville, Utah) for Windows. In addition to descriptive statistics (means, standard deviations), intraclass correlation coefficients (ICCs) were used for determining interexaminer and intraexaminer agreement for each cephalometric variable. ICC, derived from analysis of variance, assesses rating reliability by comparing the variability of the different ratings of the same subject to the total variation across all ratings and all subjects. It is a measure of the homogeneity of elements within clusters and has a maximum value of 1 when there is complete homogeneity within clusters. For the detection of interexaminer error, the mean of the 2 measurements done by each examiner was used. To better understand the disagreement seen for controversial points, Bland-Altman plots were used to explore the results in a graphic approach.
Results
The results showed that each operator was consistent in the repeated measurements (intraexaminer agreement) in most landmarks marked ( Table II ). ICC values of 0.75 or above are considered good, and those above 0.90 are excellent. In this section, landmarks with an ICC less than 0.90 are reported along with the millimeter difference between measurements for ease of comparison with previous studies.
| Landmark | Intraexaminer (F.U.) | Intraexaminer (D.G.C.) | Interexaminer marking 1 | Interexaminer marking 2 | ||||
|---|---|---|---|---|---|---|---|---|
| x-axis | y-axis | x-axis | y-axis | x-axis | y-axis | x-axis | y-axis | |
| Greater wing superior orbit, right | 0.9965 | 0.9873 | 0.9924 | 0.9846 | 0.9867 | 0.9715 | 0.9905 | 0.9683 |
| Greater wing superior orbit, left | 0.9959 | 0.9643 | 0.9958 | 0.9557 | 0.9944 | 0.9815 | 0.9915 | 0.9681 |
| Greater wing inferior orbit, right | 0.9953 | 0.9912 | 0.9919 | 0.9844 | 0.9927 | 0.9632 | 0.9948 | 0.9690 |
| Greater wing inferior orbit, left | 0.9971 | 0.9666 | 0.9932 | 0.9558 | 0.9972 | 0.9811 | 0.9949 | 0.9785 |
| Zygomatic, right | 0.9809 | 0.9878 | 0.9915 | 0.9873 | 0.8603 | 0.9671 | 0.8704 | 0.9766 |
| Zygomatic, left | 0.9960 | 0.9600 | 0.9962 | 0.9525 | 0.9988 | 0.9777 | 0.9960 | 0.9666 |
| Condyle superior, right | 0.9892 | 0.9612 | 0.9129 | 0.9743 | 0.8968 | 0.8556 | 0.8691 | 0.8815 |
| Condyle superior, left | 0.9959 | 0.9424 | 0.9935 | 0.9722 | 0.9799 | 0.8878 | 0.9801 | 0.9149 |
| Mastoid process, right | 0.9892 | 0.9984 | 0.8834 | 0.9863 | 0.9847 | 0.9978 | 0.9178 | 0.9899 |
| Mastoid process, left | 0.9931 | 0.9788 | 0.9917 | 0.9829 | 0.9954 | 0.9987 | 0.9937 | 0.9839 |
| Nasal cavity, right | 0.9938 | 0.9569 | 0.9935 | 0.9752 | 0.9970 | 0.9064 | 0.9929 | 0.9665 |
| Nasal cavity, left | 0.9964 | 0.9708 | 0.9954 | 0.9654 | 0.9972 | 0.8975 | 0.9954 | 0.9493 |
| Maxillary point, right | 0.9911 | 0.9821 | 0.9913 | 0.9587 | 0.9912 | 0.9275 | 0.9933 | 0.9688 |
| Maxillary point, left | 0.9929 | 0.9729 | 0.9928 | 0.9585 | 0.9982 | 0.9745 | 0.9951 | 0.9739 |
| Gonion, right | 0.9861 | 0.9972 | 0.9854 | 0.9410 | 0.9882 | 0.9855 | 0.9900 | 0.9338 |
| Gonion, left | 0.8770 | 0.9918 | 0.9325 | 0.9876 | 0.8757 | 0.9934 | 0.9369 | 0.9940 |
| Antegonial, right | 0.9854 | 0.9972 | 0.9880 | 0.9985 | 0.9937 | 0.9968 | 0.9903 | 0.9972 |
| Antegonial, left | 0.9919 | 0.9911 | 0.9931 | 0.9878 | 0.9979 | 0.9967 | 0.9935 | 0.9941 |
| Crista galli | 0.9966 | 0.9740 | 0.9938 | 0.9158 | 0.9914 | 0.7961 | 0.9939 | 0.7878 |
| Anterior nasal spine | 0.9946 | 0.9782 | 0.9690 | 0.9711 | 0.9974 | 0.9790 | 0.9632 | 0.9818 |
| Menton | 0.9901 | 0.9977 | 0.9874 | 0.9975 | 0.9774 | 0.9994 | 0.9850 | 0.9986 |
| Maxillary first molar, right | 0.9931 | 0.9936 | 0.9910 | 0.9950 | 0.9908 | 0.9661 | 0.9890 | 0.9693 |
| Maxillary first molar, left | 0.9933 | 0.9856 | 0.9934 | 0.9774 | 0.9977 | 0.9552 | 0.9960 | 0.9551 |
| Mandibular first molar, right | 0.9937 | 0.9950 | 0.9887 | 0.9897 | 0.9957 | 0.9784 | 0.9938 | 0.9759 |
| Mandibular first molar, left | 0.9929 | 0.9859 | 0.9934 | 0.9825 | 0.9976 | 0.9845 | 0.9961 | 0.9812 |
| Upper incisor point | 0.9937 | 0.9929 | 0.9911 | 0.9839 | 0.9992 | 0.9696 | 0.9965 | 0.9797 |
| Upper incisor edge | 0.9876 | 0.9941 | 0.9880 | 0.9897 | 0.9973 | 0.9937 | 0.9971 | 0.9929 |
| Lower incısor edge | 0.9851 | 0.9889 | 0.9866 | 0.9897 | 0.9977 | 0.9857 | 0.9960 | 0.9854 |
| Lower incisor point | 0.9926 | 0.9950 | 0.9906 | 0.9912 | 0.9993 | 0.9814 | 0.9964 | 0.9793 |
One examiner (F.U.) had ICC values of 0.88 and 0.99 for the x and y coordinates of the left gonion. The mean difference of the 2 markings for this landmark was 0.37 ± 1.28 mm for the x coordinate ( Table III ). The x coordinate of the right mastoid process showed an ICC of 0.88 by 1 examiner (F.U.). The mean difference of the 2 markings for this landmark was 0.47 ± 0.35 mm for the x coordinate. The rest of the intraexaminer ICC values were mostly higher than 0.90 or 0.95, showing excellent agreement ( Table II ).
| Landmark | Intraexaminer (F.U.) | Intraexaminer (D.G.C.) | Interexaminer marking 1 | Interexaminer marking 2 | ||||
|---|---|---|---|---|---|---|---|---|
| x-axis, mean difference ± SD | y-axis, mean difference ± SD | x-axis, mean difference ± SD | y-axis, mean difference ± SD | x-axis, mean difference ± SD | y-axis, mean difference ± SD | x-axis, mean difference ± SD | y-axis, mean difference ± SD | |
| Gonion, left | 0.37 ± 1.28 | 0.84 ± 0.09 | 0.29 ± 0.52 | 0.40 ± 1.11 | 0.73 ± 1.94 | 0.84 ± 0.31 | 0.84 ± 0.40 | 0.33 ± 1.02 |
| Mastoid process, right | 0.00 ± 0.69 | 0.65 ± 0.36 | 0.47 ± 0.35 | 0.35 ± 1.03 | 0.90 ± 0.12 | 0.93 ± 0.12 | 0.74 ± 036 | 0.90 ± 0.16 |
| Zygomatic, right | 0.20 ± 0.79 | 0.20 ± 0.58 | 0.27 ± 0.54 | 0.70 ± 0.61 | 0.41 ± 0.93 | 0.50 ± 0.58 | 0.34 ± 0.92 | 0.72 ± 0.32 |
| Condyle superior, right | 0.03 ± 0.60 | 0.29 ± 1.21 | 0.16 ± 1.35 | 0.02 ± 1.08 | 0.75 ± 0.97 | 0.71 ± 1.04 | 0.55 ± 0.97 | 0.40 ± 1.04 |
| Crista galli | 1.04 ± 0.68 | 0.31 ± 1.23 | 0.76 ± 0.85 | 0.24 ± 1.26 | 0.34 ± 0.73 | 0.60 ± 0.54 | 0.17 ± 0.86 | 0.52 ± 0.60 |
Stay updated, free dental videos. Join our Telegram channel
VIDEdental - Online dental courses


