Introduction
The purposes of this study were to measure the 3-dimensional parameters of the posed smile and to see whether there are any correlations with vertical cephalometric skeletal measurements.
Methods
Pretreatment records from a sample of 110 white girls between the ages of 12 and 18 years were gathered. The measurements of SN-GoGn, anterior facial height, and lower and upper facial height percentages were obtained from tracing lateral cephalograms. Superimposing the repose and the posed smile facial scans allowed for measurements to be obtained showing the movements in the x, y, and z dimensions of the upper and lower lips, the commissures, and the Cupid’s bows. Correlations and multiple linear regression analyses were run to check for associations and predictive relationships between the cephalometric skeletal measurements and soft tissue changes.
Results
We found significant moderate correlations and weak correlations. Significant multiple regression models were found for intercommissural width, smile index, and lower lip in the y and z dimensions.
Conclusions
There were moderate correlations showing that as SN-GoGn and anterior facial height increased, the interlabial gap increased as the smile index decreased. Significant relationships were found between certain hard tissue cephalometric measurements and the width of the smile as well as the movements of the lower lip.
Highlights
- •
Posed smiles were measured in 3 dimensions and compared with vertical skeletal measurements.
- •
As SN-GoGn and anterior facial height increased, interlabial gap increased.
- •
As SN-GoGn and anterior facial height increased, smile index decreased.
- •
Some hard tissue measurements were significantly related to smile width.
- •
Some hard tissue measurements were significantly related to movements of the lower lip.
The smile is an important part of social interaction. Smiles project a variety of positive emotions such as happiness, approval, and humor. An esthetically pleasing smile may improve a person’s confidence in social situations. Therefore, it may not be surprising that a main reason that younger children and their parents seek orthodontic care is to reduce teasing.
As patients become more concerned with the esthetics of their smile, it is more relevant for orthodontists to pay attention to the soft tissue framework.
It would be prudent to evaluate the parameters of a smile before treatment to determine not only what needs to be done, but also what can be done, and to communicate that with the patient and parent. Ackerman and Ackerman pointed out that when one analyzes a smile, compromises between the opposing factors of esthetic goals and the patient’s physiologic limitations are often made. For example, a patient who desires less gingival show on smiling and who does not exhibit a vertical maxillary excess or an inappropriate smile arc would benefit more from gingivectomy and crown lengthening than from orthodontic treatment.
Although the associations between cephalometric measurements and clinical observations have long been studied, less attention has been given to possible associations between hard tissue characteristics as quantified by cephalometrics and the soft tissue characteristics of the smile. Using an optic white light scanning system, we can study such associations with no hazardous risks for the patient, with the added benefit of short image acquisition times.
The purposes of this study were to see whether there were any correlations between the soft tissues of the posed smile and the vertical cephalometric skeletal measurements and whether there are any inherent differences in lip movements during smiling based on the skeletal pattern.
Material and methods
A sample of 110 subjects was selected from the pretreatment records at the orthodontic department of Saint Louis University Center for Advanced Dental Education. The records used for this study all came from the initial records that were taken after the initial diagnostic protocol of the clinic.
The subjects were selected based on the following inclusion criteria: white girls between the ages of 12 and 18 years at the time of initial records. The exclusion criteria were previous orthodontic treatment, appliances on the dentition, and craniofacial abnormalities. The average age of the 110 subjects was 14.05 ± 1.65 years.
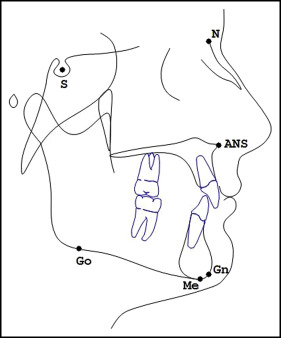
To obtain the skeletal landmark measurements, initial digital lateral cephalograms were taken with a radiography unit (model CS9300; Carestream Health, Rochester, NY). They were then uploaded and traced with Dolphin Imaging Software (version 11.0; Dolphin Imaging and Management Solutions, Chatsworth, Calif). Each cephalogram was traced by the principal investigator (E.K.T.). For each cephalogram, the following 6 hard tissue anatomic landmarks were located: sella, nasion, gonion, gnathion, menton, and anterior nasal spine. The diagram of their locations is shown in Figure 1 . Using these landmarks, we recorded the following measurements: (1) mandibular plane angle, (2) anterior facial height, (3) upper facial height as a percentage, and (4) lower facial height as a percentage. The definitions of these measurements are given in Table I .
| Abbreviation | Landmark | Definition |
|---|---|---|
| SN-GoGn | Sella-nasion–gonion-gnathion | Angle derived from the bisection of the line connecting sella and nasion and the line connecting gonion and gnathion |
| AFH | Anterior facial height | Millimetric measurement of the line connecting nasion and menton |
| UFH% | Upper facial height as a percentage | (N-Ans)/(N-ANS+ANS-Me) * 100 |
| LFH% | Lower facial height as a percentage | (ANS-Me)/(N-ANS+ANS-Me) * 100 |
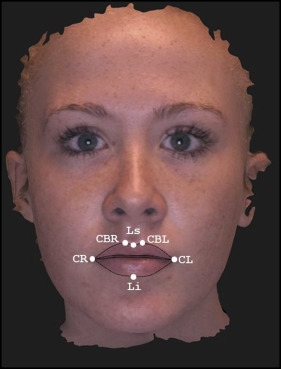
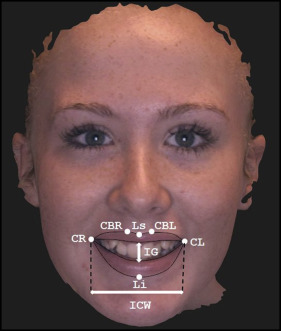
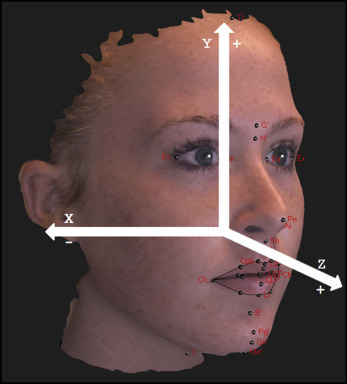
Each subject had a 3-dimensional (3D) soft tissue facial scan in repose and a scan of a posed smile taken by the same technician using a 3D scanner (Morpheus, Seoul, Korea) that were then uploaded into Morpheus3D software (version 2.0). The patients were seated at a marker on the floor at the recommended 60- to 70-cm range from the scanner. To obtain a posed smile, the technician practiced with the subjects, instructing them to “smile big” with their teeth showing. The scans were reoriented visually by the principal investigator, taking into consideration the vertical midline of the face and the horizontal interpupillary line. On each scan, 6 soft tissue landmarks were digitized by the principal investigator: (1) lip superior, (2) lip inferior, (3) commissure right, (4) commissure left, (5) Cupid’s bow right, and (6) Cupid’s bow left. On each posed smile scan, interlabial gap and intercommissural width were identified. The definitions of these soft tissue parameters are given in Table II . Examples of the digitized scans in repose and smiling are shown in Figures 2 and 3 , respectively. With the Morpheus 3D software, for each subject, the posed smile scan was superimposed on the repose scan. The software uses the iterative closest point algorithm for superimpositions. From the superimpositions, the change for each point from repose to smiling was recorded in the x, y, and z dimensions. An example of the Cartesian coordinate system can be seen in Figure 4 . Measurements were recorded from the posed smile scans for interlabial gap and intercommissural width, and the smile index was calculated ( Table III ).
| Abbreviation | Landmark | Definition |
|---|---|---|
| CBLx CBLy CBLz |
Cupid’s bow left (in the x, y, and z dimensions) | The apex where the curve of the vermilion border of the lip coming from the commissure meets the curve of the vermilion border coming up from the philtrum on the left side of the mouth |
| CBRx CBRy CBRz |
Cupid’s bow right (in the x, y, and z dimensions) | The apex where the curve of the vermilion border of the lip coming from the commissure meets the curve of the vermilion border coming up from the philtrum on the ride side of the mouth |
| CLx CLy CLz |
Commissure left (in the x, y, and z dimensions) | Corner of the left side of the mouth where the vermilion border of the upper lip meets the vermilion border of the lower lip |
| CRx CRy CRz |
Commissure right (in the x, y, and z dimensions) | Corner of the right side of the mouth where the vermilion border of the upper lip meets the vermilion border of the lower lip |
| Lix Liy Liz |
Lip inferior (in the x, y, and z dimensions) | The most inferior point on the midline of the lower lip |
| Lsx Lsy Lsz |
Lip superior (in the x, y, and z dimensions) | The most superior point on the midline of the upper lip |
| Abbreviation | Parameter | Definition |
|---|---|---|
| IG | Interlabial gap | Millimetric measurement of the line connecting the most inferior portion on the midline of the upper lip and the most superior point on the midline of the lower lip |
| ICW | Intercommissural width | Millimetric measurement of the line connecting the right and left commissures of the mouth |
| SI | Smile index | ICW÷IG |
Statistical analysis
All descriptive data and statistical analyses were done with SPSS (version 20; IBM, Armonk, NY). In this study, we tested the null hypothesis that there are no relationships between the cephalometric skeletal measurements and the soft tissue characteristics of the smile. Pearson correlation coefficients were generated to see whether there were any associations. Multiple linear regression analysis was used to test for relationships among the variables, with a P value less than 0.05 significant. Since 1 assumption for multiple linear regression is that there are no outliers, each dependent variable measurement set was checked for outliers; if found, the measurement from that subject was dropped from the analysis.
Intraclass correlations greater than or equal to 0.80 are considered to be adequately reliable. Ten percent of the lateral cephalograms and soft tissue scans were randomly selected and remeasured by the principal investigator to test for intraexaminer reliability. All measurements in both the cephalograms and the soft tissue facial scans yielded a Cronbach alpha well above 0.80. This demonstrated that the original and repeated measurements had acceptable levels of consistency for the examiner’s landmark location identification.
Stay updated, free dental videos. Join our Telegram channel
VIDEdental - Online dental courses


