Introduction
The objective of this study was to determine the Hounsfield unit (HU) changes in the alveolar bone and root surfaces during controlled canine retractions.
Methods
Eighteen maxillary canine retraction patients were selected for this split-mouth design clinical trial. The canines in each patient were randomly assigned to receive either translation or controlled tipping treatment. Pretreatment and posttreatment cone-beam computed tomography scans of each patient were used to determine tooth movement direction and HU changes. The alveolar bone and root surface were divided into 108 divisions, respectively. The HUs in each division were measured. Mixed-model analysis of variance was applied to test the HU change distribution at the P <0.05 significance level.
Results
The HU changes varied with the directions relative to the canine movement. The HU reductions occurred at the root surfaces. Larger reductions occurred in the divisions that were perpendicular to the moving direction. However, HUs decreased in the alveolar bone in the moving direction. The highest HU reduction was at the coronal level.
Conclusions
HU reduction occurs on the root surface in the direction perpendicular to tooth movement and in the alveolar bone in the direction of tooth movement when a canine is retracted.
Highlights
- •
We studied the mineral density changes in the alveolar bone and root surface during controlled canine retractions.
- •
The mineral density was represented by Hounsfield units (HU).
- •
HU reductions occurred on the root surface in the direction perpendicular to tooth movement.
- •
HU reductions occurred in the alveolar bone in the direction of the tooth.
Bone modeling and remodeling are essential to orthodontic tooth movement. When using mechanical forces to move the teeth with orthodontic appliances, coupled bone formation and resorption occur on the tension and compression sides of the periodontal ligament (PDL). Although biologic responses have been widely investigated in animal experiments, direct evidence of bone modeling and remodeling during orthodontic tooth movement in patients is still lacking.
During tooth movement, the change of mechanical environment in terms of stress and strain in the PDL and bone triggers the biologic reaction. On the compression side, osteoclasts are recruited and absorb the bone. On the tension side, osteoblasts are recruited, and new bone is deposited. Different treatment strategies introduce different stress distribution patterns in the PDL. A clinical study about the effect of treatment strategy to biologic response will help to understand the tooth movement mechanism.
Cone-beam computed tomography (CBCT) technology can be used for acquiring 3-dimensional (3D) skeletal radiographs for dental uses. CBCT, which generates lower doses of radiation than medical computed tomography, allows us to assess bone densities during orthodontic treatment. To evaluate bone remodeling on CBCT images, Hounsfield units (HUs) have been used to represent bone mineral density (BMD) and to quantify relative changes in alveolar bone. The Hounsfield scale is used to measure radiodensity in medical computed tomography scans; this provides accurate absolute density for bone or other tissues. Unlike medical computed tomography, assigned HUs to voxels in CBCT images are relative HUs, which are affected by the surrounding tissues and cannot be directly used to calculate BMD values. In addition, the Hounsfield scale varies between CBCT machines; this makes HU values incomparable between different CBCT systems. However, studies suggest that reliable HUs can be obtained from serial CBCT images during orthodontic treatment using the same machine with identical scanning settings. In this kind of longitudinal study with subjects as their own controls, HUs acquired from CBCT are reportedly highly reliable compared with medical computed tomography and actual BMD, particularly when evaluation of their percent changes is of interest.
Reduction in BMD with a decreased alveolar bone fraction was noted in both animal and human studies after tooth movement. Chang et al suggested that maximum BMD reduction occurs along the direction of the tooth movement, and Hsu et al showed BMD changes along the tooth’s long axis as the tooth moves. In these studies, tooth displacement in terms of magnitude and direction was not well defined, and the BMD was checked only in scattered areas. Furthermore, HU change on the dental root surface indicating root resorption during orthodontic treatment has not been reported previously.
The aim of this prospective radiographic study was to investigate HU changes in the root and surrounding alveolar bone during canine retraction. The objectives were to determine (1) how the HUs change due to the canine retraction, and (2) whether the changes depend on the treatment strategies (translation vs controlled tipping).
Material and methods
After institutional review board approval from Indiana University and signed consents from patients, 18 patients (7 male, 11 female) were recruited for this prospective study. The inclusion criterion was necessity for extraction of both maxillary first premolars and maxillary canine retraction for orthodontic treatment. The average age of the patients was 19 ± 9 years old (range, 12-47 years). Before the study, the right and left first premolars were extracted, and the maxillary dental arch was leveled and aligned with 0.019 × 0.025-in stainless steel archwire engaged in 0.022 × 0.028-in slot brackets. The maxillary second molars were included in the archwire, and the maxillary second premolar, first molar, and second molar were coligated with a 0.010-in stainless steel wire on each side. The bilateral first molars were connected with a transpalatal arch to strengthen the anchorage. The canine retraction period varied depending on the size of initial space, appointment, and interpatient variations. The average was 4.9 months. The canines were displaced by an average of 2.1 ± 1.5 mm. Canine displacement and its direction at the end of canine retraction were determined from the CBCT images.
For each patient, segmental T-loops were randomly assigned to the right and left canines to implement either translation or controlled tipping. The T-loop delivered approximately 125 cN of closing force with a predesigned moment-to-force ratio to provide a translation or a controlled tipping load.
The maxillary CBCT scans were performed on the same i-CAT Next Generation Imaging System (Imaging Sciences International, Hatfield, Pa). The field of view was 16 × 13.3 cm, voxel size was 0.25 mm, and scan time was 26.9 seconds. The scans of each patient were taken immediately before and after canine retraction. The same subject’s posture with a head strap and the same setting were used for all the scans.
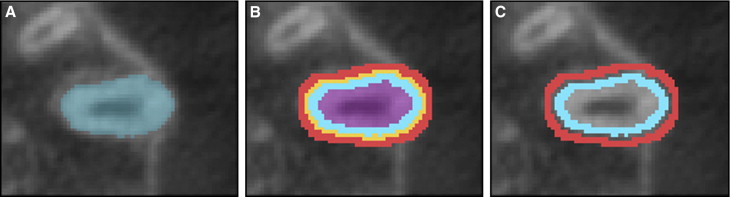
Both CBCT images were imported by 1 investigator (F.J.) into Mimics (version 13.0; Materialise, Leuven, Belgium) to reconstruct the 3D root and alveolar bone. The occlusal plane was aligned with the horizontal plane. The canine displacements were computed by overlapping the reconstructed 3D digital maxilla before and after canine retraction using the interactive closest point method. The calculated tooth displacement included both tooth displacement and direction. The tooth movement direction was used to align the divisions characterizing the locations of HU changes. To study the HU changes, the root was segmented first. The PDL was recognized as 1 voxel (0.25 mm) of radiolucency surrounding the root. The surrounding alveolar bone within 2 radiopaque voxels (0.5 mm) to the PDL was formed into a bone shell. A root surface shell was then defined by eroding the PDL with 2 voxels ( Fig 1 ).
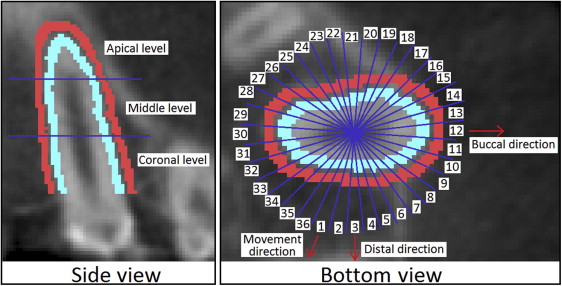
The root surface and alveolar bone shells were divided into 3 vertical levels, each with 36 circumferential divisions. In the vertical direction, the serial axial slices from the root apex to the cervical enamel junction were equally divided into 3 levels: apical, middle, and coronal. In the occlusal plane, the shells were divided into 36 divisions circumferentially around the tooth (D1 to D36). For the occlusal view, the divisions were labeled counterclockwise for the left canine and clockwise for the right canine with the division in the direction of movement (compression side) labeled as D1 ( Fig 2 ). The divisions D19 on both canines were opposite to the direction of movement and subjected to tension. The divisions D2 to D18 were located on the buccal side, whereas D20 to D36 were on the lingual side. The average value of the HU of each division in each level was computed from both pretreatment and posttreatment CBCT scans. The changes in HU defined by subtraction of the pretreatment HU from the posttreatment HU at each division were computed and plotted.
Statistical analysis
Mixed-model analysis of variance (ANOVA) was used to evaluate the effects of treatment strategy, direction of tooth movement, and divisions by different thirds on HU changes. Random effects were included for subject, subject-by-treatment, subject-by-direction, and subject-by-division. Means, standard errors, and 95% confidence intervals for the means were estimated using ANOVA.
To assess the repeatability of the HU measurement obtained from the CBCT images, a custom-designed phantom (Computerized Imaging Reference Systems, Norfolk, Virginia) was scanned 5 times using the identical CBCT settings, and 1 investigator (F.J.) determined all HU measures. The phantom included 16 standardized BMD rods distributed on the dental arches, with BMD ranging between 100 and 700 mg per cubic centimeter. The intraclass correlation coefficient (ICC) was calculated to assess the variation and the reliability.
The errors due to the segmentation process were also assessed. The process for segmenting the root surface and surrounding alveolar bone from 1 CBCT scan was repeated 5 times. The averages and standard deviations of the HUs of all directions were computed at the root surface and the surrounding alveolar bone to estimate the segmentation errors and variations.
Results
The CBCT scans of a phantom with the same settings have negligible variations, since the ICC was determined to be 0.94 between the HU values of the standardized BMD rods and the HU values obtained from the CBCT images, indicating high correlation among the scans. The segmentation error test resulted in an average error of 3.1 HU for root surface and 3.3 HU for surrounding alveolar bone; these are less than 1% of the maximum HU value. The method is adequate for this study.
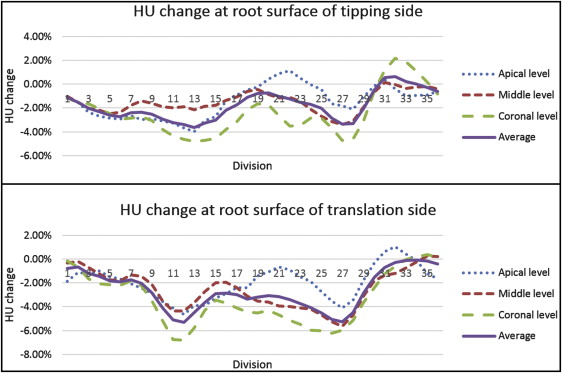
We studied HU changes at the root surface using the combined data from the 2 strategies. The average HU changes on the entire root surface due to canine retraction are shown in Figure 3 . In general, the HU values on the root surfaces decreased because of the treatment. Apparently, the HU reduction varied among the 3 levels. The division average HU values were reduced by 1.7% (±11.2%), 2.0% (±10.1%), and 2.9% (±11.3%) at the apical, middle, and coronal levels, respectively. For the HU reductions in different directions, the maximum average reductions occurred in D11 and D27, which were approximately perpendicular to the direction of movement. The maximum reductions were 4.3% (±11.6%) in D12 and 4.3% (±11.2%) in D27. The most severe reduction was at the coronal level.
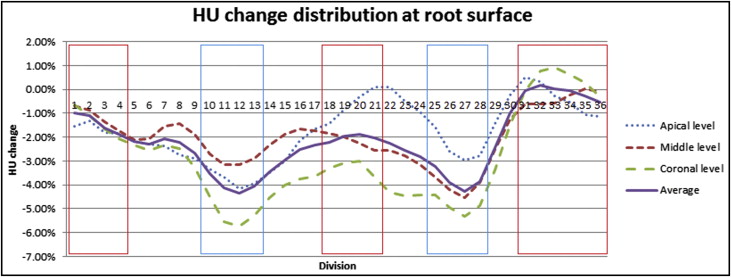
Without considering the level effect, the average division HU values in different color frames (blue and red) were significantly different ( P <0.05), as seen in Figure 3 . The HU was reduced more in D10 to D13 and D25 to D28, than in D31 to D4 and D18 to D21.
Within the specific canine displacement directions, the reductions varied among the levels. Comparing the average HU values among the 3 levels, no significant differences ( P = 0.3) were observed. However, the reductions among the 3 levels in the directions of D11 to D13 and D19 to D28 were significantly different ( P <0.05).
We compared HU changes in root surface between the 2 strategies. Both strategies resulted in reductions of HUs in root surfaces. The 2 treatment strategies resulted in similar HU change patterns. No division showed a statistically significant difference between the translation and controlled tipping strategies ( Fig 4 ). There was no significant difference between the overall HU changes as well ( P = 0.32).
At each level, the HU reductions also had no significant differences between the 2 strategies ( P = 0.61 for the apical level, P = 0.29 for the middle level, and P = 0.29 for the coronal level). Considering the effects of levels on the HUs in each strategy, there were no significant differences among the levels for controlled tipping ( P = 0.47) or translation ( P = 0.24).
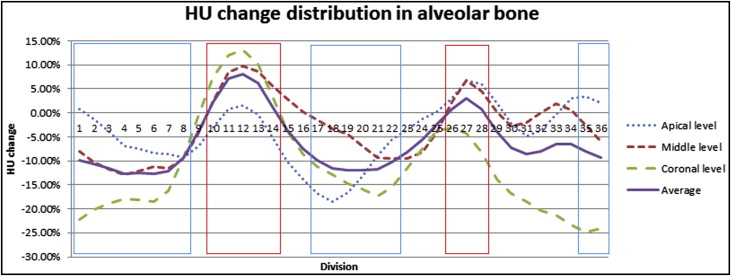
We used the combined data from the 2 strategies to determine HU changes in surrounding alveolar bone. The average HU changes in the 3 levels in the surrounding alveolar bone from the canine retractions are shown in Figure 5 . The HUs on the surrounding alveolar bone decreased in most directions. The average division HUs were reduced by 4.2% (±26.3%), 3.0% (±27.7%), and 11.0% (±28.5%) at the apical, middle, and coronal levels, respectively. At each level, the maximum reductions occurred in D6 and D20, which were closely aligned to the tooth’s movement direction. The maximum reductions were 12.7% (±28.6%) in D6 and 12.0% (±33.7%) in D20. The maximum average increases occurred in D12 and D27, which were approximately perpendicular to the direction of movement. The increases were about 8.1% (±27.4%) in D12 and 3.1% (±25.4%) in D27.