Introduction
The purpose of this article was to histologically evaluate root resorption and repair after orthodontic intrusion with different force magnitudes and fixed anchorage.
Methods
A randomized split-mouth repeated-measure design was used. Intrusive forces were applied for 98 days to the mandibular second, third, and fourth premolars of 8 mature beagle dogs. Two miniscrew implants were used as anchorage to apply constant intrusive forces of 50, 100, or 200 g per tooth. Demineralized sections of each tooth were stained and histologically studied for root resorption. Multilevel statistical procedures were used to evaluate the results.
Results
Root resorption was present in all teeth, independent of the force applied. Significant differences were found between root regions, with the apices and the interradicular regions the most affected and with dentin involvement at the furcation. There was cementum repair in 24.14% of the lacunae. Light constant intrusive forces between 50 and 200 g showed no significant differences in the amount of resorption produced. Resorption was more frequently seen at the level of the apices and the furcation.
Conclusions
Orthodontically induced root resorption is not clinically significant after application of continuous intrusive forces between 50 and 200 g. Moreover, there is no relationship between root resorption, the position of posterior mandibular teeth in the arch, and the amount of intrusive force applied.
External apical root resorption appears to be a common occurrence associated with orthodontic tooth movement. However, some apical root resorption can occur in patients who have never had orthodontic tooth movement. It appears that intrusive tooth movement might be the greatest factor for causing root resorption. Root resorption is still an unpredictable, unavoidable, and undesirable side effect of orthodontic treatment requiring tooth intrusion. Certain factors causing root resorption have been identified. Force application is such a factor in root resorption. It is thus important to understand the range of optimum force levels for physiologic intrusive movements to avoid damaging the periodontal ligament (PDL), roots, and alveolar bone structures. The most important force factors are duration of force application, amount of force applied, and type of force (constant vs intermittent) applied.
Treatment time and amount of tooth movement have been associated with root resorption and intrusion. Some authors have reported a positive correlation between the duration of intrusive treatment and root resorption, whereas others found no such relationship. In studies of effects of heavier vs lighter intrusive force levels on root resorption, it was reported that application of heavier rather than lighter intrusive forces tended to create more root resorption, although teeth not subjected to intrusive force also showed resorption craters. Other studies reported no significant differences between heavier and lighter forces. Intrusive movements produced with continuous forces have been shown to cause significantly more root resorption than discontinuous forces, although all studies do not support this relationship. The only consistent findings were wide individual variations of responses.
Independent of the force applied, orthodontic intrusive forces are concentrated at the tooth furcations and apices, increasing the risk of root resorption at these sites. Root resorption at these sites is especially prevalent in patients with a genetic predisposition to resorption. This resorption can be exacerbated by longer force duration, resulting in greater root resorption in the apical and interradicular regions, compared with shorter force application.
The relationship between the amount of force applied and the degree of root resorption remains controversial because of the various devices used to apply intrusive forces. Most devices cannot produce pure intrusive movements or control the amounts of force applied. The use of miniscrew implants (MSIs) has increased orthodontic treatment options and improved treatment outcomes, most probably as a result of the ability to obtain absolute anchorage and apply constant forces through these bone-anchorage devices. MSI anchorage eliminates the unwanted side effects normally associated with conventional approaches and allows for the correction of certain malocclusions previously treated with maxillofacial surgery, but with less dependence on patient compliance. MSIs are especially useful when intruding teeth because they make it possible to apply continuous force perpendicular to the long axis of the tooth.
Patient studies typically rely on radiographic evaluations to assess root resorption. However, comparisons of radiographic vs histologic evaluations have shown that the former failed to show root resorption that was identified histologically. The purpose of this study was to use the more sensitive histologic method to evaluate root resorption and repair of mandibular premolars after orthodontic intrusion with different force magnitudes by using MSIs. Decalcified histologic sections of the root apices, cervical regions, and furcations were examined to determine the effects of intrusive forces of different magnitudes on root resorption and repair in various regions of the teeth, as well as the response of teeth in different positions in the mandibular arch.
Material and methods
The teeth and surrounding tissues used in this study were from the mandibles of 8 mature beagle dogs, aged 20 to 24 months. The experimental design was fully described by Carrillo et al and approved by Baylor College of Dentistry Institutional Animal Care and Use Committee. The procedures and timeline of the investigation were performed in the same manner for each dog. Briefly, before each intervention and record-taking session, the animals were sedated with ketamine (2.2 mg per kilogram, intramuscularly) and xylazine (0.22 mg per kilogram, intramuscularly). While anesthetized, the animals’ vital signs were monitored and recorded by trained personnel. During the first intervention, the crowns of the mandibular second, third, and fourth premolars were prepared. Individual cast metal crowns were made for each tooth. During the second intervention, the cast metal crowns were cemented, and 2 MSIs were placed per tooth, 1 on the lingual surface and the other on the buccal surface. The buccal MSI was placed in the mesial interradicular bone, and the lingual MSI was placed in the distal interradicular bone of the teeth being intruded.
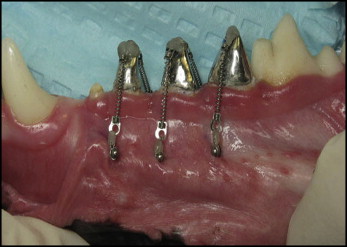
There were 2 randomly assigned force magnitudes for each contralateral pair of teeth: second premolars (50 and 100 g), third premolars (100 and 200 g), and fourth premolars (50 and 200 g). Forces were applied by using 2 Sentalloy (GAC International, Bohemia, NY) closed-coil springs (1 per MSI) attached with a 0.01-in stainless steel ligature ( Fig 1 ). Force levels were checked every 14 days by using a gram-force gauge (Correx, Haag-Streit, Koeniz, Switzerland) to ensure that they were maintained throughout the experiment. Records, including photographs, radiographs, force calibrations, and assessments of MSI stability, were taken after appliance activation and every 14 days thereafter until the dogs were killed at day 98.
The resected tissue blocks containing the teeth measured approximately 40 × 12 × 12 mm. After fixation in 10% buffered formalin, the tissues were washed thoroughly in gently running tap water to remove unbound fixative. They were then decalcified in 0.5 mol/L of ethylinediaminetetraacetic acid, tetrasodium salt (Sigma, St Louis, Mo), for varying periods of time, depending on their overall size. The tissues were radiographed every 2 weeks to monitor the decalcification process. When all the mineral salts had been removed, the mandibular blocks were cut with a surgical blade, stained on the mesial portion with a green margin marker (Davidson Marking System, Bradley Products, Bloomington, Minn) and, on the buccal surface, with a black margin marker (Staflab Medical Products, Lewisville, Tex). The specimens were then dehydrated with 70% alcohol, cleared, cut midsagittally to locate the pulp chamber, and infiltrated with paraffin in an automatic tissue processor (VIP model 2000, Miles Scientific, Elkhart, Iowa). Next, the tissues were embedded in paraffin blocks, which were hardened on a cold plate and sectioned at 6 to 9 μm. The sections were mounted on 1 × 3-in glass slides and dried on a warming tray at 42°C for approximately 2 hours. The sections were stained with hematoxylin and eosin, a few drops of Permount (Fisher Scientific, Pittsburgh, Penn) were placed on the slide, and a thin coverslip was applied to cover each section.
The histologic sections were examined under a light microscope (Axiophot, Zeiss, Petaluma, Calif) at 2.5 times magnification to identify 5 areas of interest: the mesial and distal aspects of the cervical part of the root, the furcation, and both root apices ( Fig 2 , A ). For each tooth, 1 histologic section for each region was measured. Since not all regions were present on the same slide, root resorption at each area was measured based on 1 to 5 histologic sections. Each area of interest was photographed at 10 times magnification (SPOT camera, Kodak, Rochester, NY) and stored as a JPEG digital image. An examiner (J.I.R.) blinded to the force groups and tooth positions performed all histologic registrations and histomorphometric analyses.
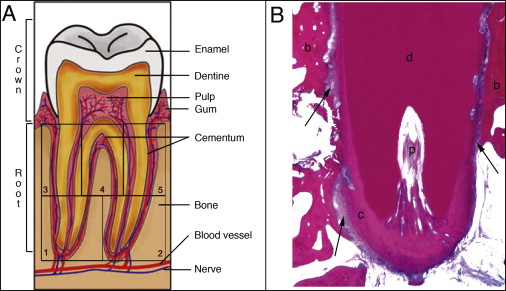
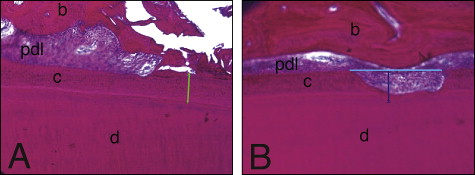
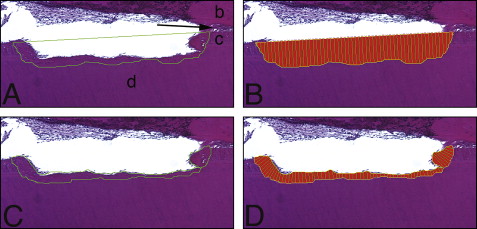
The lacunae measurements were taken at 10 times magnification by using Bioquant Osteo II software (version 8.11.20, Bioquant Image Analysis, Nashville, Tenn) that was calibrated (1 pixel ≈ 1 μm). Sections where the root apex canal was present were chosen to examine areas 1 and 2 ( Fig 2 ). Areas 3, 4, and 5 were measured from sections where the pulp chamber showed its greatest dimensions. Measurements included (1) the depth of each resorption lacuna from the deepest point visible, by using the distance from the bottom of the cavity perpendicular to the tangent passing through the borders of the resorption lacuna on the root surface ( Fig 3 , A ); (2) the width of each resorption lacuna by using a line connecting the highest points of the borders on either edge of the lacunae ( Fig 3 , A ); (3) the thickness of the intact cementum ( Fig 3 , B ); (4) the area of each resorption lacuna ( Fig 4 , A and B ); (5) the area of each lacuna repaired with bone or cellular cementum ( Fig 4 , C and D ), with the percentage of each lacuna repaired obtained by multiplying the lacuna area repaired by 100 divided by the total area of the lacuna; and (6) the percentages of cementum thickness affected by resorption by multiplying the lacunar height by 100, divided by the cementum thickness closest to that lacuna.
Statistical analysis
Multilevel statistical models take maximum advantage of repeated measures, allow for missing data, and make it possible to directly test the experimental effects. MLwiN software (version 2.01, Centre for Multilevel Modeling, Institute of Education, London, United Kingdom) was used to analyze the results. The effects of force, tooth site, and root zone on root resorption (lacuna number, lacuna width, lacuna depth, lacuna area, and percentages of cementum thickness and repair [area repaired and percentage of area repaired]) were evaluated in the fixed part of the model. The fixed part of the model estimated the effects and the differences between teeth and between regions of teeth. Random variations were partitioned into 4 hierarchical levels (zones, within teeth, within sides, within animals). Generalized least squares were used to estimate the effects. A significance level of P <0.05 was used for testing.
Results
Histology showed that, although 48 teeth were treated, several were processed incorrectly and lost to further study. Twenty-nine teeth were used. A normal anatomic bell-shaped cementum thickness was distributed along the root surfaces: cementum thickness was greatest at the apices and least at the cervical and interradicular regions ( Fig 5 ). The intact cementum was classified as acellular cementum, which provides attachment for the tooth.
Most resorption lacunae did not show evidence of repair ( Fig 6 ). Evidence of repair was seen in 24% of the lacuna evaluated; the area repaired was larger at the furcation than at the cervical region and the root apex ( Table I ). Repair of the resorption lacunae occurred almost exclusively with cellular cementum. PDL fibers were seen closely associated with the reparative cellular cementum in the lacunae ( Fig 7 ).
| Lacuna | Apex | Cervical difference |
Cervical | Furcation difference |
Furcation | Apex difference |
||||||
|---|---|---|---|---|---|---|---|---|---|---|---|---|
| Estimate | SE | Estimate | SE | Estimate | SE | Estimate | SE | Estimate | SE | Estimate | SE | |
| Area repaired (μm 2 ) | 32.16 | 11.89 | −33.85 | 17.00 | 9.2 | 17.28 | 36.42 | 17.19 | 39.81 | 16.65 | −3.41 | 16.7 |
| Area repaired (%) | 15 | 6 | −5 | 9 | 19 | 15 | 23 | 14 | 40 | 9 | −19 | 9 |
Evidence of ankylosis was detected in only 2 lacunae of 1 tooth exposed to 100 g of force and in 1 lacuna of a tooth exposed to a force of 50 g ( Fig 8 ). This represents 0.8% of the lacunae recorded.
Histomorphometry showed resorption lacunae in all specimens evaluated, affecting up to 66% of the cementum thickness at the apices and up to 29% at the cervical region; at the furcation, dentin involvement in the lacunae was observed. There was root resorption associated with intrusive movements in all teeth, independently of the forces applied. There also were no significant differences in resorption between tooth sites ( Table II ).The data in the tables reflect the differences between the regions being compared. There were no significant differences in root resorption between the mesial and distal apices, or between the mesial and distal cervical regions ( Table III ). Significant differences in root resorption were found between tooth regions. The numbers of lacunae were greater in the apex and furcation regions than in the cervical region. Lacunae depth and area were larger in the apical region than in the furcation region, which were in turn larger than in the cervical region. The percentages of cementum thickness were larger at the furcation than at the cervical region and the root apex ( Table IV ).
| Lacuna | Difference between | Difference between | Difference between | |||||||||
|---|---|---|---|---|---|---|---|---|---|---|---|---|
| Second premolar | Third premolar | Second premolar | Fourth premolar | Third premolar | Fourth premolar | |||||||
| Estimate | SE | Estimate | SE | Estimate | SE | Estimate | SE | Estimate | SE | Estimate | SE | |
| Number | 2.19 | 0.53 | 0.73 | 0.57 | 2.34 | 0.68 | 0.50 | 0.70 | 2.26 | 0.63 | 0.69 | 0.68 |
| Width (μm) | 506.10 | 47.73 | 0.26 | 49.03 | 488.09 | 59.56 | 35.21 | 49.60 | 477.64 | 51.67 | 13.81 | 50.64 |
| Depth (μm) | 67.97 | 8.90 | −2.60 | 8.36 | 59.90 | 10.27 | −4.44 | 11.02 | 53.98 | 10.12 | 7.10 | 10.67 |
| Area (μm 2 ) | 265.41 | 43.99 | −55.43 | 45.01 | 217.27 | 56.06 | −0.49 | 51.23 | 198.25 | 48.66 | 22.00 | 50.49 |
| Area repaired (μm 2 ) | 30.52 | 16.20 | 23.61 | 18.53 | 35.61 | 13.11 | −12.37 | 13.89 | 40.30 | 15.96 | −6.13 | 16.57 |
| Area repaired (%) | 23 | 9 | 8 | 11 | 27 | 8 | −8 | 9 | 26 | 9 | 2 | 9 |
| Cementum thickness (%) | 68 | 14 | 9 | 13 | 60 | 13 | 10 | 14 | 72 | 15 | 13 | 15 |
Stay updated, free dental videos. Join our Telegram channel
VIDEdental - Online dental courses


