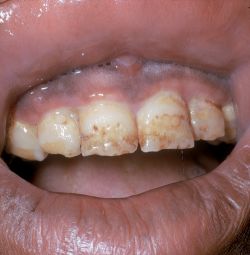
Fig. 16.2
Mottled enamel. (a) Severe mottling. Note the wear at the coronal edge of the central incisors, the brown color, and holes on the coronal half of the crowns and the opaque white color interspersed with brown spots on the apical half (Figure downloaded from The Free Dictionary http://img.tfd.com/mosby/thumbs/500087-fx12.jpg). (b) Mild mottling. Note the speckles of opaque white color on the labial surface of the central incisors. Other teeth may be similarly affected (Figure is a gift from Dr. Kenneth W. Stephens, University of Glasgow College of Dentistry)
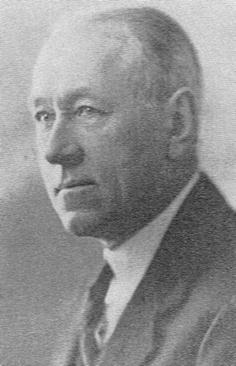
Fig. 16.1
Dr Frederick Sumner McKay (from “Obituary: Frederick Sumner McKay.” (1960) American Journal of Orthodontics 46(9): 695–699)
At the same time, McKay was informed of an outbreak of mottled enamel in children who lived in Bauxite, a town near Colorado Springs. Bauxite was named for large deposits of bauxite, which the Aluminum Company of America (ALCOA) mined there. Children who drank spring- or shallow-well water had normal teeth, but children drinking deep-well water had severe enamel mottling. In 1931, ALCOA’s chief chemist, Dr. Churchill, read McKay’s reports and ordered a test that identified trace elements in water using a new quartz spectroscope. The instrument identified fluoride in the deep wells only. McKay then obtained samples of drinking water from the many communities where he knew mottled enamel was found and Churchill confirmed the presence of fluoride. The association of fluoride with mottled enamel was published in the Scientific American in 1931.
Dr. H. Trendley Dean, a dental officer of the U.S. Public Health Service, advanced McKay’s findings, identifying various amounts of naturally occurring fluoride in the public water supplies from certain parts of the US (Fig. 16.3). By 1936, Dean had found that fluoride levels of up to 1.0 part per million (1 ppm=1 mg/L) in the drinking water did not cause mottling, or obvious dental fluorosis. More importantly, he also reported a correlation between the fluoride content of the water and a reduced incidence of dental decay. Community-wide studies were carried out to evaluate the effect of fluoride in the water supply on caries by adding sodium fluoride to fluoride-deficient water supplies. These studies began in Grand Rapids, Michigan, in 1945.
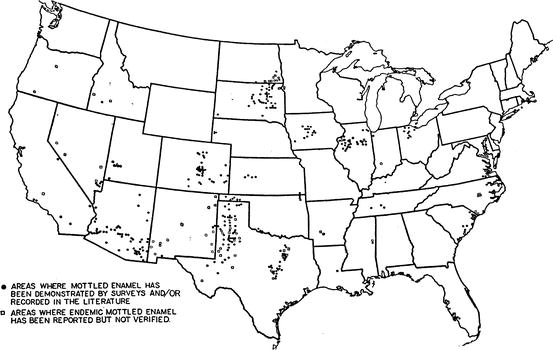
Fig. 16.3
Geographic location of mottled enamel in the US (1941) (Figure is a reproduction of Fig. 2 from Dean HT, Kitchin P, Moulton FR (eds) Fluorine and dental health. American Association of the Advancement of Science Publication No 19: Washington DC 1942 © AAAS 1942, pp. 6–11)
16.1.2 Mottled Enamel Is Moderate to Severe Enamel Fluorosis
Fluoride is both incorporated into enamel crystals and also affects the enzymes involved in enamel formation (Sect. 16.2.2), causing mottled enamel, a severe example of enamel fluorosis. Enamel fluorosis is evident as specks or white flecks on the enamel surface (Fig. 16.2b). In 1941, the public water supply of Aurora (IL) contained 1.2 ppm of fluoride (F), but only 5% of teeth exhibited fluorosis, mostly premolars and second molars. A sensitive index of fluorosis requires children aged 12–13 in whom the premolars and second molars have erupted. The mottled enamel first drawn to McKay’s attention in Colorado is moderate and severe fluorosis (Fig. 16.4).
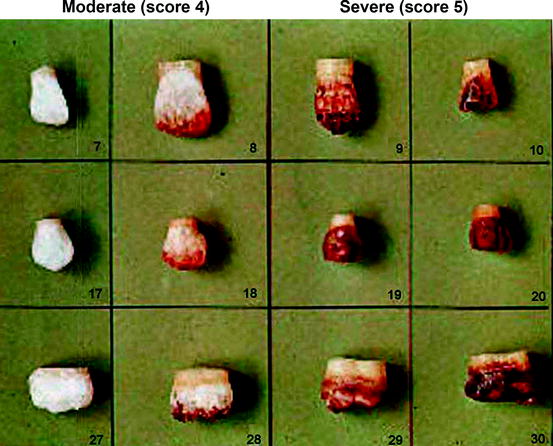
Fig. 16.4
Index of fluorosis. Figure depicts moderate to severe fluorosis of the lateral incisor, canine, and second molar teeth: index values of 4 and 5 (Copied from the University of Oklahoma Library Collection circa 1990, Source unknown)
The level of fluorosis in an individual is determined by observing the buccal surface of each tooth and classifying it as one of the following: Normal (score 0) Enamel presents the usual translucent, appearance. The surface is smooth, glossy, and usually of a pale creamy white color; Questionable (score 1) The enamel has slight aberrations from normal translucency, ranging from a few white flecks to occasional white spots; Very mild (score 2) Small, opaque, paper-white areas scattered over less than 25% of the tooth surface or a premolar or molar tooth showing no more than 2 mm of white opacity at the tip of the cusps; Mild (score 3) White opaque areas are discontinuous or a continuous white opacity affects less than 50% of the tooth surface (Central incisors in Fig. 16.1b); Moderate (score 4) More than 50% but not all of the enamel surface is affected with a continuous white opacity and little or no brown is present (Fig. 16.4); Severe (score 5); All of the enamel surface displays a continuous white opacity or more than half of the tooth surface is stained brown and surfaces are subject to mild attrition (Figs. 16.1a and 16.4). An individual is assigned a number (0 through 5) which represents two or more teeth with the greatest severity score. The index of fluorosis is the mean of these individual scores within a community.
16.1.3 Identification of 1 ppm Fluoride in the Water as Optimal for Cavity Protection
The greater the fluoride content of the public water supply, the greater is the index of fluorosis. At less than 1 ppm fluoride in the drinking water, the index of fluorosis in the community is essentially zero (no fluorosis) and increases to severe at 8–10 ppm fluoride in the drinking water. Fig. 16.5 illustrates how the severity of fluorosis changes with amount of fluoride in the community water supply and also the average number of decayed, missing, and filled teeth (DMFT, Sect. 15.1.1). The subjects were children aged 12–14 years in various US cities and communities and their DMFT is compared in Fig. 16.5 with the ppm fluoride in their water supply.
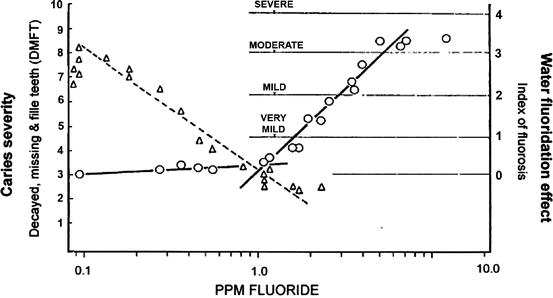
Fig. 16.5
Relationship of DMFT and index of fluorosis to water fluoride content. The left y-axis indicates the number of decayed missing and filled teeth from caries (DMFT) and the right y-axis indicates the index of fluorosis, a measure of the deleterious effect of fluoride on the enamel surface (see text). The x-axis indicates the ppm fluoride found naturally in the drinking water supply. Triangles indicate DMFT and circles indicate the fluorosis index in the same populations. The curves showing the decrease in caries and decrease in fluorosis intersect at ∼1 ppm fluoride in the water supply on the x-axis (Copy of Fig. 3 from Hodge HC, Smith FA. (1954). Some public health aspects of water fluoridation. American Association of the Advancement of Science Publication No 19: Washington DC 1954 © AAAS 1954, pp. 79–109)
If the water supply had no fluoride, the population displayed 6–8 DMFT. As the fluoride concentration increased to 1 ppm, the mean DMFT of the population decreased by about 50%, but the index of fluorosis remained well below 1. Increasing the fluoride above 1 ppm slightly decreased the DMFT further, but markedly increased the prevalence of fluorosis. The line of decreasing fluorosis intersects with the line of decreasing caries at just over 1 ppm fluoride as seen in the center of Fig. 16.5.
16.1.4 Summary
The fluoride ion can replace the hydroxide ion in a crystal without significantly altering its structure, an isomorphous ion replacement. Fluoride also affects the enzymes involved in enamel formation, causing mottled enamel, a severe example of enamel fluorosis. White opaque patches on the normally translucent enamel indicate mild fluorosis. Fluorosis is measured on a grade of 0–5 where 1 through 3 indicate an increased cover of opaque white patches on the tooth surface, and 4 and 5 indicate an increased mottling. The two worst affected teeth make up an individual’s score. The community’s index of fluoridation is the mean score for all individuals. As the natural or artificial fluoride concentration of the water supply increases to 1 ppm, the mean number of cavities in 10–12 year-old children decreases from 7 to 3. Above 1 ppm fluoride, caries does not decrease much more, but the index of fluorosis increases markedly. This is the reason why public water supplies are fluoridated to only 1 ppm and not more or less.
16.1.5 Mechanisms of Fluoride Protection from Caries
Stay updated, free dental videos. Join our Telegram channel
VIDEdental - Online dental courses


