Introduction
Our objectives were to compare different patterns of molar relationship changes from the mixed dentition to the permanent dentition and to discriminate the contributing dentoskeletal factors.
Methods
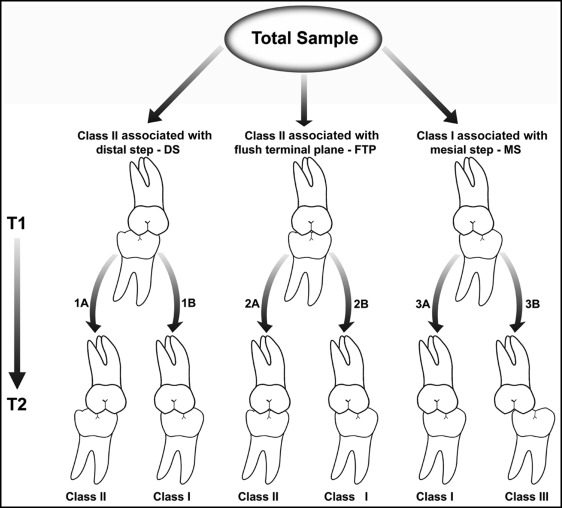
In this retrospective cohort study, we used a sample selected from 1212 untreated subjects who were longitudinally followed from the mixed to the permanent dentition. Eighty subjects (mean age, 8.69 years) had their right and left dental arch sides divided into 6 groups, according to molar relationship behavior: distal step kept in Class II (group 1A) or changed to Class I (group 1B); flush terminal plane kept in Class II (group 2A) or changed to Class I (group 2B); and mesial step kept in Class I (group 3A) or changed to Class III (group 3B). The groups were statistically evaluated at P <0.05.
Results
Class I and Class II defined by mesial and distal steps were stable. The flush terminal plane groups had a similar probability of maintaining the Class II relationship or changing to Class I. Groups 2A and 2B had significantly different changes in molar relationship, maxillary width, and mandibular skeletal traits as a whole. Class II maxillomandibular discrepancy, maxillary narrowing, and sagittal mandibular deficiency were the disadvantageous factors for favorable molar relationship adjustment.
Conclusions
Mesial and distal steps produced stable molar relationships from the mixed to the permanent dentition. There were 2 distinct dentoskeletal parameters of subjects with flush terminal planes regarding transverse maxillary and sagittal mandibular dimensions that should be diagnosed early to define the prognosis for molar relationship adjustment and orthodontic treatment need.
Graphical abstract
Highlights
- •
Molar relationship changes from the mixed to the permanent dentition were evaluated.
- •
Mesial and distal steps produced a stable relationship of the permanent first molars.
- •
Flush terminal plane produced the most unstable permanent first molar relationship.
- •
Leeway spaces were not a significant predictor of molar relationship change.
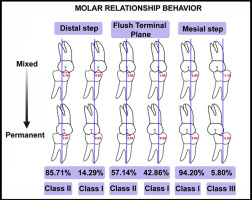
A Class I molar relationship is an essential requirement for normal static occlusion establishment when all the teeth mesial to the first molars are present, in addition to benefiting the functional occlusion. It is known that the initial molar relationship depends on the mesial step, flush terminal plane, or distal step of the deciduous second molars. A Class I relationship of the permanent first molars is established early in approximately 25% of children (mesial step/Class I), whereas 50% have a cusp-to-cusp relationship (flush terminal plane/half Class II), and the remaining 25% have a more severe distocclusion (distal step/Class II). However, this scenario is likely to change from the mixed to the permanent dentition, and over 50% of cusp-to-cusp children may self-adjust into a Class I molar relationship without orthodontic treatment. Subjects with distal step/Class II and mesial step/Class I seem to be more prone to keeping the initial molar relationship of the permanent first molars unchanged until the permanent dentition.
Although a cusp-to-cusp molar relationship has been considered a normal molar occlusion during the deciduous and mixed dentitions, it does not necessarily lead to a normal occlusion in the permanent dentition for many persons, and predicting molar relationship adjustment does not seem to be an easy task. Thus, clinicians involved in the management of young patients are usually concerned about when and in whom interceptive treatment is indicated. It has been suggested that greater mandibular anterior growth relative to the maxilla and greater leeway space in the mandibular arch compared with the maxillary arch are important skeletal and dental conditions to achieve a Class I molar relationship. However, it has been demonstrated that other dentoskeletal parameters should be considered if a more accurate prediction of molar relationship change is required. Transverse dimensions of the maxillary arch, although not directly associated with the sagittal plane, have been pointed out as contributing factors for molar relationship change, highlighting the complex and multifactorial characteristic of this dynamic process.
There is little scientific information about the dentoskeletal influence on different types of molar relationship changes during growth because some studies evaluated the changes in molar relationship in a descriptive way. Some studies focused only on the influence of dental variables, whereas others concentrated on the influence of skeletal parameters. Only one longitudinal study considered the dentoskeletal features, but the authors did not examine the different types of changes in molar relationships. Thus, the objective of our longitudinal investigation was to compare the dentoskeletal characteristics of groups with different patterns of molar relationship changes to discriminate the variables that significantly contribute to molar relationship changes in different ways from the mixed to the permanent dentition.
Material and methods
This project (25703) was approved by the research committee of the Faculty of Dentistry, Federal University of Rio Grande do Sul under protocol number 09/2013, and institutional review board approval was secured from the growth study centers for the use of records and retrospective data.
The sample was obtained from a pool of 1212 untreated subjects who were longitudinally followed during growth. They came from the files of the University of Michigan Growth Study (Ann Arbor) and the Bauru Dental School Growth Study in Brazil, where this study took place. The files of these growth study centers were searched to satisfy as closely as possible the minimum sample size in each group and the selection criteria. The sample size was calculated using the values of α (type I error) and β (type II error) at 5% and 20%, respectively, and the value of the variance of the measurements σ 2 (standard deviation) was based on previous studies. According to these factors, a sample with at least 21 subjects in each group was required.
Sample selection was based on the following inclusion criteria: completeness of longitudinal records, quality of orthodontic records, matched age of cephalogram and dental casts at each time (T1 and T2), early mixed dentition (T1) with all permanent incisors and first molars erupted, presence of all deciduous molars and canines, first record of early permanent dentition (T2) with all permanent teeth up to the second molars, and all premolars fully erupted to take into account the loss of leeway space. The exclusion criteria were early deciduous tooth loss, proximal caries with space loss, supernumerary teeth, dental anomaly of size or shape, and impacted canines.
The total sample included 80 subjects (36 girls, 44 boys) with initial age (T1), final age (T2), and observation period of 8.69 (± 0.83), 13.16 (± 1.22), and 4.47 (± 1.03) years, respectively. Twenty-seven subjects were from the University of São Paulo at Bauru, and 53 subjects were from the University of Michigan. The sample was divided into right and left dental arches and classified into 6 groups (1A, 1B, 2A, 2B, 3A, and 3B) according to molar relationship changes from the mixed (T1) to the permanent dentition (T2) on each side, as shown in Figure 1 . The initial age and sex distributions in each group are shown in Table I . The allocations to the groups depended on the judgments of 2 experienced examiners (S.E.B. and K.C.). Any disagreements were resolved by a weighted reevaluation to the satisfaction of both examiners.
| Variable | Group 1A (n = 30) | Group 1B (n = 5) | Group 2A (n = 24) | Group 2B (n = 32) | Group 3A (n = 65) | Group 3B (n = 4) | P ∗ | ||||||
|---|---|---|---|---|---|---|---|---|---|---|---|---|---|
| Mean | SD | Mean | SD | Mean | SD | Mean | SD | Mean | SD | Mean | SD | ||
| Age at T1 (y) | 8.63 | 0.86 | 8.95 | 1.70 | 8.45 | 0.79 | 8.73 | 0.78 | 8.76 | 0.79 | 8.79 | 0.24 | 0.520 † |
| Age at T2 (y) | 12.90 | 1.15 | 13.53 | 1.68 | 12.73 | 1.16 | 13.49 | 1.03 | 13.25 | 1.32 | 13.29 | 0.14 | 0.081 ‡ |
| Observation period (y) | 4.27 | 0.97 | 4.57 | 0.87 | 4.27 | 1.00 | 4.75 | 1.01 | 4.48 | 1.12 | 4.50 | 0.38 | 0.201 † |
| Sex | 63.33% M | 80.00% M | 45.83% M | 68.75% M | 46.15% M | 50.00% M | 0.106 § | ||||||
| 36.67% F | 20.00% F | 54.17% F | 31.25% F | 53.85% F | 50.00% F | ||||||||
Dental cast measurements were performed using a 0.01-mm precision digital caliper (Mitutoyo America, Aurora, Ill). Molar relationship was measured as the horizontal distance between the tip of mesiobuccal cusp of the maxillary permanent first molar to the mesiobuccal groove on the mandibular permanent first molar on each side. Canine relationship was determined by the horizontal distance between the cusp tip of the maxillary deciduous canine and the embrasure between the mandibular first molar and canine on each side. A positive value indicated a Class II direction for molar and canine relationships. Overjet was measured as the greatest horizontal distance between the labial surfaces of the maxillary and mandibular central incisors at the level of the maxillary incisor edge. Overbite was measured as the greatest vertical distance between the incisal edge of the mandibular incisor and the incisal edge of the maxillary central incisor horizontally projected on the labial surface of the mandibular incisor. Maxillary canine width was the distance between the cusp tips of the maxillary canines. Maxillary molar width was defined as the distance between the cusp tips of the mesiobuccal cusps of the maxillary permanent first molars. Leeway space was calculated as the differential size between the deciduous canine and first and second molars vs the permanent canine and first and second premolars. Arch length discrepancy was calculated as the difference between arch length and the mesiodistal crown width of all permanent teeth mesial to the first molars. Lastly, the differential size between the maxillary and mandibular deciduous second molars on each side was calculated.
Lateral headfilms were obtained in centric occlusion with passive lip posture. Cephalometric tracings were made by one investigator (K.C.) and checked for landmarks and outlines of the anatomic structures by a second examiner (S.E.B.). Cephalograms were digitized, and the data were analyzed with Radiocef Studio 2 software (version 2.0; release 12.82; Belo Horizonte, Minas Gerais, Brazil). A customized cephalometric analysis including dental and skeletal measurements from known analyses—Steiner, Tweed, Ricketts, and McNamara —was used, totaling 21 variables (12 angular, 8 linear, and 1 ratio) for each tracing. The lateral headfilms from the University of Michigan and the University of São Paulo at Bauru had different magnifications (12.9% and 6%) that were corrected with the cephalometric software. Data collection started in March and finished in July 2013.
To evaluate the study error, 22 pairs of dental casts were remeasured, and lateral headfilms were retraced and redigitized by the same examiners (S.E.B. and K.C.). Agreement between repeated measurements of each variable (reliability) was evaluated with the method described by Bland and Altman. Bias was computed as the average of the differences between 2 determinations of the same variable. Calculation of the limits of agreement during the Bland-Altman analysis provided limits that contained 95% of the differences.
Statistical analyses
Descriptive statistics for the dental cast and cephalometric measurements were calculated for each group. Because several variables did not show a normal distribution for all the groups and observation phases, the comparisons were performed using parametric or nonparametric statistical tests according to the results from the Shapiro-Wilk normality tests. Groups 1B and 3B were not included in the comparisons because their sample sizes were far below what was needed to keep the power of this study at 80% with α = 0.05.
The comparability of the groups regarding initial and final ages, observation period, and sex distribution was evaluated with analysis of variance (ANOVA), Kruskal-Wallis test, and χ 2 tests, respectively. Molar relationships at T1 and T2 were compared in the total sample with Wilcoxon tests. The rate of change in molar relationship status from T1 to T2 was evaluated using the Z-tests on proportions.
The intergroup differences regarding dental cast and cephalometric variables were evaluated at T1, T2, and T1-T2 using parametric (ANOVA) or nonparametric tests (Kruskal-Wallis, followed by Tukey post-hoc tests).
A multiple linear regression analysis was performed with the molar relationship change (T1-T2) as the dependent variable and the dental cast and cephalometric parameters with significant intergroup differences at T1 and T1-T2 as the independent variables. The goal of this analysis was to evaluate whether the difference among groups regarding molar relationship changes and dentoskeletal parameters at T1 and T1-T2 were related.
Based on the regression analysis results, it was thought that comparisons of molar relationship changes between subjects with similar occlusal Class II severity and different degrees of mandibular anterior positioning could show significant differences (Mann-Whitney and t tests).
Statistical analyses were performed with Statistica for Windows software (version 7.0; StatSoft, Tulsa, Okla). The results were considered statistically significant at P <0.05.
Results
Using the Bland-Altman agreement approach, overjet and SNA angle were the dental cast and cephalometric variables with the smallest bias (ie, the mean difference between repeated measurements: −0.02 and 0.01), whereas the difference between mandibular and maxillary arch length discrepancy and LAFH/PFH had the greatest dental cast and cephalometric bias (0.13 and 0.40). The difference between maxillary and mandibular deciduous second molar widths and ANB angle were the dental cast and cephalometric variables with the narrowest 95% agreement intervals (0.83 and 1.75), whereas maxillary intercanine width and mandibular central incisor.NB had the widest dental cast and cephalometric agreement intervals (1.93 and 3.90). In general, the dental cast variables had smaller biases and narrower agreement intervals than did the cephalometric variables. The groups had similar initial and final ages, observation periods, and sex distributions ( Table I ).
The molar relationship changed on average by 1 mm toward Class I in the total sample ( Table II ). The mesial step was the most frequent terminal relationship of the deciduous second molars in the mixed dentition, which produced an early and stable Class I relationship of the permanent first molars ( Table II ). The flush terminal plane produced the least stable permanent first molar relationship, with a similar probability of remaining in Class II or changing to Class I ( Table II ). The distal step showed a smaller occurrence, and the Class II molar relationship associated with these subjects was practically as stable as the Class I produced by the mesial step ( Table II ).
| Molar relationship, T1 2.01 mm ± 1.85 (n = 160) |
Molar relationship, T2 0.99 mm ± 1.28 (n = 160) |
P <0.001 ∗ , † |
||
|---|---|---|---|---|
| Class I | Class II | Class III | ||
| Mesial step n = 69 (43.12%) | n = 65 (94.20%) Stable | n = 0 | n = 4 (5.80%) Change | <0.001 ∗ , ‡ |
| Flush terminal plane n = 56 (35%) | n = 32 (57.14%) Change | n = 24 (42.86%) Stable | n = 0 | 0.294 ‡ |
| Distal step n = 35 (21.88%) | n = 5 (14.29%) Change | n = 30 (85.71%) Stable | n = 0 | 0.001 ∗ , ‡ |
∗ Statistically significant difference.
Initial molar and canine relationships were similar between groups 2A and 2B and significantly different for other intergroup comparisons. Groups 2A and 2B had less severe Class II relationships, with intermediate values between groups 1A and 3A ( Table III , Fig 2 ). Overjet was similar between groups 2A and 2B, with intermediate values between groups 1A and 3A. In general, groups 3A and 2B had significantly wider maxillary arches than did group 1A, and 2B had wider intermolar widths than did 2A ( Table III ). The mandible was more anteriorly positioned in groups 3A and 2B, and it was consequently more retruded for 2A and 1A, with significant differences between the extremes ( Table III ). Unsurprisingly, the maxillomandibular discrepancy increased following this same sequence with significant differences between group 3A and groups 1A and 2A ( Table III ).
| Variable | Group 1A (n = 30) | Group 2A (n = 24) | Group 2B (n = 32) | Group 3A (n = 65) | P | ||||
|---|---|---|---|---|---|---|---|---|---|
| Mean | SD | Mean | SD | Mean | SD | Mean | SD | ||
| Dental cast variables (mm) | |||||||||
| Molar relationship | 4.76 a | 1.10 | 2.56 b | 0.55 | 1.89 b | 0.61 | 0.58 c | 0.75 | <0.001 ∗ , † |
| Canine relationship | 3.52 a | 1.06 | 1.60 b | 0.51 | 1.19 b | 0.76 | 0.27 c | 0.62 | <0.001 ∗ , † |
| Overjet | 6.55 a | 2.41 | 5.12 ab | 1.90 | 4.32 bc | 1.45 | 3.55 c | 1.42 | <0.001 ∗ , † |
| Overbite | 2.73 | 2.78 | 2.42 | 2.19 | 3.33 | 1.72 | 2.20 | 1.69 | 0.145 † |
| Maxillary width (first molars) | 48.26 a | 2.65 | 48.48 ab | 2.44 | 50.21 c | 2.08 | 49.62 bc | 2.35 | 0.003 ∗ , ‡ |
| Maxillary width (canines) | 31.35 a | 1.94 | 31.97 ab | 1.54 | 32.76 b | 2.19 | 32.72 b | 1.80 | 0.004 ∗ , † |
| Maxillary leeway space | 0.56 | 0.90 | 0.43 | 0.99 | 0.58 | 0.83 | 0.80 | 1.12 | 0.284 † |
| Mandibular leeway space | 1.95 | 0.98 | 1.95 | 0.90 | 2.06 | 1.07 | 1.89 | 1.20 | 0.910 ‡ |
| Leeway space difference (Md – Mx) | 1.38 | 0.69 | 1.51 | 0.63 | 1.48 | 0.73 | 1.08 | 1.01 | 0.063 ‡ |
| Maxillary arch length discrepancy | 1.56 | 2.35 | 2.20 | 2.35 | 1.32 | 1.51 | 2.19 | 2.23 | 0.202 ‡ |
| Mandibular arch length discrepancy | 1.20 | 2.94 | 2.13 | 1.86 | 1.83 | 1.37 | 2.21 | 1.86 | 0.888 † |
| Difference between arch length discrepancy (Md – Mx) | −0.35 | 3.40 | −0.06 | 2.50 | 0.51 | 1.86 | 0.01 | 1.63 | 0.559 † |
| Deciduous second molar width difference (Md – Mx) | 1.02 | 0.35 | 1.05 | 0.33 | 1.14 | 0.41 | 0.96 | 0.42 | 0.468 † |
| Cephalometric variables | |||||||||
| Maxillary skeletal components | |||||||||
| SNA (°) | 79.97 | 2.58 | 80.02 | 2.77 | 80.64 | 2.26 | 80.25 | 2.79 | 0.684 ‡ |
| A-N perp (mm) | −0.41 | 2.59 | −0.32 | 2.21 | −0.09 | 1.34 | 0.25 | 2.09 | 0.442 † |
| CoA(mm) | 80.50 | 3.59 | 80.37 | 6.25 | 80.91 | 3.18 | 79.30 | 3.94 | 0.197 † |
| Mandibular skeletal components | |||||||||
| SNB angle (°) | 74.59 a | 2.70 | 75.27 a | 2.68 | 76.37 ab | 2.72 | 76.89 b | 2.39 | <0.001 ∗ , † |
| SND angle (°) | 71.67 a | 2.57 | 72.31 ab | 2.60 | 73.48 ab | 2.59 | 73.67 b | 2.56 | 0.006 ∗ , † |
| P-N perp (mm) | −8.22 a | 4.28 | −7.16 a | 4.48 | −5.86 ab | 4.25 | −4.26 b | 3.47 | <0.001 ∗ , ‡ |
| CoGn (mm) | 98.32 | 4.15 | 98.95 | 8.06 | 99.84 | 3.72 | 99.84 | 5.76 | 0.223 † |
| Co-Go (mm) | 45.94 | 2.65 | 45.96 | 3.57 | 46.93 | 3.03 | 46.83 | 3.60 | 0.346 † |
| Go-Gn (mm) | 63.66 | 3.55 | 64.84 | 5.76 | 65.49 | 2.50 | 64.81 | 3.90 | 0.328 † |
| Maxillomandibular relationship | |||||||||
| ANB angle (°) | 5.38 a | 2.57 | 4.76 a | 1.93 | 4.26 ab | 1.75 | 3.36 b | 2.31 | <0.001 ∗ , ‡ |
| Growth pattern | |||||||||
| SN.GoGn (°) | 35.12 | 4.24 | 34.63 | 4.22 | 32.63 | 5.29 | 33.94 | 3.69 | 0.326 † |
| BaN.PtGn (°) | −2.67 | 3.31 | −1.70 | 3.10 | −2.07 | 3.70 | −1.72 | 3.93 | 0.409 † |
| SN.PP (°) | 6.92 | 2.91 | 7.76 | 2.37 | 6.99 | 2.86 | 7.84 | 2.48 | 0.424 † |
| FH.MP (°) | 27.43 | 3.93 | 26.93 | 3.26 | 25.50 | 4.91 | 25.95 | 3.56 | 0.140 † |
| LAFH/PFH (%) | 94.88 | 6.29 | 93.84 | 6.31 | 91.16 | 7.71 | 92.10 | 7.06 | 0.135 ‡ |
| Maxillary dentoalveolar components | |||||||||
| Maxillary central incisor-NA (mm) | 3.50 | 2.40 | 3.75 | 1.73 | 3.03 | 1.90 | 4.08 | 1.69 | 0.061 † |
| Maxillary central incisor.NA (°) | 24.58 | 7.66 | 25.45 | 5.38 | 22.74 | 5.22 | 26.09 | 5.81 | 0.081 ‡ |
| Maxillary central incisor.SN (°) | 104.56 | 6.39 | 105.48 | 5.41 | 103.38 | 5.56 | 106.35 | 5.27 | 0.092 ‡ |
| Mandibular dentoalveolar components | |||||||||
| Mandibular central incisor-NB (mm) | 4.34 | 1.47 | 4.97 | 1.87 | 4.19 | 2.11 | 4.69 | 2.28 | 0.260 † |
| Maxillary central incisor.NB (°) | 26.07 | 3.72 | 26.83 | 4.55 | 25.69 | 8.17 | 26.19 | 6.09 | 0.630 † |
| IMPA (°) | 96.35 | 3.01 | 96.93 | 4.63 | 96.69 | 7.79 | 95.35 | 5.25 | 0.459 † |
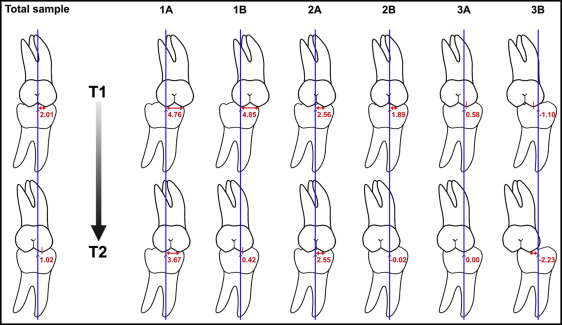
After the observation period, group 2B showed a Class I relationship similar to group 3A, because molar relationship change was significantly greater in group 2B ( Tables IV and V ) . The initial Class II of groups 1A and 2A was not autocorrected and remained more severe in group 1A than in 2A, although not significantly ( Tables IV and V , Fig 2 ). In general, group 2B had the widest maxillary arch in T2. Groups 2B and 2A had maximum and minimum increases in maxillary arch widths, respectively, with significant differences between them ( Tables IV and V ).
| Variable | Group 1A (n = 30) | Group 2A (n = 24) | Group 2B (n = 32) | Group 3A (n = 65) | P | ||||
|---|---|---|---|---|---|---|---|---|---|
| Mean | SD | Mean | SD | Mean | SD | Mean | SD | ||
| Dental cast variables (mm) | |||||||||
| Molar relationship | 3.67 a | 1.39 | 2.55 a | 0.90 | −0.02 b | 0.90 | 0.00 b | 0.85 | <0.001 ∗ , † |
| Overjet | 6.12 a | 1.88 | 5.15 a | 1.93 | 3.84 b | 1.13 | 3.44 b | 1.33 | <0.001 ∗ , † |
| Overbite | 4.33 | 1.98 | 3.96 | 1.43 | 4.27 | 1.45 | 3.53 | 1.26 | 0.052 ‡ |
| Maxillary width (first molars) | 49.63 a | 2.95 | 49.12 a | 2.79 | 51.81 b | 2.01 | 51.08 b | 2.38 | <0.001 ∗ , ‡ |
| Maxillary width (canines) | 33.83 a | 1.79 | 33.10 a | 1.48 | 35.21 b | 2.18 | 34.08 a | 1.78 | <0.001 ∗ , ‡ |
| Maxillary arch length discrepancy | 1.04 | 1.72 | 1.09 | 2.02 | 1.07 | 1.37 | 1.75 | 1.99 | 0.308 † |
| Mandibular arch length discrepancy | 1.04 | 1.66 | 0.23 | 1.68 | 0.14 | 1.22 | 0.65 | 1.85 | 0.630 † |
| Difference between arch length discrepancy (Md – Mx) | −0.003 | 2.24 | −0.86 | 2.20 | −0.92 | 1.14 | −1.10 | 1.43 | 0.982 † |
| Cephalometric variables | |||||||||
| Maxillary skeletal components | |||||||||
| SNA angle (°) | 79.94 | 3.47 | 80.17 | 2.91 | 81.44 | 2.91 | 81.19 | 2.93 | 0.118 † |
| A-N perp (mm) | 0.45 | 3.54 | −0.24 | 2.25 | 0.94 | 2.51 | 0.82 | 2.15 | 0.294 ‡ |
| CoA (mm) | 86.38 ab | 4.78 | 84.02 a | 2.82 | 87.37 b | 4.33 | 84.98 ab | 3.78 | 0.028 ∗ , † |
| Mandibular skeletal components | |||||||||
| SNB angle (°) | 75.53 a | 3.42 | 76.12 a | 2.96 | 78.59 b | 2.84 | 78.27 b | 2.79 | <0.001 ∗ , ‡ |
| SND angle (°) | 73.34 a | 3.45 | 73.56 a | 2.89 | 76.12 b | 2.78 | 75.66 b | 3.01 | <0.001 ∗, ‡ |
| P-N perp (mm) | −4.69 a | 5.69 | −5.55 a | 4.93 | −1.30 b | 3.87 | −2.15 b | 4.87 | <0.001 ∗ , † |
| CoGn (mm) | 108.91 ab | 5.57 | 105.20 a | 4.35 | 112.30 b | 5.95 | 109.07 b | 5.66 | <0.001 ∗ , † |
| Co-Go (mm) | 51.89 ab | 4.87 | 49.52 a | 3.75 | 54.04 b | 3.96 | 51.64 ab | 4.01 | 0.001 ∗ , † |
| Go-Gn (mm) | 70.54 ab | 3.86 | 69.28 a | 2.85 | 73.76 b | 4.50 | 71.39 ab | 4.53 | 0.005 ∗ , † |
| Maxillomandibular relationship | |||||||||
| ANB angle (°) | 4.40 a | 2.41 | 4.05 ab | 1.76 | 2.85 b | 2.23 | 2.91 b | 2.40 | 0.005 ∗ , † |
| Growth pattern | |||||||||
| SN.GoGn (°) | 34.12 a | 4.91 | 33.21 ab | 4.74 | 30.80 b | 4.88 | 32.62 ab | 4.18 | 0.014 ∗ , † |
| BaN.PtGn (°) | −2.38 | 4.21 | −1.06 | 3.33 | −0.77 | 4.03 | −0.96 | 4.09 | 0.152 † |
| SN.PP (°) | 7.68 | 3.35 | 8.22 | 2.47 | 7.23 | 3.16 | 8.31 | 2.71 | 0.332 ‡ |
| FH.MP (°) | 25.54 | 4.66 | 25.56 | 3.38 | 23.25 | 4.16 | 24.91 | 4.26 | 0.063 † |
| LAFH/PFH (%) | 91.15 | 6.48 | 89.97 | 6.61 | 86.57 | 6.59 | 88.57 | 7.62 | 0.068 ‡ |
| Maxillary dentoalveolar components | |||||||||
| Maxillary central incisor-NA (mm) | 4.63 | 2.61 | 4.74 | 1.92 | 4.19 | 2.10 | 4.51 | 1.52 | 0.733 ‡ |
| Maxillary central incisor.NA (°) | 23.27 | 6.38 | 24.51 | 5.94 | 22.37 | 5.48 | 23.56 | 4.80 | 0.721 † |
| Maxillary central incisor.SN (°) | 103.22 | 5.07 | 104.69 | 6.16 | 103.82 | 5.84 | 104.76 | 5.09 | 0.531 † |
| Mandibular dentoalveolar components | |||||||||
| Mandibular central incisor-NB (mm) | 4.96 | 1.97 | 5.06 | 1.70 | 4.51 | 2.50 | 4.90 | 2.88 | 0.610 † |
| Mandibular central incisor.NB (°) | 25.77 | 4.74 | 26.82 | 5.22 | 25.19 | 8.07 | 25.93 | 7.30 | 0.598 † |
| IMPA (°) | 96.10 | 4.74 | 97.48 | 5.84 | 95.79 | 7.93 | 95.03 | 6.61 | 0.294 † |
Stay updated, free dental videos. Join our Telegram channel
VIDEdental - Online dental courses


