Introduction
The purposes of this study were to evaluate the facial soft-tissue thicknesses and craniofacial morphologies of patients affected by bilateral cleft lip and palate (BCLP) and to compare the findings with a well-matched control group without any clefts using cone-beam computed tomography.
Methods
The study sample consisted of 40 retrospectively and randomly selected patients divided into 2 groups: a BCLP group (20 patients; mean age, 13.78 ± 3.20 years) and an age- and sex-matched control group without clefts (20 patients; mean age, 13.94 ± 2.52 years). Craniofacial and facial soft-tissue thickness measurements were made with cone-beam computed tomography. The Student t test and multiple linear regression analyses were performed for the statistical evaluations.
Results
The BCLP group had an increased SN-MP angle ( P = 0.003), a decreased Co-A ( P = 0.000), and retruded maxillary ( P = 0.000) and mandibular ( P = 0.026) incisors. In addition, patients affected by BCLP had statistically significantly decreased thickness measurements for the variables subnasale ( P = 0.005) and labrale superior ( P = 0.026) compared with the controls. The most predictive variables were found at U1-SN (r = 0.417, P = 0.004), IMPA (r = 0.368, P = 0.010), and ANB (r = −0.297, P = 0.031) for subnasale and U1-SN (r = 0.284, P = 0.038) for labrale superior.
Conclusions
The BCLP group showed greater vertical growth, greater retrusion of the maxilla and the maxillary and mandibular incisors, and decreased subnasale and labrale superior thicknesses compared with the well-matched controls without clefts. These differences should be taken into account when planning orthodontic and orthognathic surgery treatment for those patients.
Highlights
- •
The BCLP group had an increased SN-MP angle, a decreased Co-A, and retruded incisors.
- •
No differences were found between the sexes for the soft-tissue thickness values.
- •
The BCLP group had significantly decreased subnasale and labrale superior thicknesses.
- •
The predictive variables were U1-SN, IMPA, and ANB for subnasale and labrale superior.
Assessment of the soft tissues in patients undergoing orthodontic treatment or corrective jaw surgery plays a crucial role in both diagnosis and treatment planning. Both hard-tissue and soft-tissue morphologies of the patients to be orthodontically treated should be considered in establishing harmonious facial esthetics and an optimal functional occlusion.
Cleft lip and palate (CLP) is a common congenital craniofacial anomaly with a multifactorial etiology. CLP leads to various problems with feeding, hearing, speaking, and dentofacial development; thus, patients affected by CLP should be treated by a multidisciplinary team approach with good interaction among the different specialties. Patients affected by CLP generally have anterior and posterior crossbites and maxillary deficiency with a tendency toward a Class III malocclusion. It appears that the scarring produced by the primary surgical repair is a major etiologic factor for the maxillary deficiency.
A favorable facial morphology is a key aspect of treatment outcome in patients affected by CLP, and the role of orthodontists for these patients’ treatment is substantial, particularly in the improvement of their facial esthetics and dental occlusion. In the literature, several studies have assessed the hard-tissue and soft-tissue morphologies of patients affected by unilateral CLP. However, this topic was almost neglected for patients affected by bilateral CLP (BCLP), probably because of the low frequency of BCLP occurrence. In a recent study, Hasanzadeh et al, who assessed the facial soft-tissue morphology of adolescent patients affected by BCLP using conventional cephalometric lateral films, reported that they had several facial soft-tissue deformities compared with the matched control group.
To the best of our knowledge, no previous study has investigated the facial soft-tissue thickness of patients affected by BCLP using cone-beam computed tomography (CBCT). Since differences after orthognathic surgery in the soft-tissue responses between patients with thick and thin soft tissues were previously reported, it is important to evaluate the facial soft-tissue thickness of patients affected by BCLP before orthodontic and orthognathic treatment. Therefore, the aims of this study were to assess the facial soft-tissue thicknesses and craniofacial morphologies of patients affected by BCLP and to compare the findings with well-matched controls without clefts using CBCT. Additionally, the effects of some craniofacial measurements on soft-tissue thickness were investigated with multiple linear regression models.
Material and methods
The CBCT images used in this study were part of the diagnostic records collected to determine dental and orthodontic treatment needs at the Departments of Oral and Maxillofacial Radiology and Orthodontics at Erciyes University in Kayseri, Turkey. The patients and their parents had signed an informed consent form allowing their data to be used for scientific purposes, and the study was approved by the ethical committee of Erciyes University. CBCT images had been taken for orthognathic surgery planning, airway assessment, and cleft presence in cleft group, whereas the reasons for the control group had been impacted tooth localization, temporomandibular joint disorders, and airway assessments. No patient was contacted and no CBCT image was taken for the purpose of this retrospective study.
Sample calculation of the study was based on a formula, a significance level of 0.05, and a power of 80% to detect a difference of 1.4 mm (±1.5 mm) for subnasale thickness (distance from Point A to subnasale) between the groups using the findings of Liu et al. The power analysis showed that 18 patients were needed in each group. To increase the power of the study, the study group included 20 patients affected by BCLP (8 female, 12 male; mean age, 13.78 ± 3.20 years; range, 8-20 years) who had no other syndrome or congenital anomaly and had the same surgical procedure (lip and hard-tissue closure) before 3 years of age. The control group included 20 patients (8 female, 12 male; mean age, 13.94 ± 2.52 years; range, 8-20 years) with normal sagittal and vertical growth patterns without clefts, other syndromes, or congenital anomalies. No patient in either group had previous orthognathic surgery, pharyngeal flap for velopharyngeal insufficiency, orthodontic treatment, prosthodontic restoration, and a body mass index higher than 28. All patients had the same ethnic and racial origin.
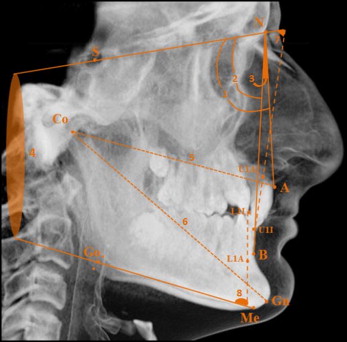
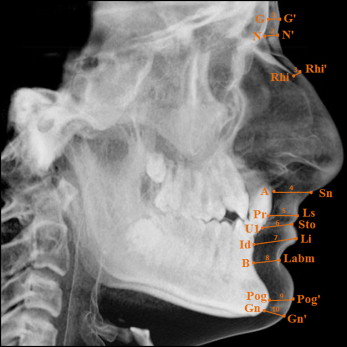
The CBCT images were obtained in a standard supine position (scanning time, 14-18 seconds; collimation height, 13 cm; exposure time, 3.6 seconds; voxel size, 0.3 mm 3 ) on the same device (NewTom 5G; QR, Verona, Italy). Simplant Pro software (version 13.0; Materialise, Leuven, Belgium) was used to perform craniofacial (SNA, SNB, ANB, SN-MP, Co-A, CoGn, U1-SN, and IMPA) and facial soft-tissue thickness (glabella, nasion, rhinion, subnasale, labrale superior, stomion, labrale inferior, labiomental, pogonion, and gnathion) measurements ( Figs 1 and 2 ) on the cephalometric lateral radiographs obtained from CBCT images. The definitions of the soft-tissue thickness measurements were previously described in the literature. All measurements were performed in a blinded manner by 1 author (S.K.B.) randomly.
Statistical analysis
To determine the random error, 15 radiographs were selected randomly. The same author made all measurements 2 weeks after the first examination without knowing the first measurements. Intraclass correlation coefficients (ICCs), calculated to assess the reliability of the measurements, showed that the ICC values were above 0.913, confirming the reliability. In addition, the results of paired t tests to evaluate the systemic error showed that all measurements were free of systemic error ( P >0.05).
Shapiro-Wilks and Levene variance homogeneity tests were used to test the normality of the data distribution. The Pearson chi-square test was performed to test the sex distribution. The Mann-Whitney U test was performed to compare the sexes in each group. The Student t test was used to compare the groups. Multiple linear regression analyses were performed to establish and quantify the relationships between the craniofacial measurements and the soft-tissue thickness measurements, where statistically significant differences were observed. All statistical analyses were performed using the SPSS software package (SPSS for Windows 98, version 10.0; SPSS, Chicago, Ill) at P <0.05.
Results
Table I shows the demographic and characteristic features of the patients in both groups. The patients affected by BCLP had increased SN-MP angles ( P = 0.003), decreased Co-A ( P = 0.000), and retruded maxillary ( P = 0.000) and mandibular ( P = 0.026) incisors compared with the matched controls.
| Features | BCLP group (n = 20) | Control group (n = 20) | P |
|---|---|---|---|
| Mean age (y) | 13.78 ± 3.20 | 13.94 ± 2.52 | 0.861 (NS) |
| Female/male | 8/12 | 8/12 | 0.999 (NS) |
| SNA (°) | 79.43 ± 7.15 | 80.83 ± 1.74 | 0.405 (NS) |
| SNB (°) | 75.23 ± 5.49 | 77.42 ± 1.62 | 0.101 (NS) |
| ANB (°) | 4.20 ± 5.47 | 3.40 ± 1.05 | 0.527 (NS) |
| SN-MP (°) | 39.78 ± 10.44 | 32.10 ± 3.45 | 0.003 † |
| Co-A (mm) | 78.16 ± 2.79 | 81.66 ± 2.85 | 0.000 ‡ |
| Co-Gn (mm) | 110.01 ± 5.53 | 111.46 ± 5.14 | 0.392 (NS) |
| U1-SN (°) | 81.19 ± 13.24 | 103.72 ± 3.80 | 0.000 ‡ |
| IMPA (°) | 88.99 ± 7.36 | 93.17 ± 3.73 | 0.026 ∗ |
Table II shows the comparisons of the soft-tissue thicknesses between the sexes in each group. Statistically, there were no significant differences between the sexes in both groups ( P >0.05).
| Soft tissue | Group | Sex | n | Mean (mm) | SD (mm) | P |
|---|---|---|---|---|---|---|
| Glabella | BCLP | Female | 8 | 4.64 | 0.94 | 0.117 (NS) |
| Male | 12 | 5.68 | 1.62 | |||
| Control | Female | 8 | 5.78 | 1.47 | 0.877 (NS) | |
| Male | 12 | 5.45 | 1.62 | |||
| Nasion | BCLP | Female | 8 | 7.94 | 2.12 | 0.710 (NS) |
| Male | 12 | 7.84 | 2.81 | |||
| Control | Female | 8 | 7.65 | 1.32 | 0.418 (NS) | |
| Male | 12 | 8.01 | 2.33 | |||
| Rhinion | BCLP | Female | 8 | 4.02 | 0.97 | 0.138 (NS) |
| Male | 12 | 3.18 | 0.62 | |||
| Control | Female | 8 | 3.43 | 0.92 | 0.132 (NS) | |
| Male | 12 | 2.98 | 0.99 | |||
| Subnasale | BCLP | Female | 8 | 11.83 | 3.96 | 0.509 (NS) |
| Male | 12 | 12.08 | 3.11 | |||
| Control | Female | 8 | 14.63 | 2.03 | 0.643 (NS) | |
| Male | 12 | 15.90 | 4.75 | |||
| Labrale superior | BCLP | Female | 8 | 11.53 | 4.97 | 0.621 (NS) |
| Male | 12 | 11.03 | 2.14 | |||
| Control | Female | 8 | 12.55 | 1.38 | 0.440 (NS) | |
| Male | 12 | 13.68 | 2.90 | |||
| Stomion | BCLP | Female | 8 | 6.74 | 2.71 | 0.509 (NS) |
| Male | 12 | 6.54 | 3.41 | |||
| Control | Female | 8 | 5.47 | 1.45 | 0.758 (NS) | |
| Male | 12 | 6.53 | 3.13 | |||
| Labrale inferior | BCLP | Female | 8 | 14.94 | 2.80 | 0.621 (NS) |
| Male | 12 | 14.64 | 2.61 | |||
| Control | Female | 8 | 14.38 | 1.49 | 0.354 (NS) | |
| Male | 12 | 14.99 | 2.21 | |||
| Labiomental | BCLP | Female | 8 | 13.28 | 2.73 | 0.187 (NS) |
| Male | 12 | 11.67 | 2.18 | |||
| Control | Female | 8 | 12.32 | 1.46 | 0.847 (NS) | |
| Male | 12 | 12.48 | 1.87 | |||
| Pogonion | BCLP | Female | 8 | 12.97 | 2.78 | 0.741 (NS) |
| Male | 12 | 12.01 | 4.39 | |||
| Control | Female | 8 | 12.60 | 2.95 | 0.939 (NS) | |
| Male | 12 | 12.62 | 2.11 | |||
| Gnathion | BCLP | Female | 8 | 6.84 | 3.82 | 0.509 (NS) |
| Male | 12 | 6.93 | 3.20 | |||
| Control | Female | 8 | 5.82 | 2.45 | 0.487 (NS) | |
| Male | 12 | 6.52 | 2.06 |
Table III shows the comparisons of the soft-tissue thickness measurements between the groups. Patients affected by BCLP had statistically significantly decreased thickness measurements for the variables subnasale ( P = 0.005) and labrale superior ( P = 0.026) compared with the controls.
| Soft tissue | Group | Mean ± SD (mm) | SE (mm) | P |
|---|---|---|---|---|
| Glabella | BCLP | 5.37 ± 1.50 | 0.33 | 0.659 (NS) |
| Control | 5.58 ± 1.53 | 0.34 | ||
| Nasion | BCLP | 7.87 ± 2.57 | 0.57 | 0.998 (NS) |
| Control | 7.87 ± 1.96 | 0.43 | ||
| Rhinion | BCLP | 3.43 ± 0.81 | 0.18 | 0.344 (NS) |
| Control | 3.16 ± 0.97 | 0.21 | ||
| Subnasale | BCLP | 12.00 ± 3.28 | 0.73 | 0.005 † |
| Control | 15.40 ± 3.87 | 0.86 | ||
| Labrale superior | BCLP | 11.18 ± 3.11 | 0.69 | 0.026 ∗ |
| Control | 13.23 ± 2.43 | 0.54 | ||
| Stomion | BCLP | 6.60 ± 3.15 | 0.70 | 0.593 (NS) |
| Control | 6.11 ± 2.60 | 0.58 | ||
| Labrale inferior | BCLP | 14.73 ± 2.60 | 0.58 | 0.982 (NS) |
| Control | 14.74 ± 1.94 | 0.43 | ||
| Labiomental | BCLP | 12.15 ± 2.41 | 0.53 | 0.691 (NS) |
| Control | 12.41 ± 1.68 | 0.37 | ||
| Pogonion | BCLP | 12.29 ± 3.93 | 0.87 | 0.757 (NS) |
| Control | 12.62 ± 2.60 | 0.53 | ||
| Gnathion | BCLP | 6.90 ± 3.29 | 0.73 | 0.456 (NS) |
| Control | 6.24 ± 2.19 | 0.48 |
Stay updated, free dental videos. Join our Telegram channel
VIDEdental - Online dental courses


