Introduction
The aim of this study was to examine the agreement of skeletal age assessment based on hand-wrist radiographs with cephalogram-based cervical vertebrae evaluation. To circumvent bias and loss of information from staging, a quantitative approach was applied to determine morphologic changes.
Methods
We analyzed 730 sets of radiographs (cephalogram and hand-wrist) of untreated subjects (352 boys, 378 girls; age range, 6-18 years) from a growth study, each sex as a separate sample. Skeletal age was determined on the hand-wrist radiographs according to the method of Greulich and Pyle. Morphometric changes of the vertebral bodies C2 through C4 were measured (concavity, anterior height, and angle) and tested for correlations with the method of Greulich and Pyle. All correlating variables were included in a multiple linear regression to generate a calculated skeletal age. To establish the agreement between the method of Greulich and Pyle and calculated skeletal age, Bland-Altman plots were made, limits of agreement were identified, and cross-tables (before and after peak height velocity) were computed. Similarly, the agreement between the method of Greulich and Pyle and each subject’s chronologic age was estimated for comparison.
Results
Concavity of C2, C3, and C4; anterior height of C3 and C4; and the angle of C3 correlated with skeletal age highly significantly ( P <0.0001) in both sexes, and calculated skeletal age was established based on a linear regression. The agreement between the method of Greulich and Pyle and calculated skeletal age was modest (limits of agreement: boys, ±3.5 years; girls, ±3.3 years) and substantially weaker than the agreement between the method of Greulich and Pyle and chronologic age (limits of agreement: boys, +2.1 to −1.7 years; girls, +2.2 to −1.2 years). Similarly, calculated skeletal age resulted in considerably more false predictions of peak height velocity (boys, 18.9%; girls, 12.9%) than did chronologic age (boys, 7.1%; girls, 7.4%).
Conclusions
Morphometric assessment of age-dependent changes in the cervical spine offers no advantage over chronologic age, in either assessing skeletal age or predicting the pubertal growth spurt.
The evaluation of skeletal age is essential in many orthodontic treatment approaches, especially regarding the correction of skeletal imbalance. In functional orthopedics, which aims to exploit mandibular growth, success is intimately linked to growth potential. But growth of the mandible is not linear throughout development. Chronologic age has been deemed an inadequate indicator to identify stages of growth because of individual variations in timing, velocity, and duration of growth.
The periods of acceleration and deceleration during growth are based on the complex endocrine regulation of craniofacial growth. Although a novel approach with insulin-like growth factor I as an indicator for the pubertal growth spurt has been described in scientific literature, this method has not yet reached clinical applicability. Thus, the assessment of biologic age remains restricted to 2 approaches: clinical evaluation based on various secondary indicators (sexual maturation, longitudinal records of body height, menarche in girls, or voice change in boys ) and the appraisal of skeletal maturity based on radiographs (most commonly, hand-wrist radiographs or cervical vertebral maturation ).
Skeletal maturation assessed with a hand-wrist radiograph is considered to be the gold standard. Its alleged high reliability is due to the fact that a multitude of hand and wrist bones can be depicted on 1 radiograph, and their various stages of ossification allow a precise correlation to overall growth. Several methods were described to assess hand-wrist radiography, and for endocrinologists, the concordant result of different methods is considered most reliable.
Lamparsky demonstrated as early as 1975 that, alternatively, morphologic changes in cervical vertebrae could also be used to evaluate skeletal maturity. Many subsequent authors confirmed a correlation between the maturation of the hand-wrist bones and the cervical vertebrae, as well as a correlation between the cervical vertebrae and facial growth. Based on these findings and since cephalograms are routinely taken in orthodontics, it would indeed appear that a hand-wrist radiographic examination becomes superfluous.
Thus, the recommendation to replace hand-wrist radiographic examination with cervical vertebrae assessment has been widely expressed and has been the subject of various studies. Although the substitution has been vastly supported in previous years, recently more studies have reported poor reproducibility and reliability of the cervical vertebrae maturation assessment. This verdict was based mainly on the difficulty of staging and classifying the vertebral bodies of C3 and C4 as trapezoidal, rectangular horizontal, square, or rectangular vertical. The difficulty in staging the cervical vertebrae morphology has rendered its use questionable as a strict clinical guideline for timing of orthodontic treatment.
The aim of this study was therefore to circumvent the shortcomings of staging and reexamine the agreement of skeletal age assessment based on hand-wrist radiographs with cephalogram-based cervical vertebrae evaluation. To overcome the drawbacks of staging in common cervical spine assessments, a quantitative approach of morphologic changes was applied. To verify the accuracy of the calculated cervical age, the results were compared with the agreement between skeletal age assessments based on hand-wrist radiographs and chronologic age.
Material and methods
The material of this cross-sectional study consisted of radiographic records (lateral cephalograms and hand-wrist radiographs) from the Zurich Craniofacial Growth Study performed from 1981 to 1984 at the Department of Orthodontics and Pediatric Dentistry of the University of Zurich in Switzerland. In the original study, healthy schoolchildren of white ethnicity from local public schools with no history of orthodontic treatment were randomly selected for radiographic records (cephalogram and hand-wrist radiograph). All radiographic records (n = 1372) of this study were taken close to each subject’s birthday (range, 6-18 years; Table I ).
| Age group (y) | Boys | Girls | ||||
|---|---|---|---|---|---|---|
| Mean age (y) | Age range (y) | Subjects (n) | Mean age (y) | Age range (y) | Subjects (n) | |
| 6 | 6.0 | 5.9-6.1 | 13 | 6.0 | 6.0-6.1 | 9 |
| 7 | 7.0 | 7.0-7.2 | 10 | 7.0 | 7.0-7.2 | 7 |
| 8 | 8.0 | 8.0-8.2 | 14 | 8.0 | 8.0-8.0 | 15 |
| 9 | 9.0 | 8.9-9.2 | 35 | 9.0 | 9.0-9.2 | 41 |
| 10 | 10.0 | 10.0-10.1 | 16 | 10.0 | 9.9-10.1 | 23 |
| 11 | 11.0 | 10.9-11.1 | 12 | 11.0 | 10.9-11.3 | 31 |
| 12 | 12.0 | 12.0-12.2 | 49 | 12.0 | 12.0-12.2 | 47 |
| 13 | 13.0 | 13.0-13.1 | 13 | 13.0 | 13.0-13.2 | 35 |
| 14 | 14.0 | 14.0-14.3 | 49 | 14.0 | 13.9-14.3 | 63 |
| 15 | 15.0 | 14.9-15.2 | 66 | 15.0 | 14.9-15.2 | 57 |
| 16 | 16.0 | 15.9-16.2 | 46 | 16.0 | 16.0-16.1 | 32 |
| 17 | 17.0 | 17.0-17.1 | 25 | 17.0 | 17.0-17.2 | 15 |
| 18 | 18.0 | 18.0-18.1 | 4 | 18.0 | 18.0-18.1 | 3 |
| Total | 352 | 378 | ||||
Legal approval for releasing the data was obtained by the Federal Commission of Experts for Professional Secrecy in Medical Research. All cephalograms included in this study had to be of sufficient quality, and the cervical spine (C2-C4) had to be clearly visible. Thus, the final sample consisted of 730 subjects (378 girls, 352 boys).
The lateral cephalograms were taken with the head stabilized by ear rods and nasal support. The Frankfort horizontal plane was set parallel to the floor, and the teeth were in centric occlusion. The radiographs were taken with a focus-to-coronal plane distance of 200 cm and an enlargement of 7.5%. Hand-wrist radiographs were taken in a standardized fashion with a focus-to-film distance of 215 cm and a 30° angulation of the thumb to allow depiction of the sesamoid bone.
The 730 lateral cephalograms were traced and landmarked by 3 dedicated investigators who shared the workload equally (these landmarks are defined in Table II and shown in Fig 1 ). The digitizing was performed with a tablet digitizer, AccuGrid (Numonics, Landsdale, Pa), with a resolution of 1 mili-inch. Custom-made software was used for the calculation of the cephalometric values.
| Variable | Applied on | Description |
|---|---|---|
| Concavity | C2, C3, C4 | The ratio between the lower border (C2/3/4lp – C2/3/4la) of the vertebra and its perpendicular distance through C2/3/4m |
| Anterior height | C3, C4 | The ratio between the anterior border (C3/4ua – C3/4la) and the lower border (C3/4lp – C3/4la) |
| Angle | C3, C4 | The angle between the upper (C3/4up – C3/4ua) and lower (C3/4lp – C3/4lp) borders of the vertebrae |
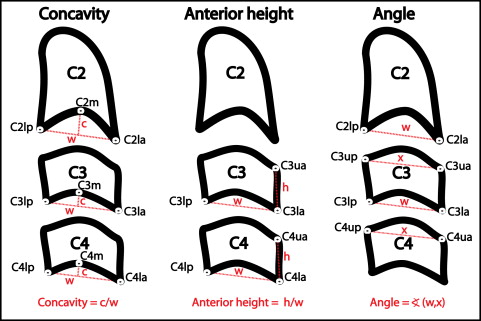
Ratios of the linear measurements or angles were used to account for radiographic enlargement and interindividual size differences. All analyzed variables are shown in Figure 1 and correspond to the morphologic changes described in the literature. The analysis included the following parameters: concavity of C2, C3, and C4; anterior height of C3 and C4; and the angle between the upper and lower borders of C3 and C4.
To appraise the reliability of the cervical spine evaluation, it was examined against the skeletal age assigned by the method of Greulich and Pyle, the gold standard chosen for this study.
One of the above-mentioned investigators who traced the cephalograms repeated the tracings of 38 cephalograms, more than 6 months later; 19 of this investigator’s tracings and an additional 19 tracings of another investigator were repeated to determine the intraobserver and interobserver reproducibilities. Since only 1 investigator (P.B.) assessed all hand-wrist radiographs, the reliability tests were confined to intraobserver repeatability. Thirty hand-wrist radiographs were analyzed a second time, 12 months later, by the same investigator, to determine intraobserver reliability.
Statistical analysis
A standard statistical software package (PASW Statistics version 18; IBM, Armonk, New York, NY) was used for the statistical analysis. The intraclass correlation coefficient (ICC) for absolute agreement based on a 1-way random-effects analysis of variance (ANOVA) was calculated to determine intraobserver and interobserver reliability for every assessment method separately. Descriptive statistics for the measurements were computed. The Pearson correlation coefficient was performed to evaluate correlations between the morphologic measurements and the skeletal age by hand-wrist assessment. Correlating variables were included in a multiple linear regression to generate a calculated skeletal age. To establish the agreement between the Greulich and Pyle evaluation and the calculated skeletal age, Bland-Altman plots were performed, and limits of agreement were identified. Cross-tables (before and after peak height velocity) with sensitivity, specificity, positive and negative predictive values, and likelihood ratios were computed. Similarly, the agreement between the Greulich and Pyle evaluation and each subject’s chronologic age was estimated for comparison. P values smaller than 0.05 were considered statistically significant.
Results
The ICC values showed excellent reproducibility for all cephalometric measurements, with 0.948 (95% confidence interval [CI], 0.931-0.966) for intraobserver repeatability and 0.933 (95% CI, 0.915-0.952) for interobserver repeatability. The ICC of 0.992 (95% CI, 0.985-0.996) for intraobserver repeatability of hand-wrist radiographs assessment was similarly high.
Possible correlations between morphologic changes of the vertebrae and skeletal age, as determined by the method of Greulich and Pyle, are shown in Table III . Excellent correlations were found for concavity of C2, C3, and C4 as well as for anterior height of C3 and C4. In contrast, although statistically highly significant, angle C3 had only a low correlation coefficient (r = 0.235), and angle C4 did not correlate at all. Variables without significant correlations and with a correlation coefficient lower than 0.5 were excluded from the multiple regression equation. As a result, angles C3 and C4 were not included in the regression analysis.
| Concavity | Anterior height | Angle | |||||
|---|---|---|---|---|---|---|---|
| C2 | C3 | C4 | C3 | C4 | C3 | C4 | |
| Boys | |||||||
| Correlation coefficient | 0.649 | 0.676 | 0.675 | 0.762 | 0.706 | 0.235 | 0.087 |
| P value | 0.000 ∗ | 0.000 ∗ | 0.000 ∗ | 0.000 ∗ | 0.000 ∗ | 0.000 ∗ | 0.102 |
| Girls | |||||||
| Correlation coefficient | 0.587 | 0.690 | 0.717 | 0.746 | 0.750 | 0.343 | 0.365 |
| P value | 0.000 ∗ | 0.000 ∗ | 0.000 ∗ | 0.000 ∗ | 0.000 ∗ | 0.000 ∗ | 0.102 |
A multiple regression equation as a function of the variables of concavity C2, C3, and C4 as well as anterior height C3 and C4 was calculated to estimate the skeletal age, as shown in Table IV . Based on multiple linear regression analyses, Equations 1 and 2 were established for the calculated skeletal age (CSA).
Stay updated, free dental videos. Join our Telegram channel
VIDEdental - Online dental courses


