Introduction
The aim of this study was to evaluate craniofacial asymmetry by using 2-dimensional (2D) posteroanterior cephalometric images, 3-dimensional cone-beam computed tomography (CBCT), and physical measurements (gold standard).
Methods
Ten dry human skulls were assessed, and radiopaque markers were placed on 17 skeletal landmarks. Twenty linear measurements were taken on each side to compare the right and left sides and to compare these measurements with the physical measurements made with a digital caliper. To acquire the 2D posteroanterior radiographs, an Extraoral Phosphor Storage Plate (Air Techniques, Chicago, Ill) was used as the image receptor with a Eureka x-ray-Duocon Machlett unit (Machlett Laboratores, Chicago, Ill). Three-dimensional imaging data were acquired from a CB MercuRay (Hitachi Medical, Tokyo, Japan).
Results
On average, the right side was larger than the left for most of the 20 distances evaluated in the digital 2D and the CBCT images, and there was poor agreement between the digital 2D images and the physical measurements (kappa = 0.0609) and almost perfect agreement (kappa = 0.92) between the CBCT and physical measurements when individual measurements were considered.
Conclusions
Human skulls, with no apparent asymmetry, had some differences between the right and left sides, with dominance for the right side but with no clinical significance. CBCT can better evaluate craniofacial morphology when compared with digital 2D images.
The study of orthodontics is indissolubly connected with that of art as related to the human face, and the subject of facial esthetics is of paramount importance to orthodontists. Facial esthetics in terms of symmetry and balance are referred to as the state of facial equilibrium, and the correspondence in size, form, and arrangement of the facial features on the opposite sides of the median sagittal plane. However, it appears from the literature that there is some asymmetry in a normal face.
Orthodontists are frequently called upon to treat dentitions in which there is a decided difference, either dentally, skeletally, or dentoskeletally, between the patient’s right and left sides. These right-left differences have all degrees of severity. Some can cause interference with normal function of the dental structures and present esthetic problems. Others are so slight that they cannot be detected by gross observation. We know from clinical experience that right-left differences or asymmetries are common and often become a matter of concern in orthodontic therapy. What determines when an asymmetry reaches the pathologic level is not exactly measurable, since one must consider clinical parameters relative to esthetics and function.
Craniofacial asymmetry has been investigated by various methods. Direct measurements on dry skulls are the oldest method, but the most common methods are radiographic image analysis and analysis of photographs. Most of these methods use bilateral anatomic points related to anatomic points located in the midsagittal plane for quantifying asymmetries in the skull. Many posteroanterior (PA) radiographic orthodontic analyses use both horizontal and vertical reference lines for measuring dentofacial asymmetries. Midline structures were also used to assess asymmetry as a deviation toward the right or the left side from a chosen reference line. Few studies have evaluated asymmetry with 3-dimensional (3D) image analysis. Recent studies have shown that computed tomography (CT) scans with 3D reconstruction and cone-beam CT (CBCT) images are useful to identify skeletal and dental landmarks for orthodontic and craniofacial analyses and to evaluate asymmetry in the facial skeleton.
A PA cephalometric radiograph does not provide sufficient information for identifying the causes of asymmetry or determining a suitable treatment plan. Many studies have shown that 2-dimensional (2D) PA cephalometric radiographs have limited reliability and value for orthodontic diagnosis and treatment planning because of the superimposition of bony structures in the deeper regions of the craniofacial complex and the incomplete assessment of soft tissues. Projection images are also subject to optical distortions such as those caused by geometric magnification, rotation effects related to patient positioning in the cephalostat, and penumbra. Because a misdiagnosis of facial asymmetry can result in the wrong treatment, accurate evaluation of facial asymmetry is crucial in orthodontic practice. The development of CBCT has greatly reduced these errors and improved our ability to understand the 3D nature of facial structures. In addition, recently introduced 3D CT software enables 3D reconstruction and accurate measurement of the maxillofacial complex. CBCT allows for clinically accurate and reliable 3D linear measurements of the craniofacial complex.
Some authors found that the right side of the face has dominance over the left side. Others found predominance of the left side of the face. If this is true, then it would be reasonable to believe that a normal, symmetrical face with normal occlusion of the teeth could have a certain degree of asymmetry in the bony structures. We hypothesize that there is some asymmetry in the facial skeleton and that measurements obtained from CBCT can provide a means of better evaluating and quantifying these facial skeletal asymmetries than digital 2D images.
In this study, digital 2D PA cephalometric radiographs and CBCT images were obtained of skulls with apparent symmetrical facial skeletal structures (1) to see whether there is asymmetry in the facial skeleton, (2) to determine which side is dominant, and (3) to compare the results of the 2 radiographic methods and compare these with the physical measurements considered as the gold standard.
Material and methods
Ten undocumented intact dry human skulls were obtained from the Department of Oral Medicine, Radiology Division, at the University of Washington, Seattle. There was no apparent asymmetry or deformity of the cranial structures, and all 10 skulls had apparently normal anatomic proportions.
A plastic box was made to provide some soft-tissue equivalent attenuation, and the skulls were placed inside it before imaging. A plastic head holder was constructed to support the skulls during imaging. To separate the mandibular condyle from the temporal fossa and create a “normal” joint space, 1 mm of wax was placed between the glenoid fossa and the condylar head. For all images, the teeth were placed in maximum intercuspation.
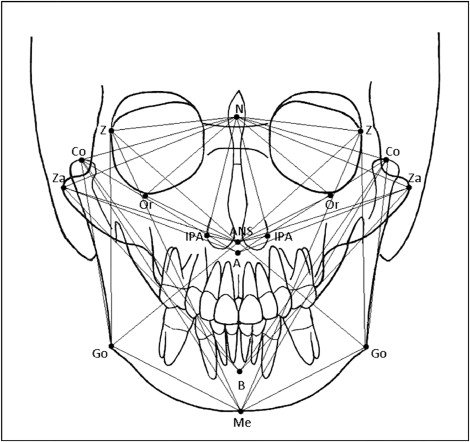
Metallic markers with a diameter of 1.5 mm (SDM-BB15, St. John, Valencia, Calif) were placed on 17 skeletal landmarks ( Table I ). The targets were located based on criteria commonly used in 2D cephalometric analysis and represented midsagittal and bilateral landmarks ( Fig 1 ). Twenty linear measurements ( Fig 1 ) were taken on the right and left sides on all 3D reconstructions, on the radiographic images, and directly on the skulls. Each set of 40 measurements from the digital 2D PA cephalometric, CBCT, and skulls was taken by the first author and repeated 3 times, with at least a 1-week interval. Thus, a total of 360 measurements were obtained from each skull.
| Abbreviation | Definition | ||
|---|---|---|---|
| Midsaggital landmarks | |||
| 1 | N | Nasion | The most anterior point on the frontonasal suture in the midsagittal plane |
| 2 | ANS | Anterior nasal spine | The anterior tip of the sharp bony process of the maxilla at the lower margin of the anterior nasal opening |
| 3 | Point A | Subspinale | The most posterior midline point in the concavity between ANS and the maxillary alveolar process |
| 4 | Point B | Supramentale | The most posterior midline point in the concavity of the mandible between the most superior point on the bone overlying the mandibular incisor (infradentale) and pogonion |
| 5 | Me | Menton | The lowest point on the symphyseal shadow of the mandible seen on a lateral cephalogram |
| Bilateral landmarks | |||
| 6 | Co | Condylion | The most superior point of the condylar head |
| 7 | Z | Zygomaticofrontal medial suture point | Intersection of zygomatic-frontal suture and lateral orbital margin |
| 8 | Or | Orbitale | The most inferior point on the infraorbital rim |
| 9 | Za | Zygomatic arch | A point at the most lateral surface of the zygomatic arch near the zygomaticomaxillary suture |
| 10 | Ipa | Lateral piriform aperture | The most lateral aspect of the piriform aperture |
| 11 | Go | Gonion | A point on the inferior surface on the mandible that lies midway along the curvature between the ramus and the body |
The digital 2D cephalometric images were taken according to standard procedures. A 20 × 25 cm Extraoral Phosphor Storage Plate (Division Allpro Imaging, Air Techniques, Melville, NY) used as an image receptor was placed in a standard X-Omatic Cassette (Kodak, Rochester, NY). The radiation source was a Eureka x-ray tube (Duocon Machlett, GEC Medical, Machlett Laboratories, Chicago, Ill). The exposure values were set at 80 kV and 10 mA with an exposure time of 0.04 seconds. The plates were scanned in a Scan X Digital Imaging System In-line Erase, and the digital images were viewed and saved by using Visix Imaging Software (Division Allpro Imaging, Air Techniques).
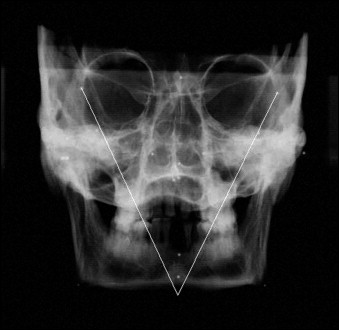
The linear measurements from the right and left sides were taken with Photoshop software (version 7.0, Adobe Systems, San Jose, Calif). If necessary, image adjustments of brightness and contrast were made ( Fig 2 ).
The CBCT images were acquired with the CB MercuRay (Hitachi Medical, Tokyo, Japan). The skull was positioned according to the manufacturer’s instructions.
A single 360° basis projection with 512 slices and 215 megabytes was then made for each skull by using Image Viewer software-CB Works (version 3.0, Hitachi Medical). The version of the system used in this study has a scalable 12-in charge-coupled device detector that was adjusted in field-of-view 12-in mode with 0.4 mm 3 voxels (in high-resolution mode) and 8 bits per voxel. Exposure parameters were 100 kV, 15 mA, and 14-second scan time.
After the images were obtained as raw study data, they were converted into DICOM format by using CB Works (version 3.0, Hitachi Medical, Tokyo, Japan) software produced by CB MercuRay Maxillofacial Imaging System. The DICOM-format images were rendered into volumetric images, and sagittal, axial, and coronal slices of the image were used for the measurements.
With the axial view, the midsagittal plane of the model was oriented vertically. With the coronal view, the midsagittal landmarks of the model were oriented vertically, and the transporionic line of the model was oriented horizontally. With the sagittal view, the Frankfort plane of the model was oriented horizontally.
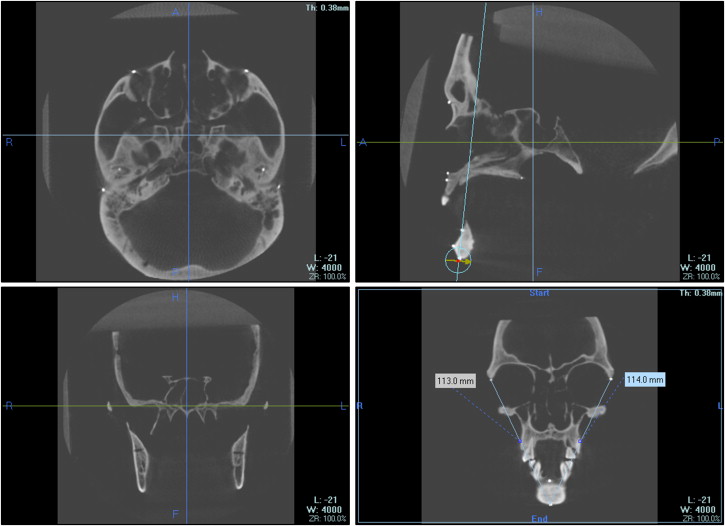
The measurements were taken by using multi-planar reconstruction mode: oblique functions that were mostly used to take linear measurements between 2 points on separate planar locations. A plane that intersected a midsagittal point was randomly selected, and then this plane was just rotated around this point until the others 2 points intersected it. The distance between the 2 points was evaluated. The numeric value of the distance was displayed in a box ( Fig 3 ). If necessary, the zoom function was used.
The physical distances between landmarks were determined by manual measurements with a digital caliper with a resolution of 0.01 mm (Ultra-Cal IV 6 in or 150 mm, Fred V. Fowler, Newton, Mass) to establish the true distances between the selected anatomic points (gold standard).
The reliability of the measurements was assessed by repeated measures of the distances on all imaging modalities. The error of the method was estimated by the following formula, where σ denotes the error, d the difference between measurements, and n the number of distances:
The errors of the method were 0.44 mm for digital 2D, 0.44 mm for CBCT, and 0.32 mm for physical measurements. The mean values of the 3 repeated measurements were recorded, and the differences between the right and left sides were calculated to evaluate the dominant side for the digital 2D, CBCT, and physical measurements. To evaluate the concordance between the digital 2D and CBCT with the physical measurements (gold standard), the kappa test was performed.
Results
Table II shows the mean values for all skulls for the linear measurements on the right and left sides. Eighteen of the 20 measurements, among all 3 methods, had less than 1 mm difference between the left and right sides, except for N-Za and ANS-Za on the digital 2D measurements and N-Co and A-Co on the CBCT and physical measurements. The right side was larger than the left in 17 of the 20 distances evaluated on the CBCT measurements, except for ANS-IPA, ANS-Or, and B-Za (negative values). The same distances were also greater on the right side than the left for the physical measurements. The digital 2D measurements showed that the right side was larger in 15 of the 20 distances evaluated, except for N-Or, ANS-Z, ANS-Go, Me-Co, and Me-Z.
| Variable | Side | n | Mean digital 2D |
Mean difference |
SD | Mean CBCT |
Mean difference |
SD | Mean physical |
Mean difference |
SD |
|---|---|---|---|---|---|---|---|---|---|---|---|
| N-Z | Right | 10 | 48.531 | 2.679 | 49.330 | 2.759 | 49.714 | 2.860 | |||
| Left | 10 | 48.343 | 0.188 | 2.735 | 49.023 | 0.307 | 2.541 | 49.193 | 0.521 | 2.597 | |
| N-Za | Right | 10 | 66.106 | 9.312 | 74.08 | 12.92 | 74.65 | 13.11 | |||
| Left | 10 | 64.416 | 1.690 | 8.995 | 73.20 | 0.880 | 12.60 | 73.77 | 0.880 | 12.71 | |
| N-Or | Right | 10 | 52.118 | 12.960 | 55.01 | 17.78 | 54.98 | 18.00 | |||
| Left | 10 | 52.147 | −0.029 | 11.818 | 54.49 | 0.520 | 17.40 | 54.65 | 0.330 | 17.70 | |
| N-Co | Right | 10 | 60.566 | 5.347 | 90.65 | 4.72 | 94.49 | 5.34 | |||
| Left | 10 | 59.741 | 0.825 | 3.706 | 89.30 | 1.350 | 5.80 | 93.36 | 1.130 | 6.26 | |
| N-Go | Right | 10 | 95.366 | 9.158 | 112.56 | 7.92 | 114.12 | 8.14 | |||
| Left | 10 | 94.714 | 0.652 | 8.669 | 111.93 | 0.630 | 8.13 | 113.34 | 0.780 | 8.18 | |
| N-IPA | Right | 10 | 40.520 | 2.867 | 39.83 | 3.25 | 39.53 | 3.34 | |||
| Left | 10 | 40.342 | 0.178 | 2.868 | 39.607 | 0.223 | 3.078 | 39.31 | 0.220 | 3.17 | |
| ANS-Z | Right | 10 | 65.443 | 3.120 | 64.281 | 2.621 | 64.558 | 2.397 | |||
| Left | 10 | 65.530 | −0.087 | 3.235 | 64.275 | 0.006 | 2.727 | 64.450 | 0.108 | 2.513 | |
| ANS-Za | Right | 10 | 65.722 | 4.205 | 76.98 | 4.90 | 77.98 | 4.85 | |||
| Left | 10 | 64.205 | 1.517 | 4.675 | 76.30 | 0.680 | 5.19 | 77.15 | 0.830 | 5.29 | |
| ANS-IPA | Right | 10 | 14.455 | 1.707 | 14.780 | 1.477 | 14.709 | 1.538 | |||
| Left | 10 | 14.124 | 0.331 | 11.405 | 14.865 | −0.085 | 1.385 | 14.737 | −0.028 | 1.626 | |
| ANS-Or | Right | 10 | 45.199 | 2.604 | 44.654 | 2.192 | 45.132 | 2.111 | |||
| Left | 10 | 44.696 | 0.503 | 2.702 | 45.090 | −0.436 | 1.975 | 45.247 | −0.115 | 1.395 | |
| ANS-Go | Right | 10 | 57.878 | 7.344 | 89.63 | 5.72 | 91.23 | 5.55 | |||
| Left | 10 | 57.946 | −0.068 | 6.816 | 89.23 | 0.400 | 5.87 | 90.96 | 0.270 | 5.46 | |
| A-Co | Right | 10 | 58.272 | 5.232 | 91.32 | 4.89 | 94.42 | 4.64 | |||
| Left | 10 | 57.994 | 0.278 | 5.309 | 90.22 | 1.100 | 5.64 | 93.29 | 1.130 | 5.36 | |
| A-Za | Right | 10 | 66.442 | 5.338 | 77.53 | 4.89 | 78.56 | 4.92 | |||
| Left | 10 | 65.904 | 0.538 | 5.827 | 76.85 | 0.680 | 5.19 | 77.78 | 0.780 | 5.10 | |
| B-Co | Right | 10 | 81.197 | 5.290 | 102.12 | 3.59 | 103.88 | 3.80 | |||
| Left | 10 | 80.208 | 0.989 | 4.858 | 101.61 | 0.510 | 3.91 | 103.24 | 0.640 | 4.03 | |
| B-Za | Right | 10 | 85.699 | 6.048 | 90.270 | 2.833 | 90.256 | 3.14 | |||
| Left | 10 | 85.190 | 0.509 | 5.002 | 90.33 | −0.060 | 3.20 | 90.33 | −0.074 | 3.28 | |
| Me-Co | Right | 10 | 96.058 | 5.242 | 110.95 | 5.82 | 112.71 | 6.08 | |||
| Left | 10 | 96.298 | −0.240 | 4.752 | 110.32 | 0.630 | 5.66 | 112.30 | 0.410 | 6.11 | |
| Me-Go | Right | 10 | 52.714 | 4.224 | 77.27 | 4.01 | 77.78 | 4.14 | |||
| Left | 10 | 52.637 | 0.077 | 5.923 | 76.30 | 0.970 | 3.63 | 77.12 | 0.660 | 3.74 | |
| Me-Z | Right | 10 | 114.547 | 3.600 | 110.85 | 3.70 | 111.85 | 3.20 | |||
| Left | 10 | 114.845 | −0.298 | 4.272 | 110.62 | 0.230 | 3.75 | 111.63 | 0.220 | 3.31 | |
| Co-Go | Right | 10 | 56.602 | 4.963 | 54.20 | 7.24 | 54.40 | 6.93 | |||
| Left | 10 | 55.747 | 0.855 | 5.798 | 53.27 | 0.930 | 7.21 | 53.67 | 0.730 | 7.19 | |
| Z-Go | Right | 10 | 80.390 | 8.016 | 90.84 | 7.00 | 90.00 | 6.58 | |||
| Left | 10 | 79.469 | 0.921 | 7.670 | 90.33 | 0.510 | 6.81 | 89.50 | 0.500 | 6.70 |
Stay updated, free dental videos. Join our Telegram channel
VIDEdental - Online dental courses


