Introduction
The purpose of this study was to investigate the effects of the diameter and shape of orthodontic mini-implants (OMIs) on microdamage to the cortical bone during implant placement.
Methods
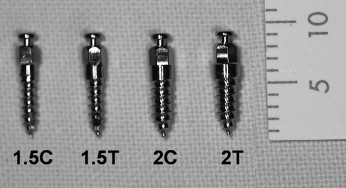
Twenty-eight self-drilling OMIs (Biomaterials Korea, Seoul, Korea; length, 6 mm; diameters, 1.5 and 2 mm; cylindrical and tapered shapes; classified as 1.5C, 2C, 1.5T, and 2T) were placed with a surgical device in the tibias of 7 New Zealand white rabbits (mature males; mean age, 6 months; mean weight, 3.1 kg). Four OMIs of each type per rabbit were placed randomly. Maximum insertion torque (MIT) was measured. Immediately after placement of the OMIs, the block of bone with the OMI was harvested. Cortical bone thickness was measured by using microcomputed tomography, and histomorphometric analyses of the number of cracks (NC), accumulated crack length (ACL), maximum radius of the crack (MRC), and longest crack (LC) were performed. Kruskal-Wallis and Mann-Whitney U tests with the Bonferroni adjustment were done for statistical analyses.
Results
Increased diameter (1.5C<2C and 1.5T<2T) and tapering (1.5C<2T) resulted in increased values of MIT, NC, and LC ( P <0.01, respectively). Similarly, with increased diameters (1.5C and 1.5T<2C and 2T), there were increases of ACL and MRC ( P <0.001, respectively). However, there were no differences in the values of MIT, NC, ACL, MRC, and LC between the cylindrical and tapered OMIs with the same diameters (1.5C and 1.5T, 2C and 2T).
Conclusions
OMIs with larger diameters and tapered shapes caused greater microdamage to the cortical bone; this might affect bone remodeling and the stability of the OMIs.
Recent developments in the design, biomechanics, and clinical aspects of orthodontic mini-implants (OMIs, also called temporary anchorage devices) have expanded treatment options in orthodontics.
According to numerous studies of OMIs, various factors such as age, sex, skeletal pattern, placement location, screw design, type of placement surgery, immediate loading, oral hygiene, and inflammation are associated with their stability. Although the success rates of OMIs have been reported to range from 84% to 92%, failures occur most frequently in the first 4 months.
Because of the size of interradicular spaces, bone quality (thickness and stiffness), implant design (shape, diameter, and length), placement modality, and possible periodontal or root damage with OMIs should be considered.
Although Wiechmann et al had a lower failure rate for OMIs with a self-drilling design and larger diameters, self-drilling OMIs with a large screw diameter and a tapered or conical shape might cause overcompression of the cortical bone by excessive placement torque. This can lead to microdamage, a permanent deformation of the microstructure in loaded cortical bone in the form of fatigue, creep, and eventual cracking. Therefore, the accumulation of microdamage can produce local ischemia, bone necrosis, bone remodeling, and premature loss of the OMI.
To our knowledge, few histomorphometric studies have evaluated microdamage in cortical bone after placement of OMIs. The purpose of this study was to investigate the effects of diameter and shape of OMIs with regard to microdamage in the cortical bone during OMI placement.
Material and methods
The self-drilling OMIs (titaniuum-aluminum-vanadium alloy, Biomaterials Korea, Seoul, Korea) were classified into 4 subtypes according to diameter and shape ( Fig 1 ): 1.5C (diameter, 1.5 mm; length, 6 mm; cylindrical shape; n = 7), 2C (diameter, 2 mm; length, 6 mm; cylindrical shape; n = 7), 1.5T (diameter, 1.5 mm; length, 6 mm; tapered shape; n = 7), and 2T (diameter, 2 mm; length, 6 mm; tapered shape; n = 7).
New Zealand white rabbits (mature males; mean age, 6 months; mean weight, 3.1 kg; n = 7) were used with an approved protocol. Animal care was according to guidelines of the Animal Ethics Committee of Seoul National University (#2008-1).
The animals were anesthetized with intramuscular injections of xylazine hydrochloride (Rompun, 5 mg/kg, Bayer Korea, Seoul, Korea) and zolazepam (Zoletil, 15 mg/kg, Virbac Korea, Seoul, Korea). After the medial surface of the upper portion of the hind leg was shaved, the skin was disinfected with povidone iodine. Local anesthesia at the surgical site was 2% lidocanine hydrochloride with 1:80,000 epinephrine (Gwangmyung, Seoul, Korea).
After a full-thickness flap was reflected along the proximal third of the tibia, the OMIs were placed on the denuded bone by using a surgical device (INTRAsurg300 plus, Kavo Dental, Biberach an der Riβ, Germany; rotation speed, 35 rpm; maximum torque, 40 N·cm; Fig 2 , A ). During placement, maximum insertion torque (MIT) was measured.
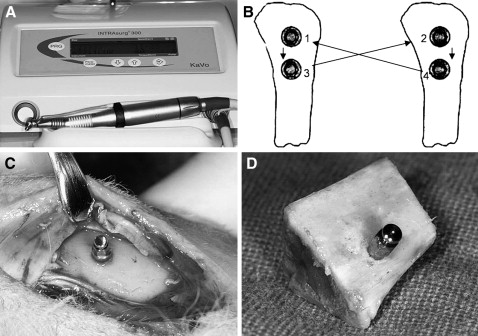
Four OMIs of each type per rabbit were placed. A round-robin method was used to randomize the types of OMIs ( Fig 2 , B ). The distance between 2 OMIs was at least 2 cm to minimize stress concentration during placement.
Immediately after placement of the OMIs ( Fig 2 , C ), the animals were killed by using succinylcholine chloride (Succicholine, Il Sung Pham, Seoul, Korea). The blocks with the OMI and adjacent bone tissue ( Fig 2 , D ) were obtained by manual sawing at a distance of 1 cm from the OMI. However, 2 blocks with 2T OMIs spontaneously cracked because of great stress concentration after placement of the OMIs during sawing.
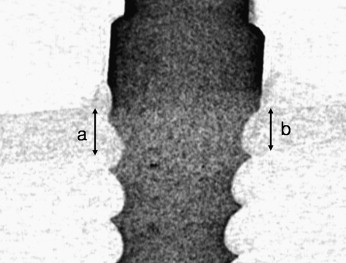
After the bone blocks were fixed in 4% formalin solution for 48 hours, the cortical bone thickness adjacent to the OMI was measured by using micro-computed tomography (CT) (1072 x-ray microtomography, Skyscan, Antwerp, Belgium) and a CT-analyzer (version 16.1, Skyscan) ( Fig 3 ).
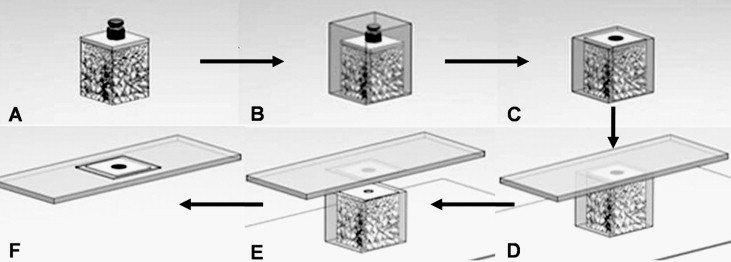
The blocks were dehydrated by using a sequence of 70%, 80%, 95%, and 100% ethanol ( Fig 4 , A ) and embedded in methylmethacrylate resin (Technovit 7200VLC, Heraeus Kulzer, Dormagen, Germany; Fig 4 , B ). The blocks were then sliced parallel to the cortical bone surface and perpendicular to the long axis of the OMI ( Fig 4 , C and D ). The specimens were ground to a thickness of 40 to 50 μm with the Exakt cutting and grinding system ( Fig 4 , E ) and were stained with hematoxylin and eosin ( Fig 4 , F ).
Histologic observations were performed with a microscope (BX-51, Olympus, Tokyo, Japan) and a viewer for imaging applications (OlyVIA, Olympus Soft Imaging Solutions, Münster, Germany).
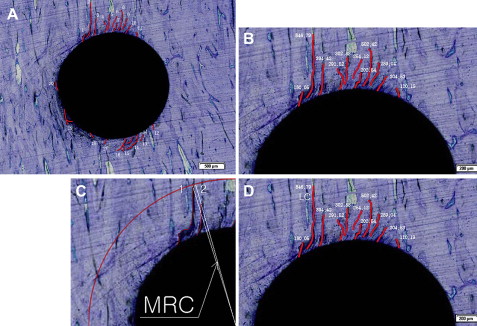
The total number of cracks (NC, counted to only a depth of at least 50 μm; Fig 5 , A ), accumulated crack length (ACL; Fig 5 , B ), maximum radius of the crack (MRC, measured from the screw’s midpoint; Fig 5 , C ), and the longest crack (LC; Fig 5 , D ) were measured and calculated with image-analyzing software (Image Pro PLUS, Media Cybernetics, Silver Spring, Md).
Statistical analysis
Kruskal-Wallis and Mann-Whitney U tests with the Bonferroni adjustment were performed to investigate the effects of diameter and shape of OMIs on microdamage in the cortical bone during placement.
Results
There was no significant difference in thickness of the cortical bone adjacent to the OMIs among the 4 groups ( Table I ).
| Cortical bone thickness (mm) | |||
|---|---|---|---|
| Type | Mean | SD | P value |
| 1.5C (n = 7) | 0.71 | 0.17 | 0.887 |
| 1.5T (n = 7) | 0.65 | 0.11 | |
| 2C (n = 7) | 0.65 | 0.14 | |
| 2T (n = 5) ∗ | 0.69 | 0.11 | |
∗ During sawing, 2 blocks with 2T OMIs spontaneously cracked from stress concentration; this reduced the number of 2T samples from 7 to 5.
Although there was no significant difference in MIT between 2 groups with same diameter (1.5C and 1.5T) and 2 groups with different diameter and shape (1.5T and 2C), there was a significant increase in MIT correlated to increased diameter and presence of tapering ([1.5C, 1.5T] < [1.5T, 2C] < 2T) ( P <0.01, Table II ).
| MIT (N·cm) | Multiple comparison | |||||
|---|---|---|---|---|---|---|
| Type | Mean | SD | P value | 1.5T | 2C | 2T |
| 1.5C (n = 7) | 6.27 | 1.25 | 0.001 ‡ | 0.174 | 0.036 † | 0.036 † |
| 1.5T (n = 7) | 7.89 | 1.46 | 2.400 | 0.042 † | ||
| 2C (n = 7) | 8.59 | 1.14 | 0.042 † | |||
| 2T (n = 5) ∗ | 12.26 | 2.24 | ||||
∗ During sawing, 2 blocks with 2T OMIs spontaneously cracked from stress concentration; this reduced the number of 2T samples from 7 to 5
Similar to MIT, there was a significant increase in the NC with increased diameter and tapering ([1.5C, 1.5T] < [1.5T, 2C] < [2C, 2T]) ( P <0.01, Table III ). There was no significant difference in the NC between the cylindrical and tapered OMIs with the same diameter (1.5C and 1.5T, 2C and 2T, Table III ) and between a pair of groups with different diameters and shapes (1.5T and 2C, Table III ).
| NC | Multiple comparison | |||||
|---|---|---|---|---|---|---|
| Type | Mean | SD | P value | 1.5T | 2C | 2T |
| 1.5C (n = 7) | 14.57 | 3.26 | 0.002 ‡ | 2.004 | 0.042 † | 0.024 † |
| 1.5T (n = 7) | 16.14 | 2.67 | 0.312 | 0.042 † | ||
| 2C (n = 7) | 19.57 | 2.37 | 1.212 | |||
| 2T (n = 5) ∗ | 21.00 | 1.87 | ||||
∗ During sawing, 2 blocks with 2T OMIs spontaneously cracked from stress concentration; this reduced the number of 2T samples from 7 to 5
ACL and MRC had significant increases correlated with increased diameters of OMIs ([1.5C, 1.5T] < [2C, 2T]) ( P <0.001, Tables IV and V , respectively). However, there was no significant difference in ACL and MRC between OMIs with cylindrical and tapered shapes with the same diameter (1.5C and 1.5T, 2C and 2T;p Tables IV and V , respectively).
| ACL (μm) | Multiple comparison | |||||
|---|---|---|---|---|---|---|
| Type | Mean | SD | P value | 1.5T | 2C | 2T |
| 1.5C (n = 7) | 4190.99 | 2053.45 | 0.000 ‡ | 3.390 | 0.012 † | 0.024 † |
| 1.5T (n = 7) | 5536.64 | 1779.09 | 0.048 † | 0.042 † | ||
| 2C (n = 7) | 8456.67 | 1409.32 | 1.746 | |||
| 2T (n = 5) ∗ | 9857.44 | 1515.20 | ||||
∗ During sawing, 2 blocks with 2T OMIs spontaneously cracked from stress concentration; this reduced the number of 2T samples from 7 to 5
Stay updated, free dental videos. Join our Telegram channel
VIDEdental - Online dental courses


