Introduction
The influence of 4 commonly used fixed orthodontic appliances on artifact formation and diagnostic quality of magnetic resonance (MR) images of the head produced by a 3-T MR scanner was studied.
Methods
Stainless steel brackets, ceramic brackets, combination of ceramic brackets and steel molar tubes, and multistranded steel mandibular lingual retainers were embedded into custom-made trays for each of 10 adult subjects. Head MR scans of 9 regions were acquired for each subject wearing these trays. Sagittal T1-weighted, axial T2-weighted, axial gradient-recalled, axial diffusion-weighted, noncontrast axial MR angiography, and axial fluid-attenuated inversion recovery MR sequences were included. Two neuroradiologists evaluated image distortions and diagnostic qualities of the 1314 acquired images (13860 image slices).
Results
The images were affected by appliance, head region, and MR sequence. Stainless steel brackets and molar tubes affected the images the most, and ceramic brackets caused minimal image distortion.
Conclusions
Head MR images are differentially affected by orthodontic appliances. The appliance, region imaged, and MR sequence should be considered before imaging patients wearing fixed orthodontic appliances.
Highlights
- •
Effects of common fixed orthodontic appliance attachments on the quality of MR images were studied.
- •
Of all attachments tested, those made of steel worsened the quality of MR images the most.
- •
Ceramic brackets caused negligible effects on image quality.
- •
Images were differentially affected with different MR sequences.
- •
Images of different regions of the head were affected differentially.
Magnetic resonance (MR) imaging is a diagnostic modality widely used in medicine and dentistry for soft tissue imaging.
Metallic objects in the body including common orthodontic appliances can produce artifacts on MR images; they are defined as distortions of signal intensity or voids with no anatomic basis in the plane being imaged.
Although fixed multibracket orthodontic appliances cause image artifacts on MR images, the extent and severity of image loss is not clear from the literature. Consequently, to circumvent the problem of image artifacts caused by orthodontic appliances, orthodontists are often requested to remove fixed orthodontic appliances or fixed retainers before the planned MR scan, or orthodontic hardware is removed in emergency rooms of hospitals before an urgent MR examination. This increases the financial and biologic burdens, since removal and later reinstallation of fixed orthodontic appliances is costly and labor intensive. Debonding is also accompanied by risks of potential enamel loss, tear outs, and cracks.
Although a number of authors have investigated artifacts on MR images of the head caused by orthodontic appliances, the matter still remains controversial and unclear. Sadowsky et al and Hinshaw et al found that artifacts caused by stainless steel brackets and wires do cause some distortion of the MR image of the brain, but it still remains diagnostic. On the other hand, several other studies confirmed that orthodontic appliances can render temporomandibular joint (TMJ) and brain MR images undiagnostic. Some authors have reported that titanium caused only minor artifacts, but other researchers have stated the opposite. In addition, the effects of different types of commonly used fixed orthodontic appliances on the MR image quality have not been studied systematically. Elison et al undertook a structured investigation to study MR image distortions caused by steel, ceramic, composite, and titanium brackets on images acquired using an MR scanner with a 1.5-T (1.5-Tesla) magnet. Ceramic brackets without metal slots, composite, plastic, and titanium brackets were found not to cause significant distortion on the MR images taken with a 1.5-T scanner. In current practice of diagnostic imaging, 3-T MR machines are becoming increasingly popular because they offer better image resolution. Since the width of the artifact depends on the strength of the magnetic field among other factors, an appliance that is compatible with a 1.5-T MR scanner might not be compatible with a 3-T scanner.
Elison et al determined that of the 2 types of steel commonly used in fixed orthodontic appliances, 18-8 stainless steel did not cause deformation of the MR image in vitro as opposed to type 17-4 stainless steel that did. It was hypothesized that brackets made of 18-8 stainless steel would not cause significant MR image deformation, but this hypothesis was not tested systematically.
The aim of this study was to investigate in vivo the influence of several commonly used orthodontic appliances: stainless steel brackets and molar buccal tubes, ceramic brackets, combination of ceramic brackets and stainless steel molar buccal tubes, and multistranded stainless steel lingual retainers on the extent of artifact formation and the diagnostic quality of the MR images of the head obtained by a 3-T scanner using common MR image sequences. See Supplemental Materials for a short video presentation about this study.
Material and methods
In this clinical study, we assessed the influence of commonly used orthodontic appliances on the extent of artifact formation and the diagnostic quality of the MR images of the head in a sample of 10 adult volunteers. The study protocol was approved by the institutional Research Ethics Board of The Hospital for Sick Children and the Health Sciences Research Ethics Board of the University of Toronto before the study. Exclusion criteria were (1) pregnant women, (2) persons with metal objects in the body (eg, aneurysm clips, pacemakers, fixed orthodontic appliances, crowns and bridges, implants, amalgam restorations, traditional and cosmetic tattoos), (3) persons who needed sedation before MR imaging, (4) persons wearing drug patches, and (5) persons with monitoring equipment (eg, electrocardiography leads or respiratory monitoring leads) attached to their bodies. Informed consent was obtained from each volunteer before the study. There were 6 men and 4 women in the sample. Their median age was 29 years.
The tested appliances were the following.
- 1.
Stainless steel brackets made of 17-4 and 18-8 stainless steel components brazed together with silver alloy (Mini Master series; American Orthodontics, Sheboygan, Wis) for all teeth erupted anterior to the permanent first molars and bondable tubes for the molars made of the same materials in both maxillary and mandibular arches.
- 2.
Ceramic brackets (monocrystalline aluminum oxide, Radiance; American Orthodontics) for all teeth erupted anterior to the permanent first molars in both maxillary and mandibular arches, with no metal attachments for any teeth.
- 3.
Ceramic brackets (Radiance; American Orthodontics) for all teeth erupted anterior to the permanent first molars in both maxillary and mandibular arches and with 18-8 stainless steel single-piece bondable molar tubes (FLI; Rocky Mountain Orthodontics, Denver, Colo) for the molars in both arches.
- 4.
Mandibular 18-8 stainless steel multistranded wire 3-3 retainer (Tri-Flex; Rocky Mountain Orthodontics).
These appliances were incorporated into clear 0.035-in Essix ACE (GAC International, Bohemia, NY) retainers in a manner similar to that used in indirect bracket bonding. The Essix material used in this study has previously been used in MR imaging research and was reported not to have caused any measurable MR image deformation in 1.5-T and 0.5-T MR scanners. To verify whether the Essix retainer causes any significant MR image deformation under the conditions of this study in a 3-T MR scanner, a pilot test was done on 1 volunteer.
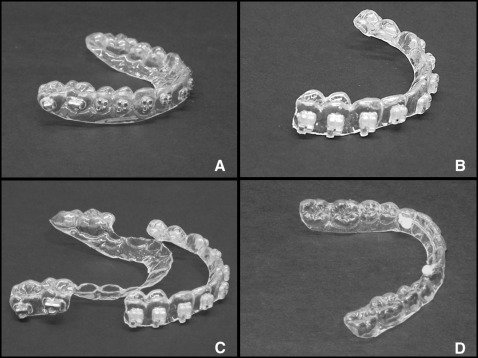
Maxillary and mandibular polyvinylsiloxane (Reflection; Patterson Dental, Saint Paul, Minn) impressions (putty-wash technique) were taken for a subject, and 4 sets of dental stone models were poured from the impressions. Maxillary and mandibular Essix retainers were fabricated on the models using a Biostar machine (Great Lakes Orthodontics, Tonawanda, NY). The 4 appliances tested were placed on the models using Transbond (3M Unitek, Monrovia, Calif). The appliances were incorporated into the maxillary and mandibular Essix retainers that were made over them using the Biostar machine. All appliances were made by 1 investigator (D.Z.). The retainers were checked for fit and comfort and adjusted as necessary. Figure 1 shows the appliances tested.

After this step, MR scans were acquired. The MR scans were acquired with a 12-channel head coil with the patient in supine position and wearing earplugs to reduce noise levels in a 3-T MAGNETOM (Siemens, Erlangen, Germany) MR scanner with and without the Essix retainers, as well as with 4 selected orthodontic appliances in random order, using the following sequences: sagittal T1-weighted (TR/TE = 1950.0/4.4 msec, 1 mm thick), axial T2-weighted (TR/TE = 4500.0/83.0 msec, 3.5 mm thick), axial gradient-recalled (TR/TE = 620.0/20.0 msec, 3.5 mm thick), axial diffusion-weighted (TR/TE = 5000.0/93.0 msec, 4 mm thick), noncontrast axial magnetic resonance angiography (TR/TE = 20.0/3.6 msec, 0.5 mm thick), and axial fluid attenuated inversion recovery (TR/TE = 9000.0/88.0 msec, 3.5 mm thick).
The resultant images were independently analyzed by 2 neuroradiologists (P.K. and P.M.) who routinely read MR scans of the brain and the TMJ. The diagnostic values of the scans with and without Essix retainers were determined using a modified receiver operating characteristic score system described by Elison et al ( Table I ). In this method of distortion classification, a score of 3 represented the cutoff for clinical usability. To develop verbal definitions of each distortion score, the images were discussed by the 2 reviewers and a senior neuroradiologist (M.S.) to establish consensus in regard to the definitions of the scores described in Table I .
| Score | Image appearance | Diagnostic/Nondiagnostic |
|---|---|---|
| 1 | No distortion/artifact | Diagnostic |
| 2 | Minimal distortion/artifact | Diagnostic |
| 3 | Moderate distortion/artifact | Moderately diagnostic |
| 4 | Severe distortion | Nondiagnostic |
| 5 | Complete obliteration | Nondiagnostic |
Nine regions of the head were assessed: base of the tongue, hard palate, body of the mandible, nasopharynx, globes of the eyes, pituitary gland, frontal lobe, temporal lobe, and brain stem. For the axial diffusion-weighted and axial gradient-recalled sequences, only the frontal and temporal lobes and the brain stem were assessed because these sequences are routinely used for assessment of the brain, and inclusion of the other anatomic regions would have resulted in artificially increased distortion scores for these sequences. No score was assigned to the anatomic region if it was not included in the scan. Whether a statistically significant difference existed in the diagnostic score of the scans with and without Essix retainers was determined by using an extension of the Wilcoxon signed rank test for clustered data.
After the pilot test, maxillary and mandibular polyvinylsiloxane impressions were taken for all participants. Three sets of dental stone models were poured from the impressions and trimmed. For each subject, the 4 appliances tested in this study were incorporated in Essix trays using the methods described previously. The retainers were checked for fit and comfort and adjusted if necessary. MR scans were acquired for the participants (with the appliances tested in the study embedded into Essix trays), in random order using the same MR sequences as in the pilot test. The total time each participant spent in the MR acquisition process (including the time for scanning, subject positioning, and setup) was about 2 hours. The resultant images were analyzed by the same 2 neuroradiologists described in the pilot study. The images were reviewed randomly and not in sequence for subjects 2 to 10. The 9 regions of the head described in the pilot study were assessed using the diagnostic score system described earlier. The data from the pilot test were included in the final analysis of data from a total of 10 subjects. For the intrarater reliability assessment, each radiologist was asked to reevaluate all images from 3 randomly selected subjects.
Statistical analysis
Statistical analysis was performed using SPSS software (version 21; IBM, Armonk, NY). The following tests were used.
- 1.
Kappa statistics for agreement within and between the raters. The diagnostic scores were grouped: 1 to 3 were reassigned as 1 (diagnostic scan), and 4 and 5 were assigned as 2 (nondiagnostic scan). Because the diagnostic score definitions were developed based on the raters’ collective discussion of the images of subject 1, kappa was calculated for the images of subjects 2 through 10 excluding subject 1 to prevent an artificially increased value for interrater agreement.
- 2.
The Wilcoxon signed rank test for clustered data (cluster signed-rank test) for the differences between materials, anatomic sites, and imaging sequences with regard to the image distortion scale rating. This nonparametric test was used because of the nonnormal distribution of the distortion scores determined by the Shapiro-Wilk test.
A P value of less than 0.05 was chosen to indicate statistical significance.
Results
Interrater kappa was 0.761, with a 95% confidence interval (CI) of 0.712 to 0.81 ( P <0.0001) (substantial agreement, Landis and Koch interpretation). Intrarater agreement was calculated for each reviewer after they independently rescored 3 randomly selected subjects. Intrarater agreement values were 0.559, 95% CI of 0.459 to 0.659 ( P <0.0001) (moderate agreement), for reviewer 1 and 0.667, 95% CI of 0.573 to 0.761 ( P <0.0001) (substantial agreement), for reviewer 2. The mean of the scores assigned by the 2 reviewers was used as the distortion score for each image.
In the pilot test, the mean diagnostic score for the Essix appliance was 1.89 ± 1.382 (all appliances, sequences, and reviewers were included; 38 images were analyzed). The mean diagnostic score for no appliance was 1.89 ± 1.362 (all appliances, sequences, and reviewers were included; 38 images were analyzed). There were no statistically significant differences between the distortion scores for Essix and no appliance. The mean diagnostic score for ceramic brackets was 1.82 ± 1.382 (all appliances, sequences, and reviewers were included; 38 images were analyzed). There were no statistically significant differences between the distortion scores for ceramic brackets and no appliance. Therefore, scans with no appliances or with only the Essix appliance were not performed for the subsequent subjects to decrease the burden on the participants and redundant use of highly specialized equipment and resources. Scores for ceramic brackets were chosen to serve as the gold standard for comparisons between different appliances.
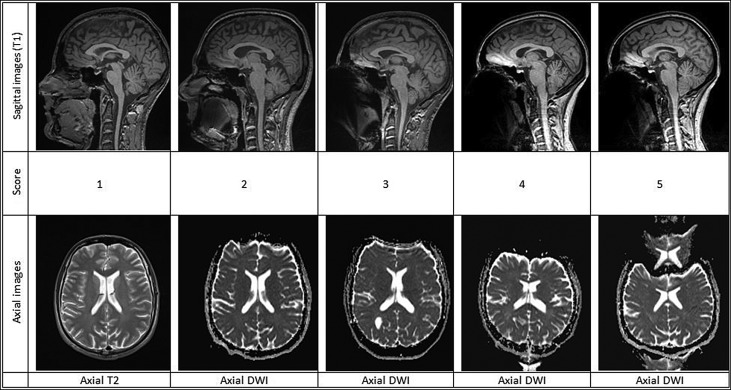
Examples of representative sagittal and axial images for scores 1 to 5 are given in Figure 2 (frontal lobe of the brain was scored). Mean distortion scores of different appliances for each subject, overall mean distortion scores for each appliance, and pairwise comparisons with ceramic brackets are given in Table II . There were statistically significant differences between the distortion scores for stainless steel brackets and molar tubes ( P = 0.0017), combination of ceramic brackets and stainless steel molar tubes ( P = 0.0021), and marginal differences with lingual retainers ( P = 0.085), when compared with the distortion scores for ceramic brackets.

| Subject | Stainless steel, mean (SD) | Ceramic, mean (SD) | Ceramic + stainless steel, mean (SD) | Lingual retainer, mean (SD) |
|---|---|---|---|---|
| 1 N for each appliance = 33 |
2.61 (1.69) | 1.39 (0.79) | 2.09 (1.38) | 1.64 (0.86) |
| 2 N for each appliance = 33 |
2.89 (1.57) | 1.59 (0.82) | 2.18 (1.38) | 1.85 (1.06) |
| 3 N for each appliance = 33 |
2.68 (1.56) | 1.70 (0.80) | 2.32 (1.38) | 1.74 (0.93) |
| 4 N for each appliance = 33 |
2.97 (1.49) | 1.89 (0.88) | 2.52 (1.35) | 1.86 (0.90) |
| 5 N for each appliance = 33 |
2.65 (1.49) | 1.67 (0.77) | 2.29 (1.21) | 1.82 (0.83) |
| 6 N for each appliance = 33 |
2.73 (1.60) | 1.58 (0.84) | 2.38 (1.33) | 1.91 (0.83) |
| 7 N for each appliance = 33 |
2.8 (1.28) | 1.59 (0.71) | 2.27 (1.06) | 2.08 (0.81) |
| 8 N for each appliance = 33 |
2.88 (1.49) | 1.61 (0.73) | 2.42 (1.44) | 1.92 (0.85) |
| 9 N for each appliance = 33 |
2.94 (1.58) | 2.12 (0.82) | 2.35 (1.29) | 1.95 (0.99) |
| 10 N for each appliance = 32 |
3.14 (1.25) | 2.30 (1.01) | 2.60 (1.10) | 1.92 (1.06) |
| Mean scores | 2.83 (1.50) | 1.74 (0.85) | 2.35 (1.29) | 1.87 (0.91) |
| Pairwise differences Ceramic vs other material |
1.09 (0.96) | – | 0.61 (0.79) | 0.14 (0.54) |
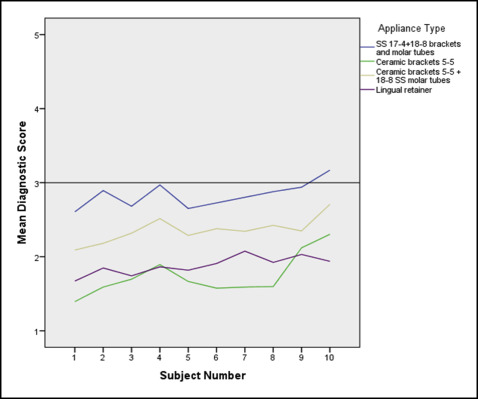
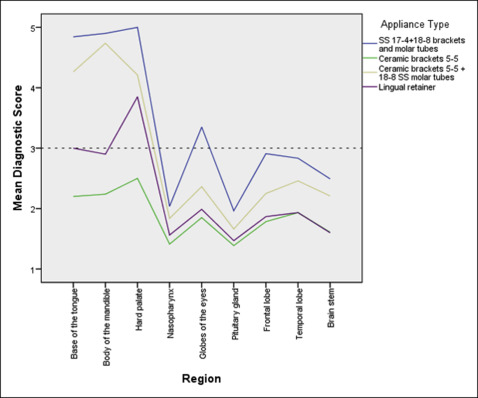
Figure 3 is a composite view of the mean distortion scores for the different appliances according to the subject. The mean distortion scores for subject 10 were higher than for the rest of the subjects. Comparisons of the distortion scores between the different anatomic regions are given in Table III and Figure 4 . There was a general trend for the regions farther from the teeth and orthodontic appliances to have lower diagnostic scores, although it is also apparent that images for certain tissues are more significantly affected than others despite their relatively greater distance from the appliances compared with other regions.

| Anatomic region | Stainless steel, mean (SD) | Ceramic, mean (SD) | Ceramic + stainless steel, mean (SD) | Lingual retainer, mean (SD) |
|---|---|---|---|---|
| Base of the tongue N for each appliance = 9 |
4.83 (0.35) | 2.20 (0.79) | 4.28 (0.36) | 2.88 (0.35) |
| Body of the mandible N for each appliance = 10 |
4.90 (0.21) | 2.30 (0.82) | 4.72 (0.36) | 3.85 (0.53) |
| Hard palate N for each appliance = 10 |
5.00 | 2.50 (0.82) | 4.22 (0.36) | 3.85 (0.53) |
| Nasopharynx N for each 40 |
2.04 (0.87) | 1.41 (0.52) | 1.84 (0.82) | 1.56 (0.62) |
| Globes of the eyes N for each appliance = 40 |
3.35 (1.27) | 1.85 (0.62) | 2.36 (0.97) | 1.96 (0.57) |
| Pituitary gland N for each appliance = 40 |
1.96 (0.68) | 1.39 (0.47) | 1.67 (0.54) | 1.44 (0.47) |
| Frontal lobe N for each appliance = 60 |
2.91 (1.46) | 1.78 (0.92) | 2.25 (1.22) | 1.87 (0.90) |
| Temporal lobe N for each appliance = 60 |
2.83 (1.48) | 1.93 (1.07) | 2.46 (1.36) | 1.93 (1.05) |
| Brain stem N for each appliance = 60 |
2.49 (1.68) | 1.61 (0.87) | 2.21 (1.44) | 1.60 (0.82) |

Table IV and Figure 5 illustrate mean diagnostic scores for different appliances according to the imaging sequence. Distortion scores for axial diffusion-weighted and gradient-recalled were higher than for the rest of the sequences. The scores for T2, magnetic resonance angiography and fluid attenuated inversion recovery sequences were below 3, in the diagnostic range.
| MR sequence | Metal | Ceramic | Ceramic + metal | Lingual retainer |
|---|---|---|---|---|
| Sagittal T1 N for each appliance = 89 |
3.66 (1.17) | 1.82 (0.79) | 3.07 (1.15) | 2.28 (0.92) |
| Axial T2 N for each appliance = 60 |
2.08 (0.91) | 1.40 (0.55) | 1.63 (0.61) | 1.42 (0.52) |
| Axial GRE N for each appliance = 30 |
4.68 (0.31) | 3.10 (0.51) | 4.05 (0.40) | 3.03 (0.37) |
| Axial DWI N for each appliance = 30 |
4.83 (0.27) | 2.93 (0.31) | 4.08 (0.47) | 3.00 (0.39) |
| Axial MRA N for each appliance = 60 |
1.32 (0.48) | 1.18 (0.34) | 1.25 (0.41) | 1.15 (0.32) |
| Axial FLAIR N for each appliance = 60 |
1.93 (0.85) | 1.26 (0.37) | 1.40 (0.35) | 1.28 (0.36) |
Table V and Figure 6 give mean diagnostic scores for the different anatomic regions according to the imaging sequence for stainless steel brackets and tubes. Stainless steel brackets and buccal tubes rendered the images nondiagnostic in 3-T cranial MR images for sagittal T1-weighted, axial gradient-recalled, and axial diffusion-weighted sequences.
| Anatomic region | Sagittal T1 | Axial T2 | Axial GRE | Axial DWI | Axial MRA | Axial FLAIR |
|---|---|---|---|---|---|---|
| Base of the tongue N = 10 |
4.83 (0.35) | – | – | – | – | – |
| Body of the mandible N = 10 |
4.90 (0.21) | – | – | – | – | – |
| Hard palate N = 10 |
5.00 | – | – | – | – | – |
| Nasopharynx N for each sequence = 10 |
3.30 (0.35) | 1.75 (0.49) | – | – | 1.35 (0.47) | 1.75 (0.42) |
| Globes of the eyes N for each sequence = 10 |
4.65 (0.41) | 3.80 (0.35) | – | – | 1.45 (0.64) | 3.50 (0.41) |
| Pituitary gland N for each sequence = 10 |
2.70 (0.59) | 1.95 (0.28) | – | – | 1.45 (0.64) | 1.75 (0.49) |
| Frontal lobe N for each sequence = 10 |
3.00 (0.24) | 2.10 (0.32) | 4.75 (0.26) | 4.75 (0.35) | 1.15 (0.24) | 1.70 (0.54) |
| Temporal lobe N for each sequence = 10 |
2.70 (0.42) | 1.80 (0.42) | 4.60 (0.32) | 4.90 (0.21) | 1.35 (0.41) | 1.65 (0.47) |
| Brain stem N for each sequence = 10 |
1.95 (0.50) | 1.05 (0.16) | 4.70 (0.35) | 4.85 (0.24) | 1.20 (0.35) | 1.20 (0.26) |
Table VI and Figure 7 show the mean diagnostic scores for ceramic brackets for different sequences and regions. Distortion scores for ceramic brackets for axial T1, axial T2, axial magnetic resonance angiography and axial fluid attenuated inversion recovery sequences were in the diagnostic range. For gradient-recalled and axial diffusion-weighted sequences, diagnostic scores for ceramic brackets were close to or slightly above 3. Mean diagnostic scores with standard deviations for the combination of ceramic brackets and steel molar buccal tubes for all regions and sequences are given in Table VII and illustrated in Figure 8 .
| Anatomic region | Sagittal T1 | Axial T2 | Axial GRE | Axial DWI | Axial MRA | Axial FLAIR |
|---|---|---|---|---|---|---|
| Base of the tongue N = 10 |
2.20 (0.79) | – | – | – | – | – |
| Body of the mandible N = 10 |
2.30 (0.82) | 1 | – | – | – | – |
| Hard palate N = 10 |
2.50 (0.82) | – | – | – | – | – |
| Nasopharynx N for each sequence = 10 |
1.80 (0.79) | 1.35 (0.41) | – | – | 1.15 (0.24) | 1.35 (0.24) |
| Globes of the eyes N for each sequence = 10 |
1.95 (0.80) | 2.35 (0.34) | – | – | 1.25 (0.35) | 1.85 (0.34) |
| Pituitary gland N for each sequence = 10 |
1.65 (0.58) | 1.4 (0.39) | – | – | 1.20 (0.48) | 1.30 (0.35) |
| Frontal lobe N for each sequence = 10 |
1.40 (0.57) | 1.20 (0.35) | 3.05 (0.37) | 2.90 (0.21) | 1.10 (0.21) | 1.05 (0.16) |
| Temporal lobe N for each sequence = 10 |
1.50 (0.53) | 1.15 (0.34) | 3.45 (0.44) | 3.20 (0.26) | 1.30 (0.48) | 1.00 |
| Brain stem N for each sequence = 10 |
1.10 (0.32) | 1.00 | 2.80 (0.67) | 2.70 (0.26) | 1.05 (0.16) | 1.00 |
Stay updated, free dental videos. Join our Telegram channel

VIDEdental - Online dental courses


