Introduction
In this study, we investigated the effects of the magnitudes of applied stress and growth status on the speed of tooth movement.
Methods
Eighty-two maxillary canines in 41 subjects were retracted for 84 days by estimated stresses of 4, 13, 26, 52, or 78 kPa applied continuously via segmental mechanics. Dental impressions made at intervals of 1 to 14 days resulted in 9 or 10 dental casts per subject. Three-dimensional tooth movements were quantified using these casts, custom reference templates, and a measuring microscope. Serial height and cephalometric measurements determined growth status.
Results
Distal tooth movement was linear with no lag phase in 96% of the teeth. Speeds averaged 0.028, 0.040, 0.050, 0.054, and 0.061 mm per day (standard errors, ± 0.004) for 4, 13, 26, 52, and 78 kPa, respectively. The maximum difference in speed between teeth was 9:1. Teeth moved significantly faster ( P <0.0001) in growing compared with nongrowing subjects, on average by 1.6-fold. Stress and speed of tooth movement were logarithmically related in growing (R 2 = 0.47) and nongrowing (R 2 = 0.34) subjects. Other tooth movements were relatively small, except for the distopalatal rotation of teeth moved by 78 kPa that averaged more than 19°.
Conclusions
The speed of retraction was logarithmically related to the applied stress and was significantly faster in actively growing subjects compared with those who were not growing.
The variables that affect the speed of tooth movement, such as applied stress magnitude and growth status, remain poorly understood. Previous reviews of the literature on optimal mechanics for maximizing the speed of tooth movement have demonstrated the paucity of data on this topic. Quinn and Yoshikawa proposed 4 hypotheses of the relationship between applied stress and velocity of tooth movement, with insufficient but tentative support for a linearly increasing speed of tooth movement up to a maximum at 7 to 14 kPa (100-200 cN for an average canine).
The relatively limited quantitative data available were further illustrated by a comprehensive review through 2001; only 17 animal studies and 4 human studies met reasonable inclusion criteria, and only 1 human study attempted to quantify applied stress. Consequently, the limited information on the rate of tooth movement and stress has challenged previous attempts to model these relations. Ren et al used published results from dogs and humans to develop a mathematical model for the relationship between speed and applied force. Their results showed widely scattered velocities of different-sized teeth moved by various protocols and in different species. They concluded that there is a dose-response relationship only for lower forces with a maximum predicted speed of 0.041 mm per day for 272 cN in humans. More recently, Van Leeuwen et al reported on tooth translation of first molars and second premolars relative to implant anchorage in dogs using a relatively disparate range of forces and where forces were systematically increased. Variability in the speed of tooth movement for an equivalent force (scaled to account for differences in root surface areas between molars and premolars) was high and estimated at more than 15:1. Despite the high variability, the authors suggested a logarithmic model, where only forces in the low range can affect the speed of tooth movement. Theoretical models involving finite element approaches and up-to-date methods for characterizing the anatomy of the teeth and surrounding structures might in the future be used to study this clinically important relationship. However, these theoretical approaches currently lack physiological and clinical data for patient-specific predictions and validations, respectively.
More recently, controlled tooth translational movements in humans were reported. Among individual teeth, the speeds of maxillary canine retraction differed by as much as 9:1. The combined results of these human studies suggested that 26 kPa was an optimal applied stress, and 0.063 mm per day was the average maximum mean speed of tooth movement. These data also demonstrated that mean speeds of tooth movement were about 2 times faster in growing subjects compared with subjects who showed no growth during orthodontic treatment.
To date, no statistically significant mathematical model has been proposed that relates the speed of tooth movement and applied mechanics in humans. Here, we report a model based on data collected from 41 subjects in whom determinant mechanics were used to translate the maxillary canines over 84 days.
Material and methods
The methods for recruitment and data collection were reported previously and are briefly described in the following paragraphs. Patients with good oral hygiene and at least 6 permanent teeth in each maxillary quadrant and who required bilateral maxillary canine retraction into the extracted maxillary first premolar sites were recruited for the study from the University of Missouri Kansas City Graduate Orthodontic Clinic. Forty-one subjects gave informed consent to participate according to the ethical standards of the appropriate institutional review boards. During the study, the subjects were instructed to rinse orally with chlorhexidine gluconate (Sunstar Americas, Inc, Chicago, Ill) twice daily and to avoid taking any other medications.
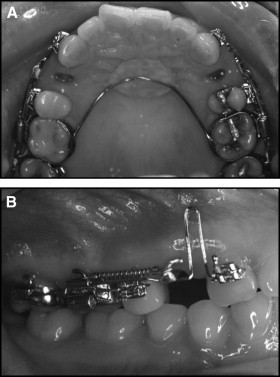
In each subject, the maxillary teeth were set up for segmental mechanics to translate the bilateral maxillary canines distally, whereas the mandibular teeth had no appliances. The anchorage included a Nance appliance and linking of the posterior teeth on each side with passive buccal stainless steel segment archwires of rectangular cross-section (≥0.016 × 0.018 in) plus figure-eight ligation ( Fig 1 ). Approximately 2 weeks after anchorage placement, the maxillary first premolars were removed; approximately 2 weeks later, at a time point defined as day 0, active retraction of the maxillary canines began. In brief, a 0.016 × 0.022-in diameter stainless steel auxiliary wire with a vertical loop just distal to the maxillary canine was constructed to extend passively from the maxillary first molar band’s auxiliary tube to the canine bracket. The height of this loop matched the canine’s center of resistance, relative to its root length, which was measured from a periapical radiograph of this tooth corrected for magnification, according to the relationship: center of resistance = 0.24 root length. The vertical-loop auxiliary wire was made passive initially, ligated to the canine bracket with a stainless steel tie and an elastomeric tie overlay, and then activated by a nickel-titanium coil spring, calibrated at mouth temperature (see the study of Iwasaki et al for details of the methods), stretched between hooks on the molar band and on the auxiliary wire just distal to the loop ( Fig 1 ). This caused separation of the vertical legs of the loop, creating both a retraction force and apicodistal counter-moment at the canine bracket that was designed to result in translation of the canine with respect to the posterior anchorage. The force required for a given stress level (4, 13, 26, 52, or 78 kPa) was determined by dividing the stress by the maxillary canine’s estimated distal root surface area ( A ) involved in periodontal ligament compression during canine retraction. This estimate took into account root curvature in cross section, whereby A = root length × a (1 – b 2 /a 2 ) 1/2 , where a is half the labiopalatal width of the canine at the cementoenamel junction, and b is half the mesiodistal width of the canine at the cementoenamel junction. On average, loads corresponded to forces of approximately 18, 60, 120, 240, and 360 cN, respectively ( Fig 1 ). A balanced incomplete block design was used to assign 2 different stresses per subject, and these were further assigned randomly to the right or left side.
On days 0, 1, 3, ±7, 14, 28, 42, 56, 70, and 84, the subjects had their modified gingival index scored, a supragingival oral prophylaxis, and a maxillary dental impression with a custom tray with polyvinylsiloxane. From these impressions, a set of 9 or 10 dental casts and a set of 3 custom acrylic templates (posterior, and right and left canines) were constructed for each subject ( Fig 2 ) and used with a measuring microscope (MM-11 Measurescope; Nikon, Melville, NY) to quantify the 3-dimensional tooth movements. Repeated measurement errors for this technique were ≤0.07 mm and ≤0.63°.
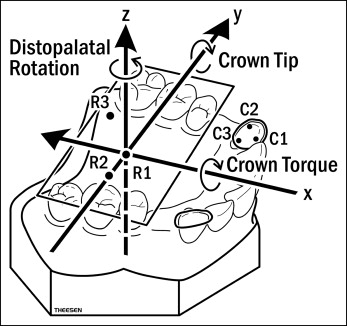
For each maxillary canine, movements in 3 linear aspects (distal, lateral, and extrusion) and 3 angular aspects (distal crown tip, lateral crown torque, and distopalatal rotation) were plotted vs time to assess the nature and amount of movement during the study. The slope of the movement vs time plot determined the speed. Craniofacial growth via serial lateral cephalometric superimpositions and height measurements during orthodontic treatment were used to determine growth status as positive (grower) or negative (nongrower) by presence or absence, respectively, of a demonstrated change. Repeated measures analysis of variance and Tukey-Kramer post-hoc tests were used to evaluate the effects of mechanical stress and growth status on the speed of tooth movement.
Results
Twenty-four female and 17 male subjects, ages 10.1 to 30.9 years (mean age, 14.8 ± 3.9 years) participated ( Table ). Of these, 30 subjects were growers (17 female, 13 male), and 11 subjects (7 female, 4 male) were nongrowers ( Table ). Subjects had average modified gingival index scores of 0.1 ± 0.1, indicating good oral hygiene with minimal visible signs of inflammation. Posterior anchorage was preserved (≤1.0 mm change) for all subjects as verified by cephalometric superimpositions before day 0 and after day 84, or the generally acceptable fit of the custom posterior template on all casts for a subject. Most subjects came to each scheduled study visit, but 13 subjects came on at least 1 day that differed from the scheduled day by 1 to 8 days; 5 subjects missed 1 day on day 28 or later, and 1 subject missed days 42 and 70.
| Subject | Age (y) | Growth status | Side | Stress (kPa) | Speed (mm/day) | R 2 |
|---|---|---|---|---|---|---|
| 1F1 | 12.2 | Grower | Right | 4 | 0.029 | 0.97 |
| Left | 13 | 0.046 | 0.97 | |||
| 1F2 | 14.8 | Grower | Right | 4 | 0.020 | 0.97 |
| Left | 13 | 0.018 | 0.91 | |||
| 1F3 | 13.2 | Grower | Right | 4 | 0.048 | 0.99 |
| Left | 13 | 0.049 | 0.94 | |||
| 1F4 | 13.3 | Grower | Left | 4 | 0.019 | 0.86 |
| Right | 13 | 0.052 | 0.97 | |||
| 1F5 | 14.4 | Grower | Left | 4 | 0.022 | 0.90 |
| Right | 13 | 0.026 | 0.99 | |||
| 2F1 | 30.9 | Nongrower | Right | 13 | 0.012 | 0.66 |
| Left | 26 | 0.013 | 0.73 | |||
| 2F2 | 15.1 | Nongrower | Left | 13 | 0.021 | 0.88 |
| Right | 26 | 0.022 | 0.93 | |||
| 2F3 | 16.1 | Nongrower | Right | 13 | 0.033 | 0.96 |
| Left | 52 | 0.052 | 0.88 | |||
| 2F4 | 12.8 | Grower | Left | 13 | 0.052 | 0.90 |
| Right | 26 | 0.053 | 0.84 | |||
| 2F5 | 10.4 | Grower | Right | 13 | 0.045 | 0.86 |
| Left | 52 | 0.056 | 0.95 | |||
| 3F1 | 16.1 | Grower | Right | 26 | 0.067 | 0.98 |
| Left | 52 | 0.060 | 0.99 | |||
| 3F2 | 13.2 | Grower | Right | 26 | 0.060 | 0.98 |
| Left | 52 | 0.065 | 0.99 | |||
| 3F3 | 24.6 | Nongrower | Right | 26 | 0.062 | 0.99 |
| Left | 52 | 0.066 | 0.99 | |||
| 3F4 | 11.5 | Grower | Left | 26 | 0.091 | 0.99 |
| Right | 52 | 0.081 | 0.99 | |||
| 3F5 | 15.2 | Grower | Left | 13 | 0.049 | 0.99 |
| Right | 26 | 0.070 | 0.99 | |||
| 4F1 | 13.3 | Grower | Right | 52 | 0.079 | 0.97 |
| Left | 78 | 0.090 | 0.99 | |||
| 4F2 | 12.8 | Grower | Right | 78 | 0.059 | 0.95 |
| Left | 52 | 0.071 | 0.94 | |||
| 4F3 | 12.2 | Grower | Right | 26 | 0.037 | 0.94 |
| Left | 78 | 0.072 | 0.98 | |||
| 4F4 | 11.8 | Grower | Right | 78 | 0.109 | 0.98 |
| Left | 13 | 0.075 | 0.98 | |||
| 4F5 | 17.9 | Nongrower | Right | 26 | 0.028 | 0.98 |
| Left | 78 | 0.029 | 0.87 | |||
| 4F6 | 10.8 | Grower | Right | 78 | 0.061 | 0.96 |
| Left | 52 | 0.048 | 0.99 | |||
| 5F1 | 14.2 | Nongrower | Right | 4 | 0.032 | 0.98 |
| Left | 78 | 0.049 | 0.92 | |||
| 5F2 | 17.6 | Nongrower | Right | 78 | 0.066 | 0.98 |
| Left | 4 | 0.024 | 0.96 | |||
| 5F3 | 10.1 | Grower | Right | 4 | 0.052 | 0.92 |
| Left | 78 | 0.094 | 0.74 | |||
| 1M1 | 16.2 | Grower | Left | 4 | 0.016 | 0.73 |
| Right | 13 | 0.024 | 0.90 | |||
| 1M2 | 13.9 | Grower | Left | 4 | 0.042 | 0.87 |
| Right | 13 | 0.066 | 0.93 | |||
| 2M1 | 17.9 | Nongrower | Left | 13 | 0.015 | 0.88 |
| Right | 52 | 0.037 | 0.76 | |||
| 2M2 | 12.9 | Grower | Right | 13 | 0.057 | 0.91 |
| Left | 26 | 0.043 | 0.93 | |||
| 2M3 | 14.2 | Grower | Left | 13 | 0.068 | 0.96 |
| Right | 52 | 0.063 | 0.92 | |||
| 3M1 | 12.5 | Grower | Right | 26 | 0.072 | 0.98 |
| Left | 52 | 0.059 | 0.99 | |||
| 3M2 | 13.8 | Grower | Left | 26 | 0.097 | 0.99 |
| Right | 52 | 0.084 | 0.99 | |||
| 3M3 | 12.2 | Grower | Right | 26 | 0.090 | 0.98 |
| Left | 52 | 0.080 | 0.99 | |||
| 3M4 | 16.3 | Grower | Right | 26 | 0.054 | 0.96 |
| Left | 52 | 0.034 | 0.99 | |||
| 3M5 | 14.1 | Grower | Left | 13 | 0.046 | 0.99 |
| Right | 26 | 0.058 | 0.99 | |||
| 4M2 | 14.2 | Grower | Right | 78 | 0.065 | 0.98 |
| Left | 13 | 0.061 | 0.98 | |||
| 4M3 | 16.1 | Grower | Right | 13 | 0.037 | 0.95 |
| Left | 78 | 0.051 | 0.92 | |||
| 5M1 | 12.6 | Grower | Right | 78 | 0.060 | 0.97 |
| Left | 4 | 0.031 | 0.86 | |||
| 5M2 | 11.8 | Grower | Right | 4 | 0.024 | 0.80 |
| Left | 78 | 0.093 | 0.98 | |||
| 5M3 | 13.7 | Grower | Right | 4 | 0.046 | 0.13 |
| Left | 78 | 0.076 | 0.81 | |||
| 5M4 | 22.5 | Nongrower | Right | 78 | 0.052 | 0.79 |
| Left | 4 | 0.029 | 0.41 | |||
| 5M5 | 17.0 | Grower | Right | 4 | 0.013 | 0.50 |
| Left | 78 | 0.039 | 0.94 |
Stay updated, free dental videos. Join our Telegram channel
VIDEdental - Online dental courses


