Introduction
The purposes of this study were to assess the effects of maxillary protraction therapy on the pharyngeal airways in patients with repaired unilateral cleft lip and palate (UCLP) 3 dimensionally.
Methods
Eighteen patients with repaired UCLP and anterior crossbite (ages, 10.4 ± 1.3 years) were enrolled in the study group. Hyrax appliances and reverse headgears were used. Cone-beam computed tomography volume scans were taken before and immediately after treatment. Fourteen patients (ages, 9.6 ± 1.7 years) with UCLP who did not receive orthopedic treatment served as the control group. The volumes of the pharyngeal airways, cross-sectional areas, sagittal diameters, and transversal diameters of 3 levels of airway cross-section were measured.
Results
After protraction, the volumes of the pharyngeal airway increased significantly. Cross-sectional area, sagittal diameter, and transversal diameter of the upper and lower pharyngeal airways also had significant increases. These changes were significant when compared with the untreated subjects except for the transversal diameter of the lower pharyngeal airway. Dimensions of the middle pharyngeal airway remained unchanged.
Conclusions
Maxillary protraction therapy significantly affects airway dimensions in patients with repaired UCLP 3 dimensionally.
Highlights
- •
Maxillary protraction of pharyngeal airways in patients with repaired unilateral cleft lip and palate was evaluated.
- •
Patients were successfully treated with advancement of the maxilla and rotation of the mandible.
- •
Volumes of the pharyngeal airway increased.
- •
Dimensions of the upper and lower pharyngeal airways increased.
- •
The middle pharyngeal airway remained unchanged during treatment.
Patients with cleft lip and palate (CLP) are usually characterized by maxillary retrusion and anterior crossbite after cleft repair. Midface retrusion in patients with CLP often results in personal, social, and psychological problems, along with functional difficulties. Maxillary protraction is an effective way to relieve mild to moderate anterior crossbite for preadolescents, and it will lead to skeletal changes as well as improvements in the lateral profile. Normalization of the sagittal jaw relationship and elimination of the dysfunction will result in normal function and mastication. Since improvements of the soft tissue profile and the sagittal jaw relationship in early childhood are obviously important, maxillary protraction has been recommended.
Pharyngeal size plays an important role in speech and respiratory function. It is well known that many patients with CLP still have speech problems even after palatoplasty surgery. In addition, it was reported that patients with CLP had an increased risk of obstructive sleep apnea. The pharynx is close behind the maxilla and the mandible. Movement of the jaws may have an effect on the dimensions of the pharyngeal airway. Several studies have reported the skeletal response of maxillary protraction in patients with CLP. However, only a limited number of reports have explored the effects of maxillary protraction on the pharynx, and most focused on noncleft patients. Moreover, those studies were all based on cephalograms; thus, only sagittal depth of the pharyngeal airway was assessed.
Therefore, the aim of this study was to assess the effects of maxillary protraction therapy on the pharyngeal airway in patients with repaired unilateral CLP (UCLP) 3 dimensionally.
Material and methods
A longitudinal study was carried out according to the Declaration of Helsinki guidelines and approved by the ethics committee of Peking University in Beijing, China. All patients in the study group and their parents were informed of the purpose of this study and signed an informed consent form.
The study group was selected according to the following screening criteria: (1) operated nonsyndromic UCLP, (2) concave profile with overjet between –4 and 0 mm, (3) palatoplasty surgery before 3 years old, (4) no pharyngeal flap surgery, and (5) growth of body height had not accelerated. Patients who met the screening criteria were asked to have a cone-beam computed tomography (CBCT) scan. Also, from the CBCT synthetic cephalograms, patients whose cervical vertebral maturation stage was 1 or 2 and whose ANB angle was between −4° and 0° were included.
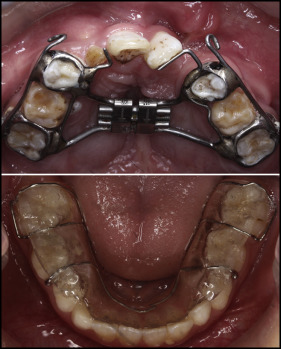
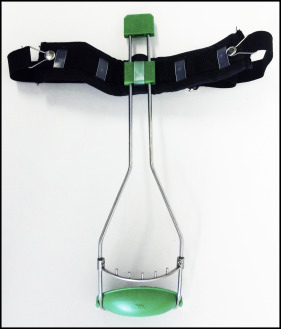
Patients in the study group were treated by an author (W.L.). Hyrax appliances with bands on the first molars and premolars (or deciduous molars) were used. The hyrax appliance incorporated the maxillary left and right first molars and premolars (or deciduous molars); this made a firm anchorage to transfer the orthopedic force effectively to the maxilla through the teeth during protraction. Two hooks were soldered and extended from the permanent first molars to the region of the deciduous molars or premolars. The transverse dimensions of the maxillary dental arches were sufficient in all patients; thus, maxillary expansion was not conducted. Bite-block appliances in the mandibular arch were used to eliminate incisor interference ( Fig 1 ). The patients were instructed to wear facemasks (Tiantian Dental Equipment, Hunan, China; Fig 2 ) for at least 12 hours per day. The protraction force was 450 to 500 g equally on both sides and directed 20° to 30° downward and forward in relation to the occlusal plane. Maxillary protraction was stopped after achieving about 2 mm of positive overjet, occluding the posterior teeth, and after at least 8 months of treatment.
CBCT volume scans were taken before (T0) and immediately after treatment (T1) using a dental-imaging system (DCT Pro; VATECH, Gyeonggi-do, Korea). All CBCT scans were taken with the following conditions: sitting position, natural head position, intercuspal occlusion, tongue in a relaxed position, and natural breath. The imaging protocol used a 20 × 19-cm field of view to include the entire craniofacial anatomy. The voxel resolution was 0.4 mm. The CBCT data sets were exported in DICOM file format.
For ethical reasons, we did not include a prospective control group. Instead, retrospective longitudinal data, derived from the computed tomography database of Peking University’s CLP treatment center, served as the control group. The data sets were acquired using a high-resolution multidetector computed tomography (MDCT) device (BrightSpeed Edge; General Electric, Fairfield, Conn). MDCT volume scans were taken with the following conditions: supine position, Frankfort horizontal plane perpendicular to the floor, intercuspal occlusion, tongue in a relaxed position, and natural breath. The slice thickness was 1.25 mm. The inclusion criteria were the same as for the study group. Two sets of MDCT images at a time interval of 6 to 24 months were required. The patients did not receive orthopedic treatment because maxillary protraction was not offered when they were treated. They also did not receive pharyngoplasty surgery, tonsillectomy, or adenoidectomy during the observation period. Fourteen patients (9 boys, 5 girls) were included in the control group. The mean age of the patients at the first observation (T0) was 9.6 ± 1.7 years (range, 6.9-12.8 years). The MDCT data sets were also exported in DICOM file format.
When calculating the sample size needed in the study group, both the treatment effect and the variance of the difference were set at 1.5 mm according to the results of a previous study. The power was set at 0.75, and the significance level was set at 0.05. Then the sample size was calculated using PASS software (version 11.0; NCSS, Silver Spring, Md). The minimum size needed was 16 in the treated group. To allow for losses, 20 patients who met the criteria were asked to participate the study. However, 2 refused to participate because of the remoteness of their home. Thus, 18 children (13 boys, 5 girls) were included in the study group. Their mean age at T0 was 10.4 ± 1.3 years (range, 7.6-12.4 years).
Using software (version 11.7; Dolphin Imaging & Management Solutions, Chatsworth, Calif), sagittal, axial, and coronal slices as well as the 3-dimensional (3D) reconstructions of the images were created. Landmarks used for setting reference planes and measurement planes are illustrated in Table I . The 3D reference system was constructed as follows: basion was selected as the origin of coordinates. The horizontal plane was parallel to the Frankfort horizontal plane, which was constructed on the bilateral porions and the noncleft side of orbitale. The midsagittal plane was drawn perpendicular to the horizontal plane, passing through sella and basion. The coronal plane was at right angles to the horizontal plane and the midsagittal plane, passing through basion.
| Landmark | Definition |
|---|---|
| S | Sella, center of sella turcica |
| N | Nasion, most anterior point of the frontonasal suture in the median plane |
| Ba | Basion, most anterior point of the foramen magnum |
| Po | Porion, most superior point of each external acoustic meatus |
| Or | Orbitale, most inferior point of each infraorbital rim |
| PM | Posterior maxilla, most posterior point of the hard palate on the noncleft side |
| U | Tip of the uvula |
| A | Point of maximum concavity in the alveolar process of the maxilla |
| B | Point of maximum concavity in the alveolar process of the mandible |
| Go | Gonion, point of maximum convexity at the mandibular angle on each side |
| Me | Menton, most inferior point of the chin on the outline of the mandibular symphysis |
| EP | Tip of the epiglottis |
The spatial positions of each landmark were represented as numeric values on each axis. The coordinates of all landmarks were then exported to an Excel spreadsheet (version 15.0; Microsoft, Redmond, Wash). Measurements of the dentofacial morphology were calculated based on the coordinates of the related landmarks.
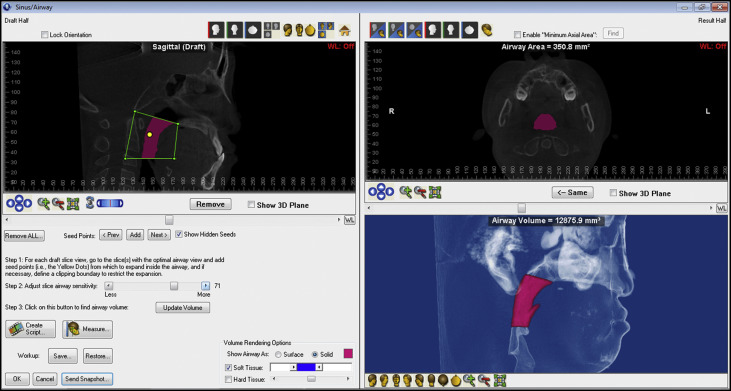
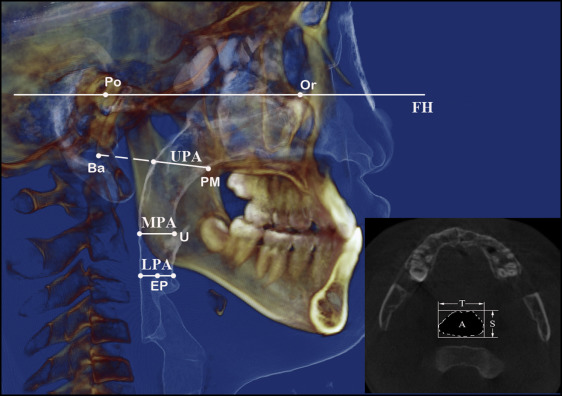
The volume of the pharyngeal airway was calculated using the sinus/airway module of the Dolphin Imaging software. The superior limit of the pharyngeal airway was taken as a line connecting the posterior maxilla and basion. The inferior limit was taken as a line parallel to the Frankfort horizontal plane, passing through the tip of the epiglottis. The posterior limit was delimited by the posterior pharyngeal wall, and the anterior limit was delimited by the anterior wall of the pharynx, soft palate, and tongue. After the boundary was confirmed, a seed point was added in the airway cavity. The detection sensitivity of the airway space was set individually. The seed point extended to the area that had a similar gray scale according to the detection sensitivity. Then the airway volume was calculated automatically ( Fig 3 ). Areas, sagittal diameters, and transversal diameters of the 3 levels of airway cross-sections were measured. The most superior and inferior cross-sectional planes of the pharyngeal airway were defined as the upper pharyngeal airway (UPA) and the lower pharyngeal airway (LPA). The cross-sectional plane passing through the tip of the uvula and parallel to the Frankfort horizontal plane was defined as the middle pharyngeal airway (MPA). The images of UPA, LPA and MPA were exported in JPEG file format. Dimensions of the 3 planes were measured using Photoshop (version 12.0; Adobe Systems, San Jose, Calif) image processing software ( Fig 4 ).
Statistical analysis
Paired t tests were used to assess the changes during the treatment or the observation period in the 2 groups. An independent-sample t test was carried out to compare the T0 and T1 measurements and the T1 to T0 changes between the groups. The data were analyzed with software (version 11.0; SPSS, Chicago, Ill). Statistical significance was tested at P <0.001, P <0.01, and P <0.05.
For the error measurements, 5 randomly selected pairs of MDCT and CBCT data sets were measured twice by Z.F., at an interval of 2 weeks. Correlations and mean differences between the double measurements were then analyzed.
Results
The intraclass correlation coefficients between the double measurements were all over 0.9, indicating high reliability. Mean differences between the double measures and the intraclass correlation coefficient values are shown in Table II .
| Measured variable | Mean difference (SD) | ICC |
|---|---|---|
| Dentofacial morphology | ||
| SNA′ (°) ∗ | 0.11 (0.63) | 0.99 |
| SNB′ (°) ∗ | 0.05 (0.49) | 0.99 |
| ANB′ (°) ∗ | 0.01 (0.37) | 0.98 |
| MP′/SN (°) † | 0.08 (1.11) | 0.98 |
| Volume (mm 3 ) | 278.5 (568.22) | 1.00 |
| Upper pharyngeal airway | ||
| Area (mm 2 ) | 16.99 (32.19) | 0.97 |
| Sagittal diameter (mm) | 0.60 (1.75) | 0.97 |
| Transversal diameter (mm) | 0.46 (0.49) | 0.99 |
| Middle pharyngeal airway | ||
| Area (mm 2 ) | 5.16 (10.17) | 1.00 |
| Sagittal diameter (mm) | 0.02 (0.68) | 0.98 |
| Transversal diameter (mm) | 0.35 (0.59) | 0.99 |
| Lower pharyngeal airway | ||
| Area (mm 2 ) | 2.26 (15.62) | 0.97 |
| Sagittal diameter (mm) | 0.12 (0.44) | 0.98 |
| Transversal diameter (mm) | 0.42 (0.76) | 0.98 |
∗ SNA′, SNB′, and ANB′ are the projections of the SNA, SNB, and ANB angles on the midsagittal plane, respectively.
† MP′ is the projection of the mandibular plane (constructed on menton and the midpoint of right and left gonions) on the midsagittal plane.
All 18 patients in the study group were successfully treated. Age distribution, treatment or observation duration, and sex distribution showed no significant differences between the groups, as illustrated in Tables III and IV .
| Treated patients | Untreated patients | P | |||
|---|---|---|---|---|---|
| Mean (range) | SD | Mean (range) | SD | ||
| T0 (y) | 10.37 (7.58-12.42) | 1.31 | 9.62 (6.92-12.83) | 1.74 | 0.173 |
| T1 (y) | 11.81 (9.08-14.58) | 1.52 | 10.96 (8.75-13.83) | 1.72 | 0.153 |
| Duration (mo) | 17.17 (8.00-26.00) | 5.43 | 16.14 (8.00-24.00) | 5.88 | 0.613 |
| Male | Female | Total | P (Fisher exact test) | |
|---|---|---|---|---|
| Treated patients | 13 | 5 | 18 | 0.712 |
| Untreated patients | 9 | 5 | 14 | |
| Total | 22 | 10 | 32 |
After treatment with maxillary protraction, the projection of the SNA angle on the midsagittal plane (SNA′) increased by 1.75° ± 1.83° ( P <0.001), the projection of the SNB angle on the midsagittal plane (SNB′) decreased by 1.81° ± 1.43° ( P <0.001), the projection of the ANB angle on the midsagittal plane (ANB′) increased by 3.56° ± 1.71° ( P <0.001), and the projection of the mandibular plane on the midsagittal plane (MP′/SN) increased by 2.22° ± 1.93° ( P <0.001; Table V ). The differences in these changes were significant when compared with the untreated subjects ( P <0.05; Table V ).
| Control group | Treated group | Differences between groups | |||||||
|---|---|---|---|---|---|---|---|---|---|
| T0 | T1 | Change | T0 | T1 | Change | T0 | T1 | Change | |
| Dentofacial morphology | |||||||||
| SNA′ (°) ∗ | 76.31 ± 2.80 | 75.10 ± 2.51 | −1.21 ± 0.91 ¶ | 75.02 ± 3.66 | 76.77 ± 3.95 | 1.75 ± 1.83 ¶ | −1.29 ± 1.18 NS |
1.67 ± 1.21 NS |
2.97 ± 0.53 § |
| SNB′ (°) ∗ | 77.64 ± 3.09 | 78.56 ± 4.13 | 0.92 ± 2.57 NS |
77.14 ± 4.05 | 75.33 ± 4.59 | −1.81 ± 1.43 ¶ | −0.51 ± 1.31 NS |
−3.23 ± 1.57 ‡ | −2.73 ± 0.71 § |
| ANB′ (°) ∗ | −1.34 ± 3.64 | −3.47 ± 4.46 | −2.13 ± 2.25 § | −2.12 ± 1.79 | 1.44 ± 2.32 | 3.56 ± 1.71 ¶ | −0.78 ± 0.98 NS |
4.91 ± 1.22 ¶ | 5.69 ± 0.70 § |
| MP′/SN (°) † | 37.50 ± 5.05 | 37.08 ± 4.40 | −0.42 ± 3.21 NS |
37.77 ± 5.17 | 39.99 ± 5.91 | 2.22 ± 1.93 ¶ | 0.27 ± 1.82 NS |
2.92 ± 1.89 NS |
2.64 ± 0.91 § |
| Pharyngeal airway | |||||||||
| Total volume (mm 3 ) | 9162.9 ± 2226.4 | 9248.1 ± 3236.5 | 85.3 ± 3490.1 NS |
9915.7 ± 3748.7 | 12917.6 ± 5192.8 | 3001.9 ± 4128.0 § | 752.8 ± 1133.1 NS |
3669.4 ± 1586.4 ‡ | 2916.6 ± 1377.1 ‡ |
| Upper pharyngeal airway | |||||||||
| Area (mm 2 ) | 287.52 ± 72.74 | 268.38 ± 43.98 | −19.14 ± 62.67 NS |
419.78 ± 106.55 | 483.09 ± 117.66 | 63.30 ± 87.33 § | 132.26 ± 33.29 ¶ | 214.70 ± 33.20 ¶ | 82.44 ± 27.66 § |
| Sagittal diameter (mm) | 20.62 ± 3.94 | 19.94 ± 2.54 | −0.69 ± 2.67 NS |
24.49 ± 5.78 | 26.82 ± 5.21 | 2.32 ± 4.46 ‡ | 3.87 ± 1.81 ‡ | 6.88 ± 1.52 ¶ | 3.01 ± 1.35 ‡ |
| Transversal diameter (mm) | 24.74 ± 3.50 | 23.79 ± 2.30 | −0.94 ± 3.40 NS |
29.53 ± 3.13 | 30.84 ± 3.42 | 1.31 ± 2.18 ‡ | 4.80 ± 1.17 ¶ | 7.05 ± 1.06 ¶ | 2.25 ± 0.99 ‡ |
| Middle pharyngeal airway | |||||||||
| Area (mm 2 ) | 151.06 ± 73.10 | 146.39 ± 56.45 | −4.68 ± 86.19 NS |
223.82 ± 81.77 | 246.78 ± 98.77 | 22.97 ± 85.87 NS |
72.75 ± 27.84 ‡ | 100.39 ± 29.62 § | 27.64 ± 30.65 NS |
| Sagittal diameter (mm) | 11.65 ± 2.94 | 11.00 ± 2.68 | −0.65 ± 3.25 NS |
14.85 ± 3.05 | 14.92 ± 3.16 | 0.07 ± 2.89 NS |
3.20 ± 1.07 § | 3.92 ± 1.06 ¶ | 0.72 ± 1.09 NS |
| Transversal diameter (mm) | 18.19 ± 5.96 | 19.16 ± 4.20 | 0.96 ± 5.47 NS |
23.02 ± 4.62 | 24.43 ± 5.35 | 1.41 ± 4.53 NS |
4.83 ± 1.87 ‡ | 5.27 ± 1.74 § | 0.44 ± 1.77 NS |
| Lower pharyngeal airway | |||||||||
| Area (mm 2 ) | 154.31 ± 48.25 | 160.92 ± 53.53 | 6.60 ± 57.71 NS |
162.54 ± 60.19 | 213.42 ± 70.71 | 50.88 ± 61.44 § | 8.23 ± 19.72 NS |
52.51 ± 22.75 ‡ | 44.28 ± 21.33 ‡ |
| Sagittal diameter (mm) | 8.39 ± 3.76 | 7.38 ± 3.24 | −1.01 ± 2.64 NS |
9.31 ± 2.39 | 10.94 ± 2.77 | 1.63 ± 1.86 § | 0.92 ± 1.09 NS |
3.57 ± 1.06 § | 2.65 ± 0.80 § |
| Transversal diameter (mm) | 18.53 ± 5.54 | 21.10 ± 5.77 | 2.57 ± 3.98 ‡ | 25.06 ± 2.40 | 28.22 ± 3.13 | 3.16 ± 3.12 ¶ | 6.53 ± 1.45 ¶ | 7.12 ± 1.59 ¶ | 0.59 ± 1.26 NS |
Stay updated, free dental videos. Join our Telegram channel
VIDEdental - Online dental courses


