Introduction
In this study, we aimed to evaluate and compare blood-flow changes in the pulp tissues of maxillary molars over a 6-month period after orthodontic intrusion using different magnitudes of force.
Methods
Twenty patients were randomly divided into 2 groups (n = 10) according to the amount of intrusive force applied. An intrusive force of either 125 g (light) or 250 g (heavy) was applied to the overerupted maxillary first molars using mini-implants; no force was applied to the contralateral molars. Laser Doppler flowmetry was used to measure pulpal blood flow (PBF) at baseline and during intrusion at 24 hours, 3 days, 7 days, 3 weeks, 4 weeks, 3 months, and 6 months. The data were analyzed with the Mann-Whitney U and Wilcoxon signed rank tests, with P <0.05 considered statistically significant.
Results
PBF decreased significantly at 3 days and continued to remain suppressed until 3 weeks, after which a gradual trend of recovery was observed until 3 months, when the levels returned to near those measured before intrusion. When the data were analyzed with regard to the amount of applied force, significant differences were observed between the 2 groups only at 3 and 7 days.
Conclusions
These findings demonstrate that despite slight regressive changes in pulpal tissue over the short term, PBF values tend to return to their initial levels within 3 months, indicating that changes observed in PBF are reversible, even during radical intrusions of molars with 125 and 250 g of forces.
Highlights
- •
Pupal blood flow of maxillary first molars was measured with a laser Doppler flowmeter.
- •
Previous studies were conducted on incisors.
- •
Pupal blood flow is reduced during the early stages of intrusion with light or heavy forces.
- •
Pupal blood flow values returned to baseline after 3 months.
One of the greatest challenges encountered in clinical dentistry is the overeruption of maxillary molars; this usually results from early loss of antagonistic teeth. Treatment is important because overeruption can cause occlusal interferences and functional disturbances as well as severe difficulties during prosthetic reconstructions. Nonsurgical treatment strategies are focused mostly on molar intrusion, which entails great risk for pulp microcirculation. Little research has been conducted on the effects of orthodontic intrusion on dental pulp in human subjects with matched controls. In most cases, research has involved animal models or histologic methods. Butcher and Taylor reported that the application of intrusive forces to monkey incisors caused pulp tissue necrosis, and another study on rat incisors found compromised pulpal blood flow (PBF) after intrusion. Histologic studies of human teeth have shown that the main changes after intrusion include vacuolization of pulp tissue, circulatory disturbances, congestion, hemorrhage, and fibrohyalinosis. Only a few clinical studies have evaluated the response of dental pulp to intrusive forces in humans. Of these, Sabuncuoglu and Ersahan, Ikawa et al, and Sano et al described significant reductions in PBF caused by the intrusive forces, whereas Barwick and Ramsay found no changes in PBF during intrusion. Of the work done on human subjects, the intrusive forces were applied on incisors, but on molars in only 1 study.
To prevent circulatory disturbances in dental pulp during intrusion, the magnitude of force needs to be considered ; however, the optimal magnitude of force for molar intrusion has not yet been established. Although Umemori et al recommend a force of 500 g, Park et al successfully used 200 to 300 g, and Kalra et al used a force of 90 g. It is generally assumed that the greater the orthodontic force, the greater the pulpal changes and their consequences, but sound scientific data to support this assumption are lacking. Early histologic studies made it clear that excessive force applied in orthodontic treatment leads to undesirable results, but there is still no generally accepted limit to the magnitude of the force that may be used to obtain satisfactory molar intrusion without harmful effects. Therefore, this study was undertaken to use laser Doppler flowmetry (LDF) to evaluate the response of molar pulp to orthodontic intrusion performed under controlled clinical conditions with either light (125 g) or heavy (250 g) intrusive forces applied to overerupted maxillary first molars by mini-implants. PBF was measured at baseline and at various intervals during intrusion, and changes in PBF were analyzed according to the amount of force and the duration of intrusion.
Material and methods
This study was approved by the institutional review board and ethics committee of the Ministry of Health’s Kecioren Training and Research Hospital (B.10.4.ISM.4.06.68.49/495) in Ankara, Turkey, and complied with the principles of the Declaration of Helsinki. Informed consent was obtained from all participants. In total, 20 healthy patients (age range, 20-40 years; mean age, 27.6 years) with overerupted maxillary first molars were selected from among the patients applying to the hospital for treatment. Initial periapical radiographs were taken, and patients with missing maxillary first molars, trauma, caries, restorations, periapical radiolucency, root resorptions, or previous orthodontic treatment were excluded from the study. The participants were randomly divided into 2 groups (n = 10) according to the level of force applied. In group 1 (light), an intrusive force of 125 g was applied to the overerupted maxillary first molar, and in group 2 (heavy), an intrusive force of 250 g was applied. No force was applied to the contralateral molars, which served as controls. Force was applied with a mini-implant inserted according to the following procedures.
Orthodontic crown bands with buccal tubes were cemented onto the maxillary molars, and a continuous 0.016 × 0.022-in stainless steel wire was placed in the maxillary arch in preparation for mini-implant insertion. One mini-implant (AbsoAnchor; Dentos, Taegu, Korea; 1.3 mm diameter, 6 mm length) was inserted into the buccal alveolus between the maxillary first and second molars, and another was placed in the paramedian palatal area 2 mm from the midpalatal suture and close to the imaginary midline between the second premolar and the first molar. Standard periapical radiographs were taken to check the positions of the mini-implants in relation to neighboring roots. One week after placement, the mini-implants were loaded, and intrusive forces of 125 or 250 g were applied. Maxillary molar intrusion was performed using elastic power chains attaching the alveolar mini-implant to the main archwire and the palatal mini-implant to a lingual button on the maxillary molar. Force levels were checked at monthly appointments. Molar intrusion was accomplished in 6 months, when the mini-implants were removed. No other treatment was performed until after the intrusion was complete.
PBF was measured using an LDF (Periflux PF 4001; Perimed, Järfälla, Sweden). The LDF output signal voltage is linearly related to red blood cell flow (number of cells × average velocity), which is recorded in perfusion units (PUs) to provide a relative measurement of blood flow. The LDF used in this study has a 1-mW helium-neon laser with a wavelength of 632.8 nm. A straight probe (PF 416; Perimed) with a diameter of 2 mm was used to conduct a light beam of 125 μm (fiber-to-fiber distance, 500 μm) to the measurement site in the dental pulp and to retrieve the backscattered light to the flowmeter. Before each measurement, the probe was calibrated for zero voltage and a motility standard of 250 PU using a plastic block (Perimed).
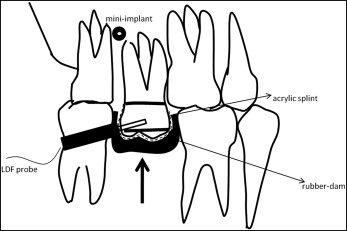
LDF measurements were recorded just before intrusion (T0) and at hour 24 (T1), day 3 (T2), day 7 (T3), week 3 (T4), week 4 (T5), month 3 (T6), and month 6 (T7) after intrusion. Accuracy and reproducibility of the measurements were achieved by giving each patient a custom-fabricated splint of self-curing acrylic resin that was used to secure the probe in the appropriate position approximately 2 mm from the gingival margin ( Fig 1 ). Before PBF measurement, arch and molar bands were temporarily removed from the teeth, a black rubber dam and a splint were positioned in the patient’s mouth, and the patient was allowed to relax in the dental chair in a supine position for approximately 10 minutes. PBF was measured in the test and control molars at the same session; however, because only 1 probe was available, the measurements were performed consecutively, with the probe remaining on 1 tooth for approximately 1 minute before being transferred to the contralateral tooth. All measurements were performed by the same operator (S.E.) under standardized environmental conditions at a constant room temperature. Attempts were made to minimize bias caused by movement of the subject and the probe, and pulse rate and blood pressure were recorded throughout the measurement sessions. No participant reported pain or discomfort during the procedure. After a constant reading was obtained, the splint and the rubber dam were removed, and the arch and molar bands were repositioned on the teeth. For each measurement session, the mean PU for each tooth was calculated based on the phase of stable values, excluding peaks attributable to movement artefacts. LDF data were transferred to a computer connected to the RS-232 port of the flowmeter using the system’s own software (PeriSoft for Windows; Perimed) and stored for analysis later.
Statistical analysis
The statistical analysis was performed using a software program (version 13.0; MedCalc Software, Ostend, Belgium). Changes in PBF within and between groups were assessed by Wilcoxon signed rank and Mann-Whitney U tests, respectively, with statistical significance set at P <0.05.
Results
Overeruption was corrected by intruding the maxillary molars 1 to 2 mm over a 6-month period using a mini-implant system. The treatment had an overall success rate of 97.5%. Of the 40 mini-implants inserted, mobility was observed in the fifth month in 1 implant, which was removed but not replaced because treatment was nearing conclusion. No subject complained of pain or tooth discoloration during the study period, and periapical radiographs of the patients in the study group showed no signs of root resorption.
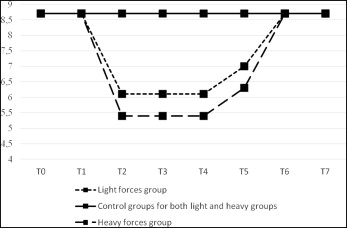
When analyzed in relation to the duration of intrusion, no differences between the T0 PBF values of the study and the control groups were observed ( P = 0.791 and P = 0.940, respectively, for the light and heavy forces), and no significant changes in PBF were observed in the control group at any point during the study ( Table ). Initially, PBF did not change significantly in the first 24 hours (8.7% ± 0.6% and 8.7% ± 0.5%, respectively, for the light and heavy force groups). However, PBF decreased significantly at T2 (6.1% ± 0.4% and 5.4% ± 0.7%, respectively, for the light and heavy force groups; P <0.001). It subsequently remained suppressed, with no statistically significant change in PBF between T2 and T3 ( P = 0.799 and P = 0.919, respectively, for the light and heavy force groups) or between T3 and T4 ( P = 0.878 and P = 0.959, respectively, for the light and heavy force groups). The initial decrease in PBF was followed by a gradual trend of recovery of intrusion beginning at T4 in which the PBF values at T6 attained levels similar to those measured before intrusion. No significant changes in PBF were observed from T6 to T7 ( P = 0.959 and P = 0.646, respectively, for the light and heavy force groups), and no differences in PBF were found between T7 and T0 ( P = 0.959 and P = 0.959, respectively, for the light and heavy force groups).
| T0 | T1 | T2 | T3 | T4 | T5 | T6 | T7 | |
|---|---|---|---|---|---|---|---|---|
| Light force group (n = 10) | ||||||||
| Mean ± SD | 8.7 ± 0.6 | 8.7 ± 0.6 | 6.1 ± 0.4 | 6.1 ± 0.6 | 6.1 ± 0.8 | 7.0 ± 0.9 | 8.7 ± 0.8 | 8.7 ± 0.8 |
| Median (minimum-maximum) | 8.8 (8.0-9.8) | 8.8 (8.0-9.8) | 6.1 (5.6-6.8) | 6.2 (4.9-6.8) | 6.0 (4.9-7.4) | 6.8 (5.7-8.6) | 8.8 (7.4-9.8) | 8.7 (7.0-9.9) |
| Control group (n = 10) | ||||||||
| Mean ± SD | 8.7 ± 0.8 | 8.7 ± 0.9 | 8.7 ± 0.8 | 8.7 ± 0.6 | 8.7 ± 0.7 | 8.7 ± 0.7 | 8.7 ± 0.6 | 8.7 ± 0.8 |
| Median (minimum-maximum) | 8.5 (7.7-10.4) | 9 (6.9-10.1) | 8.6 (7.9-10.1) | 9.0 (7.3-9.2) | 8.6 (7.9-10.1) | 8.8 (7.7-10.1) | 8.6 (7.9-9.5) | 8.8 (6.9-9.9) |
| P ∗ | 0.791 | 0.762 | <0.001 | <0.001 | <0.001 | <0.001 | 0.912 | 0.796 |
| Heavy force group (n = 10) | ||||||||
| Mean ± SD | 8.7 ± 0.8 | 8.7 ± 0.5 | 5.4 ± 0.7 | 5.4 ± 0.5 | 5.4 ± 0.4 | 6.3 ± 1.0 | 8.7 ± 0.9 | 8.7 ± 0.9 |
| Median (minimum-maximum) | 8.5 (7.7-10.1) | 8.7 (8.0-9.7) | 5.5 (4.0-6.8) | 5.5 (4.5-6.1) | 5.5 (4.8-6.2) | 6.4 (4.9-7.9) | 8.6 (7.2-10.0) | 8.4 (7.5-10.3) |
| Control group (n = 10) | ||||||||
| Mean ± SD | 8.7 ± 0.8 | 8.7 ± 0.8 | 8.7 ± 0.6 | 8.7 ± 0.6 | 8.7 ± 0.8 | 8.7 ± 1.0 | 8.7 ± 0.7 | 8.7 ± 0.9 |
| Median (minimum-maximum) | 8.9 (7.7-10.1) | 8.9 (7.2-10.0) | 8.7 (6.9-10.1) | 8.8 (7.7-9.7) | 9.0 (7.7-10.1) | 8.6 (7.2-10.6) | 8.9 (7.4-9.7) | 8.7 (7.3-10.1) |
| P ∗ | 0.940 | 0.820 | <0.001 | <0.001 | <0.001 | <0.001 | 0.940 | 0.880 |
When analyzed in relation to the amount of intrusive force, mean baseline PBF values of the light and heavy force groups were similar (8.7% ± 0.6 % and 8.7% ± 0.8%; P = 0.910, respectively, for the light and heavy force groups), and no significant changes in PBF were observed in the control group at any point during the study. Moreover, no significant differences were found between the light and heavy force groups at T1 ( P = 0.970). However, Mann-Whitney U test results showed more pronounced decreases of PBF at T2 and T3 in the patients in the heavy force group than in the light force group ( P = 0.011 and P = 0.014, respectively, at T2 and T3). No significant differences between the 2 study groups were observed at any other times. Figure 2 shows the relationship between PBF (PU), applied force magnitude (g), and the time points.