Introduction
The objective of this study was to evaluate the accuracy and reliability of measurements on digital models obtained by scanning impressions 5, 10, and 15 days after they were made from 2 soft putty polyvinylsiloxane (PVS) materials.
Methods
Thirty volunteers were selected for making impressions of their dentitions with alginate to create a plaster model and with PVS impression material to create a digital model by laser scanning. Three examiners made the plaster model measurements with digital calipers and repeated these measurements on the digital models made from the scanned PVS impressions. A total of 34 distances were evaluated. Paired t tests were used to evaluate intraexaminer error and the accuracy of the digital model measurements. Measurement reproducibility and reliability among examiners were tested.
Results
Although statistically significant differences between measurements on plaster and digital models were found, these discrepancies were not clinically significant except for overbite. Both plaster and digital models had high intraclass correlation coefficient values.
Conclusions
Digital models acquired by laser scanning of 2 types of soft putty PVS material may be used with clinically acceptable accuracy, reliability, and reproducibility, even at a postscanning interval of 15 days.
Highlights
- •
We compared the accuracy between digital models from polyvinylsiloxane (PVS) impressions and plaster models.
- •
Digital models made from scanning impressions are accurate and reliable.
- •
Two types of soft PVS impression material had similar accuracies.
- •
PVS is adequate for creating digital models after scanning for up to 15 days.
Digital models are increasingly used in clinical orthodontics because of their advantages, such as ease of data storage, transmission, orthodontic diagnosis, treatment planning, and appliance fabrication. The demand for digital models is growing because they can be used for a digital setup that then can serve for fabrication of esthetic aligners and other custom appliances such as Insignia (Ormco, Orange, Calif), Incognito (3M Unitek, Seefeld, Germany), and Sure Smile (Stratos/Orametrix, Dallas, Tex), and for planning surgical treatment. Scientific information about the accuracy of digital models made from plaster models, impressions, or intraoral scanning is needed. Several studies have evaluated the accuracy and reliability of digital models from various scanning processes, such as plaster model laser scanning, alginate, and polyvinylsiloxane (PVS) impression laser scanning, cone-beam computed tomography scanning of impressions, and intraoral laser scanning. The authors of most of these studies did not identify clinically significant differences in measurements on digital models compared with measurements on plaster dental models. Only a few studies have reported clinically significant differences between plaster and digital models.
For occlusion registration of digital models, it is necessary to scan the bite registration. The accuracy of digital models and occlusions obtained by laser scanning has been evaluated in previous studies for both alginate and PVS impressions. Few studies have investigated surface laser scanning for PVS impressions, and the influence of different types of soft putty PVS materials and their dimensional stability on the accuracy of digital models has not yet been reported.
The first objective of this study was to evaluate the accuracy and reliability of digital models obtained by PVS impression scanning, with a surface laser scanner (R700; 3Shape, Copenhagen, Denmark) and Ortho Analyzer software (3Shape) as a measurement tool. The second objective was to evaluate how the time elapsed between the impression procedure and the actual scanning of the impression influences the accuracy of the digital models. Our third objective was to evaluate the influence of the type of soft putty PVS material on the accuracy of these digital models.
Material and methods
A sample size calculation was performed using the formula described by Pandis, considering a power test of 90% and α of 0.05, to detect a difference in measurements of 1 mm (SD, 1.16 mm). The sample size calculation (with 10 volunteers) showed that at least 29 volunteers would be needed for the research. This study was approved by the ethical committee of the Medical School of Federal Fluminense University, Niterói, Brazil, on February 1, 2013 (registration number 221.664).
The inclusion criteria were fully erupted permanent dentition (including all maxillary and mandibular permanent first molars); no anomalies in number, size, or shape of the dentition; no accentuated recessions, abrasions, or erosions; no cavities or restorations that could compromise the mesiodistal diameter; and no orthodontic fixed retention.
Thirty volunteers who met the inclusion criteria were selected at the Department of Orthodontics of Federal Fluminense University. Their ages ranged from 21 to 39 years, with a mean of 27 years 9 months. All volunteers were informed about the research procedures and signed informed consent. After a clinical examination, alginate impressions with Hydrogum alginate (Zhermack, Badia Polesine, Rovigo, Italy) were made following the manufacturer’s guidelines. In addition, a bite registration in maximal occlusion was made using number 7 dental wax (Clássico, São Paulo, Brazil). Twenty minutes after impression taking, to complete the alginate cure period, the alginate impressions were disinfected and placed in a closed plastic bag. Within 1 hour after impression taking, the teeth and the alveolar ridges were covered with type IV plaster (Vigodent, Rio de Janeiro, Brazil). The base of the model was poured with white plaster (Mossoró, Rio de Janeiro, Brazil).
Directly after the making of the alginate impression, a PVS impression was taken from each volunteer. These PVS impressions of both arches were taken using the 2-step technique with Futura impression material (Nova DFL, Rio de Janeiro, Brazil). The first impression was made with the heavy putty material, and then the soft putty material was used to record the anatomic details, according to the manufacturer’s guidelines. The regular-viscosity soft putty was used for the maxillary arch and the light-viscosity soft putty for the mandibular arch to allow evaluation of possible accuracy differences between the 2 materials. After both impressions were taken, a bite registration in maximum intercuspation was obtained with the PVS heavy putty ( Fig 1 ).
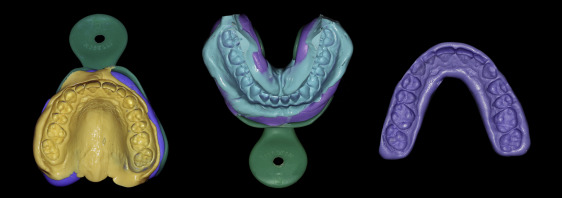
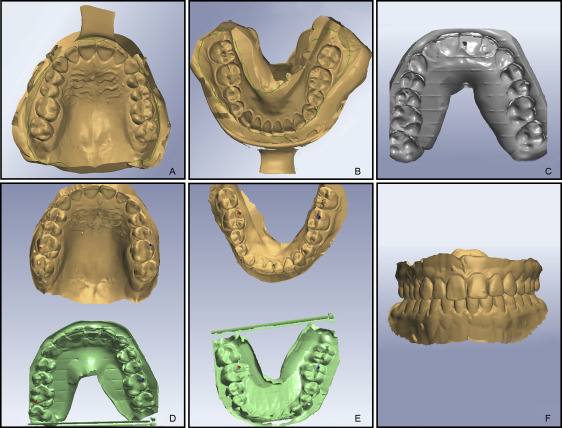
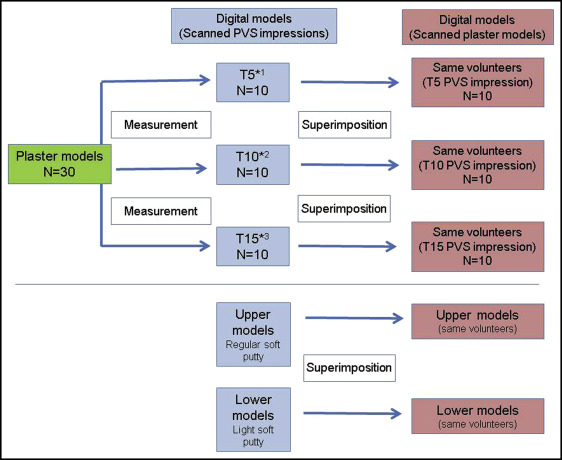
After impression taking, the PVS impressions and the bite registrations were disinfected, stored in plastic bags, and protected from light for subsequent scanning to obtain digital models. The 60 impressions (30 impressions of each arch) and the respective bite registrations were scanned with the R700 scanner using the dedicated impression scanning software. The scanning procedure started with the maxillary impression, followed by the mandibular impression, and then the bite registration was scanned with a device that kept it stable without deforming it. After making the first scan, the scanner automatically detects the areas where the scan has less quality and scans them during the adaptive scanning by turning the table where the impression is and by moving the cameras on the rail. Of course, there are limits in scanning possibilities and time, so it is difficult to scan properly when the areas are not visible because of some undercuts. In some cases, we used a titanium oxide powder on the mandibular incisor area to improve scanning accuracy; the narrower undercuts in this region can create difficulty with the laser incidence of the scanner ( Fig 2 ). For superimposition of the maxillary model and bite registration, 3 points (first molar and incisal regions) on the models were selected along with 3 identical points on the bite registration for the initial alignment. The same procedure was repeated for the mandibular model. The 3Shape software then automatically superimposed both digital models by a best-fit method. Then sagittal, transverse, and vertical adjustments were made to create the virtual maxillary and mandibular bases ( Fig 3 ). The 30 digital model pairs were divided into 3 groups of 10 pairs each, according to the time interval between taking and scanning the PVS impressions. T5 represented an interval of 5 days; T10, 10 days; and T15, 15 days.

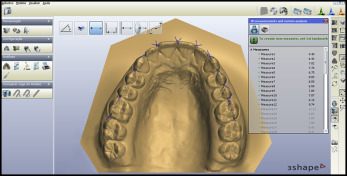
Thirty-four clinically relevant parameters for measuring were defined for each pair of dental models, including tooth diameter, transverse distances (maxillary and mandibular intercanine and intermolar distances), and interarch relationship measurements (overbite, overjet) ( Table I ). Three examiners (L.T.C., D.S.A., and another) were properly trained to measure the plaster and digital models before the start of the study. Among the examiners was an undergraduate student of dentistry, a masters degree student of orthodontics, and a doctoral student of dentistry. The plaster models were measured with a digital caliper (Starrett-Itu, São Paulo, Brazil), with an accuracy of 0.01 mm. The digital models were measured using the Ortho Analyzer software with the direct measuring tool ( Fig 4 ). To calculate the method error, the 3 examiners repeated the measurements on 10 randomly selected plaster models and 10 digital models, 15 days after the first measurements.
| Measurement | Abbreviation | Definition |
|---|---|---|
| Mesiodistal diameter | MDD | Maxillary and mandibular mesiodistal diameter from first molar to first molar (higher mesiodistal diameter of the contact point mesial to distal point of contact, parallel to the occlusal plane) |
| Sum of maxillary 6 teeth | Sum maxillary 6 | Diameter sum of 6 anterior maxillary teeth |
| Sum of maxillary 12 teeth | Sum maxillary 12 | Diameter sum of 12 anterior maxillary teeth |
| Sum of mandibular 6 teeth | Sum mandibular 6 | Diameter sum of 6 anterior mandibular teeth |
| Sum of mandibular 12 teeth | Sum mandibular 12 | Diameter sum of 12 anterior mandibular teeth |
| Maxillary intercanine distance | Maxillary ICD | Distance between the cusp tip of the maxillary left canine to the cusp tip of the maxillary right canine |
| Maxillary intermolar distance | Maxillary IMD | Distance between the tip of the mesiobuccal cusp of the maxillary left first molar to the tip of the mesiobuccal cusp of the maxillary right first molar |
| Mandibular intercanine distance | Mandibular ICD | Distance between the cusp tip of the mandibular left canine to the cusp tip of the mandibular right canine |
| Mandibular intermolar distance | Mandibular IMD | Distance between the tip of the mesiobuccal cusp of the mandibular left first molar to the tip of the mesiobuccal cusp of the mandibular right first molar |
| Overjet | Overjet | Distance from the middle of the incisal edge closest to the buccal surface of the maxillary right central incisor to the buccal surface of the mandibular incisor antagonist, parallel to the occlusal plane |
| Overbite | Overbite | Vertical distance between the marking where the incisal edge of the maxillary right central incisor overlaps the buccal surface of the mandibular incisor antagonist to its respective incisal edge |
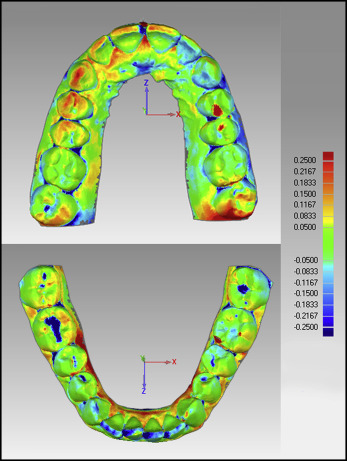
All plaster models of the sample were also scanned with the same scanner (R700) to acquire the respective digital models and enable comparisons with the digital models from PVS impression scanning. They were compared using a superimposition method by Geomagic Qualify software (3D Systems, Rock Hill, SC). The bases of the 2 types of digital models were cut apical to the gingival margin. The models were aligned using the dentition as a reference by the best-fit surface alignment tool. After alignment, the model edges were trimmed with cutting planes to create common borders. Color displacement maps were generated to confirm accurate crown superimpositions and measure differences between the models. Geomagic Qualify software outputs the mean and maximum displacements, the positive and negative average differences, and the standard deviations measured in the color map analysis. These data are obtained by calculation of the distances of points between each digital model superimposition. The limits used in the color map were 0.25 mm ( Fig 5 ). Figures 6 and 7 illustrate the design of the study.

Statistical analysis
Statistical analysis was performed with SPSS software for Windows (version 20.0; IBM, Armonk, NY). The paired t test was used to compare measurements on the plaster and digital models by PVS impression scanning for each examiner. The intraclass correlation coefficient (ICC) evaluated the reproducibility of the measurements among the examiners for each model. The paired t test was also used to compare the differences by superimposition of the digital models (plaster model scanning vs PVS impression scanning), according to the time interval of impression taking. The differences between the soft putty types were compared using paired t tests of the superimposition differences between the maxillary models (regular viscosity) and the mandibular models (light viscosity) by also using the superimpositions between plaster model scanning and PVS impression scanning for each maxillary and mandibular model. Differences in measurements were considered statistically significant if the P value was lower than 0.05.
The method error was calculated by comparing the initial measurements and the measurements after 15 days for the selected sample. The paired t test was used to evaluate the intraexaminer errors. Results were considered significant when the P value was lower than 0.05.
Results
The intraexaminer errors of each examiner had low values, and all examiners had lower error values for the plaster models than for the digital models by PVS impression scanning. Examiner 1 had a mean difference of all parameters of 0.08 mm for the digital models (maximum error in the sum of 12 mandibular teeth was 1.88 mm) and an average difference of −0.01 mm in all parameters of the plaster models (maximum error in the diameter of the right maxillary second premolar of −1.06 mm). Examiner 2 had a mean difference in the error values of 0.05 mm in all parameters of the digital models (maximum error in the sum of 12 mandibular teeth was 0.99 mm), and the average differences in all parameters in the plaster models were −0.01 mm (maximum error in the maxillary intercanine distance of −1.24 mm). Examiner 3 had similar results to those of examiner 2: 0.05 mm in the average differences in all parameters of the digital models (maximum error of 1.06 mm in the sum of 12 mandibular teeth) and −0.01 mm in the plaster model’s mean differences of all parameters (maximum error of 0.21 mm in the sum of 12 mandibular teeth).
The reproducibility analysis showed high ICC values for both plaster model measurements (r = 0.908) and those on digital models (r = 0.857). Transverse measurements had high ICC values for plaster models (r = 0.966) and digital models (r = 0.976). Overbite and overjet also showed high ICC values for plaster models (0.965 and 0.930) and digital models (0.970 and 0.943). In relation to tooth diameter, plaster models had higher ICC values (maxillary teeth, 0.891; mandibular teeth, 0.881) than the digital models (0.827 and 0.800) ( Table II ).
| Parameter | Plaster model (n = 30) | Digital model PVS impression (n = 30) | ||
|---|---|---|---|---|
| ICC | 95% CI | ICC | 95% CI | |
| MDD maxillary teeth (mean) | 0.891 | 0.814-0.942 | 0.827 | 0.714-0.906 |
| Sum maxillary 6 | 0.967 | 0.940-0.983 | 0.956 | 0.922-0.978 |
| Sum maxillary 12 | 0.964 | 0.936-0.982 | 0.962 | 0.931-0.980 |
| MDD mandibular teeth (mean) | 0.881 | 0.797-0.937 | 0.800 | 0.673-0.890 |
| Sum mandibular 6 | 0.953 | 0.917-0.976 | 0.927 | 0.871-0.962 |
| Sum mandibular 12 | 0.967 | 0.941-0.983 | 0.960 | 0.929-0.980 |
| Maxillary ICD | 0.967 | 0.940-0.983 | 0.971 | 0.948-0.985 |
| Mandibular ICD | 0.947 | 0.906-0.973 | 0.963 | 0.933-0.981 |
| Maxillary IMD | 0.987 | 0.977-0.993 | 0.991 | 0.984-0.996 |
| Mandibular IMD | 0.965 | 0.937-0.982 | 0.980 | 0.964-0.990 |
| Overjet | 0.930 | 0.877-0.964 | 0.943 | 0.898-0.970 |
| Overbite | 0.965 | 0.936-0.982 | 0.970 | 0.947-0.985 |
The paired t test was used to compare the differences in measurements by each examiner for the plaster and digital models by PVS impression scanning. Statistically significant differences were found for some measurements. Examiners 1 and 3 had similar results, but examiner 2 had more clinically significant differences. The maxillary and mandibular tooth diameters showed that examiners 1 and 3 had similar measurements, whereas examiner 2 registered lower values for the measurements on the digital models. Regarding overjet, the 3 examiners registered similar measurements with small differences, whereas measurements of overbite had lower values for digital models for all examiners. Measurements on digital models showed lower values for all examiners, with average differences between all parameters of 0.022 mm for examiner 1, 0.537 mm for examiner 2, and 0.166 mm for examiner 3 ( Table III ). The difference in measurements for overbite was clinically significant for almost all of the digital models, with the exception of examiner 1 at T5.
| Parameter | Examiner 1 | Examiner 2 | Examiner 3 | ||||||
|---|---|---|---|---|---|---|---|---|---|
| Mean (mm) | SD (mm) | P Value | Mean (mm) | SD (mm) | P Value | Mean (mm) | SD (mm) | P Value | |
| Sum maxillary 6 | 0.083 | 0.819 | 0.580 | 2.317 | 1.000 | 0.000 | 1.171 | 0.685 | 0.000 |
| Sum maxillary 12 | 0.494 | 1.208 | 0.033 | 3.386 | 1.762 | 0.000 | 1.370 | 1.141 | 0.000 |
| Sum mandibular 6 | −0.159 | 0.760 | 0.261 | 1.448 | 1.124 | 0.000 | 0.361 | 0.858 | 0.029 |
| Sum mandibular 12 | −0.382 | 1.214 | 0.095 | 2.151 | 1.833 | 0.000 | 0.270 | 0.963 | 0.135 |
| Maxillary ICD | 0.291 | 0.497 | 0.003 | 0.500 | 0.593 | 0.000 | 0.447 | 0.484 | 0.000 |
| Maxillary IMD | −0.320 | 0.413 | 0.000 | 0.067 | 0.807 | 0.653 | −0.272 | 0.572 | 0.014 |
| Mandibular ICD | 0.218 | 0.363 | 0.003 | 0.709 | 0.494 | 0.000 | 0.092 | 0.436 | 0.254 |
| Mandibular IMD | −0.289 | 0.723 | 0.037 | 0.831 | 0.699 | 0.000 | 0.296 | 0.633 | 0.016 |
| Overjet | 0.104 | 0.415 | 0.178 | 0.479 | 0.581 | 0.000 | −0.248 | 0.455 | 0.006 |
| Overbite | 0.625 | 0.583 | 0.000 | 0.852 | 0.505 | 0.000 | 0.536 | 0.541 | 0.000 |
Stay updated, free dental videos. Join our Telegram channel

VIDEdental - Online dental courses


