Introduction
The purpose of this study was to investigate the effect of filler properties on the grindability of composite resin adhesives.
Methods
Six composite resin products were selected: Transbond XT (3M Unitek, Monrovia, Calif), Transbond Plus (3M Unitek), Enlight (Ormco, Glendora, Calif), Kurasper F (Kuraray Medical, Tokyo, Japan), Beauty Ortho Bond (Shofu, Kyoto, Japan), and Beauty Ortho Bond Salivatect (Shofu). Compositions and weight fractions of fillers were determined by x-ray fluorescence analysis and ash test, respectively. The polished surface of each resin specimen was examined with a scanning electron microscope. Vickers hardness of plate specimens (15 × 10 × 3 mm) was measured, and nano-indentation was performed on large filler particles (>10 μm). Grindability for a low-speed tungsten-carbide bur was estimated. Data were compared with anlaysis of variance (ANOVA) and the Tukey multiple range test. Relationships among grindability, filler content, filler nano-indentation hardness (nano-hardness), filler elastic modulus, and Vickers hardness of the composite resins were investigated with the Pearson correlation coefficient test.
Results
Morphology and filler size of these adhesives showed great variations. The products could be divided into 2 groups, based on composition, which affected grindability. Vickers hardness of the adhesives did not correlate ( r = 0.140) with filler nano-hardness, which showed a significant negative correlation ( r = –0.664) with grindability.
Conclusions
Filler nano-hardness greatly influences the grindability of composite resin adhesives.
After acid-etching was introduced in the mid-1950s, direct bonding of orthodontic appliances to enamel with composite resin was introduced by Newman in the mid-1960s, and now it is widely accepted by most orthodontists. Although progress in bonding enamel to resin-modified glass ionomers and self-etching primers has been made in the last decade, removal of the residual adhesive on the enamel after bracket debonding is still required, and the procedure is time-consuming.
Orthodontists have been using low-speed tungsten-carbide burs, high-speed tungsten-carbide burs, high-speed diamond burs, debonding pliers, and ultrasonic scalers for removing residual adhesive on the enamel. Although there is some disagreement, most previous studies found that the low-speed tungsten-carbide bur produced the finest pattern of abrasion and the least enamel loss. Although the relationship between wear resistance and hardness has been studied with conventional methods such as Vickers hardness and Knoop hardness, consensus does not seem to have been achieved. The hardness of filler particles seems to influence the grindability and the wear resistance of the adhesive. It has been impossible to measure the hardness of filler particles by using conventional methods. Recently, the nano-indentation test has become a common technique to analyze mechanical properties such as hardness and elastic modulus for small areas and thin regions of materials.
The purpose of this study was to investigate the effects of chemical composition, weight fraction, and nano-mechanical properties of the fillers on the grindability of 6 composite resin adhesive products, along with Vickers hardness measurements of resin plate specimens for comparison with the results of the nano-indentation test. It was hypothesized that these different composite resin adhesives would have different grindability values that might be largely dependent on the characteristics of the fillers. This is the first study that has investigated the relationship between the grindability of orthodontic composite resin adhesives and the characteristics of fillers.
Material and methods
Six composite resin products—Transbond XT Light Cure adhesive paste (3M Unitek, Monrovia, Calif; lot 6YC), Transbond Plus Color Change adhesive (3M Unitek; lot 7BH), Enlight Light Cure adhesive (Ormco, Glendora, Calif; lot 2712916), Kurasper F Light Cure adhesive paste (Kuraray Medical, Tokyo, Japan; lot 00033B), Beauty Ortho Bond paste (Shofu, Kyoto, Japan; lot 120503), and Beauty Ortho Bond Salivatect (Shofu; lot 010807)—were selected for study ( Table I ). Five specimens, with approximate dimensions of 15 × 20 × 3 mm, for the grindability test were made with a metal mold. The mold was filled with composite resin paste, and pressure was applied with a glass plate. Then the resin was irradiated with a halogen light system (Twin Cure, Shofu) for 3 minutes from each side of the mold. The halogen light produces an illuminance of approximately 700,000 lux and wavelengths between 300 and 900 nm. After the grindability test, each starting specimen was cut into 2 portions, approximately 15 × 10 × 3 mm, with a diamond disk. The first portion of the specimen was used for measurement of Vickers hardness for the overall composite resin and the nano-indentation tests on the filler particles; the second portion was used for scanning electron microscope (SEM) observation. The first portion of each specimen was also subsequently used for composition analysis. Nominal compositions of the adhesives obtained by x-ray fluorescence analysis (ZSX100e, Rigaku, Tokyo, Japan) are summarized in Table I . Transbond XT consisted of 99% silicon dioxide (SiO 2 ). In addition to containing small amounts of boron oxide (B 2 O 3 ), aluminum oxide (Al 2 O 3 ), strontium oxide (SrO), fluoride (F), zinc oxide (ZnO), or phosphorus oxide (P 2 O 5 ), Transbond Plus and Enlight mainly consisted of SiO 2 . Beauty Ortho Bond paste consisted of approximately 30% SrO, 27% Al 2 O 3 , 21% SiO 2 , and 13% B 2 O 3 ; the composition of Beauty Ortho Bond Salivatect was similar. Kurasper F consisted of approximately 48% SiO 2 , 31% barium oxide (BaO), 12% B 2 O 3 , and 8% Al 2 O 3 . Transbond Plus, Beauty Ortho Bond paste, and Beauty Ortho Bond Salivatect contained approximately 6% fluoride.
| Material | SiO 2 | B 2 O 3 | Al 2 O 3 | Na 2 O | BaO | SrO | F | ZnO | P 2 O 5 |
|---|---|---|---|---|---|---|---|---|---|
| Transbond XT | 99.61 | – | – | – | – | – | – | – | – |
| Transbond Plus | 64.99 | – | 10.08 | – | – | 11.39 | 6.64 | 3.87 | 1.83 |
| Enlight | 78.60 | 13.35 | 4.08 | 3.49 | – | – | – | – | – |
| Kurasper F | 47.58 | 12.09 | 7.93 | – | 31.12 | – | – | – | – |
| Beauty Ortho Bond | 20.82 | 13.10 | 26.64 | 2.23 | – | 30.40 | 6.11 | – | – |
| Beauty Ortho Bond Salivatect | 21.47 | 10.71 | 28.77 | 1.86 | – | 30.41 | 6.07 | – | – |
Filler weight fraction was determined by the standard ash method with 5 specimens of each product. Generally, the ash test is used to determine how much filler (total content) is in the specimen. The weight of each composite resin specimen (approximately 0.5 g) including the container (W0) was measured with a precision digital balance (ER-182A, A&D, Tokyo, Japan). The specimen and container were then heated in an electric furnace at 750°C for 1 hour to burn out the organic matrix and reweighed (W1). The latter weight consisted of only the inorganic filler. The filler weight fraction (wt %) was determined with the following formula: filler wt % = (W1/W0) × 100%.
The surface of each specimen portion for SEM examination (15 × 10 × 3 mm) was polished by using a series of silicon-carbide abrasive papers followed by 1 μm diamond paste. After vapor deposition of a thin film of pure gold, the surface was examined with a SEM (SSX-550, Shimadzu, Kyoto, Japan).
The surface of each specimen portion for Vickers hardness and nano-indentation (15 × 10 × 3 mm) was polished by using the same sequence of silicon-carbide abrasive papers and 1 μm diamond paste. Vickers hardness measurements on adhesives were performed with 2.94 N (300 gf) load and a 30-second dwell time for all specimens (MVK-F, Akashi, Tokyo, Japan). Five indentations were made for each product.
Nano-indentations of representative large filler particles (>10 μm) in each specimen group were made by using a 2 mN load and a controlled temperature of 27°C with a Berkovich indenter (ENT-1100a, Elionix, Tokyo, Japan). Five indentations were made at 50-μm intervals near the centers of the filler particles, and mean values of nano-indentation hardness (nano-hardness) and elastic modulus were calculated.
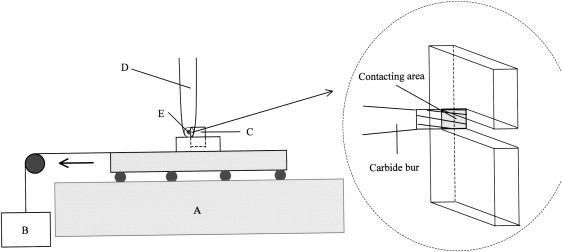
A custom-fabricated device for measurement of grindability is shown in Figure 1 . The specimens with approximately 15 × 20 × 3 mm dimensions were fixed in the device and ground with a low-speed tungsten-carbide bur (CA1172, Shofu; lot 2710291) by using 78,000 revolutions per minute with a constant 300-g load for 3 minutes. Five specimens were used for each product. The weights of the specimens before and after the grindability test were measured with a precision digital balance (AT200, Mettler-Toledo, Columbus, Ohio). A gas pycnometer (AccuPyc 1330, Shimadzu) was used to determine the density of each specimen, and then the decreased volumes of the specimens were calculated. The mean decrease in volume (measured in cm 3 ) for each specimen group was adopted as the measure of grindability.
Statistical analysis
Statistical comparisons were performed with SPSS software (version 14.0J for Windows, SPSS, Chicago, Ill). Overall adhesive Vickers hardness, filler content, filler nano-hardness, filler elastic modulus, and decreased specimen volumes obtained by the grindability test were compared for the 6 composite resins with 1-way analysis of variance (ANOVA) and the Tukey multiple range test, with a significance level of 5%. The relationships among adhesive Vickers hardness, adhesive grindability, filler content, filler nano-hardness, and filler elastic modulus were investigated with the Pearson correlation coefficient test.
Results
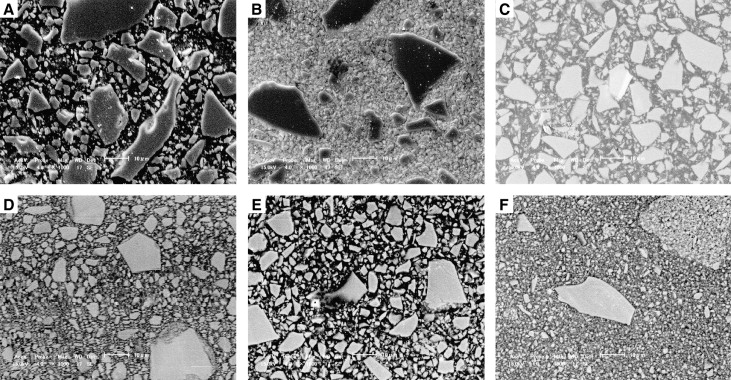
Representative photomicrographs of the polished composite resins are shown in Figure 2 . Transbond XT contained the largest irregular particles with sizes ranging from approximately 0.5 to 10 μm, whereas Transbond Plus principally contained small irregular particles (0.5-2 μm) with some approximately 10-μm and larger particles. Enlight, Kurasper F, and Beauty Ortho Bond paste had similar microstructures, containing a variety of irregular particles from approximately 0.5 to 10 μm in size with some larger (10-15 μm) irregular particles. Beauty Ortho Bond Salivatect contained mostly small irregular particles (0.5-2 μm) with a few large particles (>10 μm).
The filler contents (wt %) of the 6 composite resins are listed in Table II . From 1-way ANOVA, significant differences were found among the 6 specimen groups for filler contents ( P <0.001). Beauty Ortho Bond Salivatect had the lowest mean filler content (58.1 wt %), whereas Kurasper F had the highest mean filler content (78.1 wt %). The Tukey test showed that there were significant differences in the filler contents for all adhesives other than Transbond XT and Beauty Ortho Bond, which were not significantly different from each other.
| Wt % filler | ||
|---|---|---|
| Mean | SD | |
| Transbond XT | 70.2 c | 2.8 |
| Transbond Plus | 74.3 b | 0.9 |
| Enlight | 63.1 d | 3.1 |
| Kurasper F | 78.1 a | 1.1 |
| Beauty Ortho Bond | 69.2 c | 0.4 |
| Beauty Ortho Bond Salivatect | 58.1 e | 1.0 |
Mean Vickers hardness of the overall composite resin in the plate specimens, along with nano-hardness and elastic modulus of the comparatively large filler particles (>10 μm) in each resin group are summarized in Table III . From 1-way ANOVA, a significant difference was found among the 6 groups for the resin Vickers hardness ( P <0.001), filler nano-hardness ( P <0.001), and filler elastic modulus ( P <0.001). From the Tukey test, Kurasper F showed significantly higher mean Vickers hardness values than did the other specimen groups ( P <0.05). Enlight and Beauty Ortho Bond Salivatect had significantly lower mean Vickers hardness values than did the other specimen groups except Transbond Plus. On the other hand, Transbond XT and Transbond Plus had significantly higher mean filler nano-hardness values than did the other 4 specimen groups ( P <0.05). There was no significant difference for mean filler nano-hardness among Enlight, Kurasper F, Beauty Ortho Bond paste, and Beauty Ortho Bond Salivatect. There was no significant difference in mean filler elastic modulus for Transbond XT, Transbond Plus, and Kurasper F, and there was also no significant difference in mean filler elastic modulus for Transbond Plus, Kurasper F, and Beauty Ortho Bond paste. Enlight had the lowest mean filler elastic modulus, but it was not significantly lower than the mean values for Beauty Ortho Bond paste and Beauty Ortho Bond Salivatect.


