Introduction
Although miniscrews have been used as absolute anchorage for a long time, their behavior under orthodontic loading is still unclear clinically. Therefore, this study was designed to evaluate the behavior of miniscrews under loading by retrospective 3-dimensional registration.
Methods
Sixty adult patients who had miniscrews as anchorage for en-masse retraction of anterior teeth were studied. Computerized tomography scans were made before force application and after closure of the extraction spaces, respectively. The 3-dimensional reconstruction and registration of before and after computerized tomography data were performed to assess the displacement of the miniscrews, first molars, and maxillary central incisors.
Results
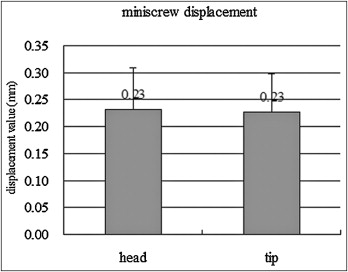
The miniscrews and the maxillary first molars drifted mesially 0.23 and 0.91 mm apically, and 0.23 and 0.92 mm coronally; the amounts of maxillary incisor retraction at the edge and the apex were 5.94 and 1.40 mm, respectively, with 1.84 mm of maxillary central incisor intrusion.
Conclusions
Our results indicated that the miniscrews and the maxillary first molars were mesially displaced under orthodontic loading. A mesial site for miniscrews might be a better choice for long-term stability.
Anchorage control is a fundamental concept in orthodontic treatment. In the anteroposterior dimension, 3 anchorage situations are traditionally defined by the ratio of incisor retraction to molar protraction: maximum anchorage, moderate anchorage, and minimum anchorage. Miniscrews are considered absolute anchorage, and the anchorage units remain completely stationary and prevent molar protraction into the extraction space. However, it has been controversial for a long time whether miniscrews and the molars retain their positions under long-term orthodontic loading conditions in clinical practice. Zhu et al, Liou et al, and Xun et al suggested that miniscrews might move under orthodontic loading. However, Hsieh et al reported movement of endosseous titanium implants under loading in beagle dogs.
The analysis of the spatial changes of the craniofacial structures for orthodontic treatment generally relies on the superimposition of cephalometric tracings at different times. Although orthodontists can observe the general growth changes and learn about the effect of treatment by cephalometric analysis, the 2-dimensional limitations of radiographic cephalometric tracings such as overlap, poor visualization of individual structures, errors from projection, and the inability to identify the true symphysis cause errors in identification and reduce measurement accuracy. Therefore, the cephalometric analysis might be not suitable for evaluating the tiny 3-dimensional (3D) drift changes of miniscrews and molars.
Compared with 2-dimensional cephalograms, computerized tomography (CT) scanning is a more precise surveying technique. The 3D reconstruction and visualization of CT images can provide further detailed information on miniscrews and tooth movement. To orthodontists, the visualization of 3D model superimposition of pretreatment and posttreatment CT data is an accurate and reliable method for quantification of miniscrew movement. Therefore, the purpose of this study was to quantitatively evaluate the position of miniscrews and molars under orthodontic force (150 g) by using 3D CT registration evaluations.
Material and methods
Interactive Medical Image Control System (MIMICS, version 10.01, Materialise, Leuven, Belgium), an interactive tool for the visualization and segmentation of CT images, and related 3D model soft files, were used in this study.
Sixty patients (aged 19-27 years) who had bimaxillary protrusion and miniscrews as anchorage for the en-masse retraction of anterior teeth were included. All patients received information on the miniscrew anchorage methodologies, surgical techniques, and the possibilities of failure, irritation, and local inflammation during orthodontic treatment. The miniscrew was 1.6 mm in diameter and 11 mm in length (Beici Medical, Ningbo, China). The miniscrew site was the interradicular area between the maxillary first molar and the second premolar at an oblique angle of 30° to 40° to the long axis of the teeth and at the level of the attached gingiva.
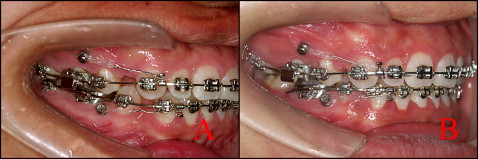
After the 4 first premolars were extracted, treatment was done by using preadjusted edgewise appliances, 0.022 × 0.028 oriental preadjusted appliance-KOSAKA slot bracket (OPA-K, Tomy, Fukushima-ken, Japan). The appliances for en-masse anterior retraction were 0.019 × 0.025-in stainless steel basal archwires with incisor lingual root torque and 4 elastic chains for en-masse retraction. On each side, the lever arm was placed into the auxiliary tube on the first molar and hooked on the basal archwire for intrusion of the anterior teeth. Two elastic chains with a force of 150 g were attached between the miniscrew and the hook on the basal archwire between the lateral incisor and the canine. The patients were interviewed at 1-month intervals. The process took about 6 months ( Fig 1 ).
The whole-skull CT scans were made 2 weeks after placement of the miniscrews (T1) and after closure of extraction space (T2) by 16-flow helical CT (Light Speed plus, 2004, General Electric, Fairfield, Conn). CT scanning was done perpendicular to the long axis of the central incisors on each jaw, and this angle was determined by setting the gantry angle according to the lateral scanogram of the head position (slice thickness, 0.625 mm; reconstruction interval, 0.3 mm; scan time, 1.0 second; 120 kV; 250 MA). The CT data were saved as DICOM (digital imaging and communications in medicine) format.
The MIMICS medical imaging density segmentation software was used for the reconstruction of the primary 3D anthropometric models (alveolar bone, teeth, and miniscrews). The DICOM image files generated in the CT scan were constituted by pixels with different gray intensities. The different intensity fields correspond to different material densities of the anatomic maxillary structures. In the MIMICS software, thresholding based on Hounsfield units (HU) was used to separate bone, teeth, and miniscrews structures. To include tooth structures and exclude the alveolar regions, a lower limit of 1500 HU and an upper limit of 3725 HU were defined. The alveolar bone excluding the teeth was accomplished with manual editing of the density masks with a lower limit of 392 HU and an upper limit of 1900 HU, and the miniscrew masks had a lower limit of 2400 HU and an upper limit of 3725 HU. For each bone, individual and separated masks were created. This process allows posterior generation of independent geometric files and 3D models. At the same time, the 3D skull model was reconstructed as the constant reference for the pretreatment and posttreatment CT registrations. All 3D models were exported as standard triangulated language (STL) points.
Since our research focus was the displacement of miniscrews and the growth trendency of the adults, we assumed that the shape of the upper skull in each CT scan was unchanged. Based on this assumption, we found that rigid transformation of the upper skull surface would be adequate for the registration of pretreatment and postoperative CT scans.
In the MIMICS software, the point registration easily moved the posttreatment STL points to the certain locations of pretreatment. This was done by placing 4 sets of landmark points on the 3D STL points. MIMICS then calculated the transformation matrix that should be applied to have the best fit between the start and end points and applied that transformation matrix on the selected STL points. After point registration, the STL registration was performed to register the STL points on the CT masks to improve the accuracy of registration. All registrations were performed 3 times in 2 weeks, and we selected the best one for measurement in this study. Repeated registration and identification of corresponding point landmarks ensured the accuracy of the registrations, which were performed carefully; the results are shown in Figures 2 and 3 .
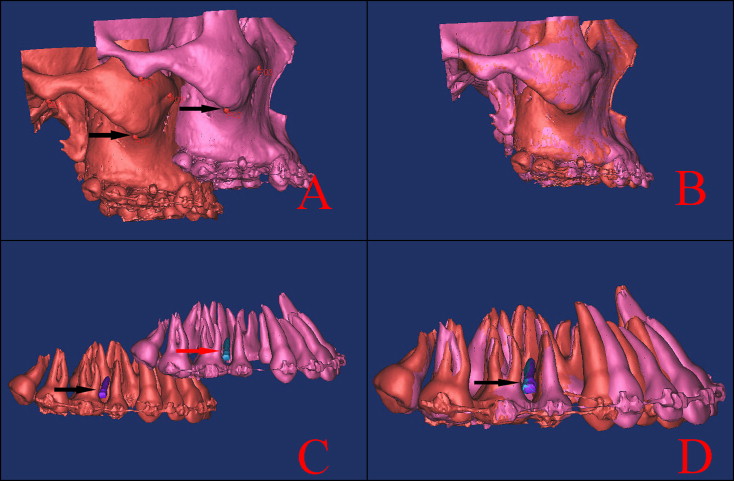
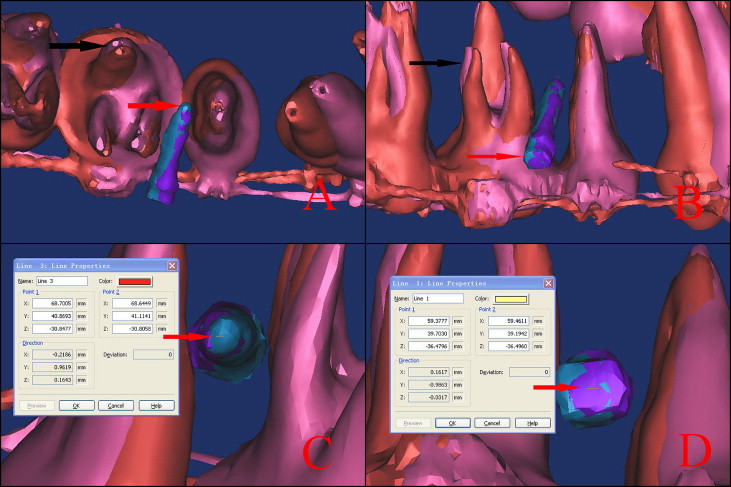
After registration, the 3D position changes of the miniscrews and teeth could be evaluated ( Fig 3 , A and B ). The deviations of the first molar were evaluated at the various cusp tips and the root apices, and the deviation of the miniscrews were evaluated at the apex and the head. In the MIMICS software, the 3D coordinate values were redefined: the x-axis, y-axis, and z-axis represented the bucco-palatal, disto-mesial, and vertical positions individually. The 3D coordinate values of the same 2 points were acquired at pretreatment and posttreatment, and the drift distances in the 3 directions were calculated by subtraction of the 3D coordinate values ( Fig 3 , C and D ).
The error of the method was calculated for linear measurements, based on double measurements of 10 randomly selected patients. It was estimated with the formula, s = √∑(d) 2 /2n, where n is the number of paired measurements and d is the deviation between the 2 measurements.
Statistical analysis
All statistical analyses of drift distances were performed by using the SAS software package (version 9.13, SAS Institute, Cary, NC). For each variable measured on the 3D models, the mean and standard deviation were calculated. Differences between displacement of the miniscrew head and tip were assessed for significance by using paired t tests, whereas the comparisons of displacement among 3 roots and 4 crown cusps were assessed for significance by using 2-way analysis of variance (ANOVA), respectively.
One examiner (L.H.) measured all parameters of the 30 radiographs twice at a 2-month interval on randomly selected radiographs. Differences of mean values between the 2 measurements were assessed by using paired t tests.
Results
The error of the method was negligible for all measurements (0.04 mm; SD, 0.14 mm). There was no significant difference between the 2 measurements with paired t tests. After 6 months of orthodontic loading on the miniscrews, the amounts of maxillary incisor retraction at the edge and the apex were 5.94 ± 0.90 mm and 1.40 ± 0.23 mm, respectively, with 1.84 ± 0.26 mm of maxillary central incisor intrusion. The amounts of mesial drift of the miniscrews were 0.23 ± 0.08 mm (mean ± SD) at the head and 0.23 ± 0.07 mm (mean ± SD) at the apex ( Fig 4 ). There were slight drifts of the miniscrews in the buccopalatal and vertical directions, without statistical significance.