Introduction
Mechanical stress can induce molecular changes in gingival crevicular fluid (GCF) and the periodontal ligament (PDL). It is still not clear whether changes in the PDL and GCF are linked. In this study, we aimed to analyze the expression of cytokines in GCF and PDL after mechanical stress.
Methods
Twenty-three healthy patients were included. The experimental group consisted of premolars subjected to a force of 0.980 N for 1, 3, 7, 14, 21, or 28 days. The contralateral teeth were the controls. GCF and PDL samples were collected at the same time points for analysis of cytokines using the cytometric bead array.
Results
Interleukin (IL)-6 (IL-6) production was significantly elevated in the PDL on day 1 after force application. Significantly strong positive correlations between GCF and PDL in experimental group were seen on days 3 (interferon-gamma), 7 (IL-10), 14 (IL-17A), and 28 (IL-17A, tumor necrosis factor-alpha), and significantly strong negative correlation were seen on days 14 (interferon-gamma) and 21 (IL-2, IL-10).
Conclusions
Different patterns of IL-6 expression were seen in the PDL and GCF after mechanical stress. Despite occasional correlations between GCF and PDL, the molecular contributions of the PDL to the GCF changes could not be clearly defined by our model.
Highlights
- •
Raised levels of IL-6 were seen in the periodontal ligament after orthodontic stimuli.
- •
A few strong correlations of cytokines in gingival crevicular fluid and periodontal ligament were seen.
Gingival crevicular fluid (GCF) is a transudate of interstitial tissues produced by an osmotic gradient. This initial preinflammatory fluid, on stimulation, becomes an inflammatory exudate, approaching serum concentrations. It contains a mixture of molecules from blood, host tissue, and plaque biofilms, such as electrolytes, proteins, small molecules, cytokines, antibodies, enzymes, and bacterial antigens. Under conditions that induce bone and connective tissue remodeling, such as periodontitis and orthodontic tooth movement, there is a release of inflammatory mediators in GCF and the periodontal ligament (PDL). In these circumstances, augmented levels of different cytokines have been reported. GCF provides a unique window for the analysis of periodontal conditions. However, there is no practical and accurate periodontal indicator based on GCF because of extremely complex issues such as periodontal diseases, their microbial causes, cell regulations, and tissue reactions during inflammation and healing. In addition, the information regarding the release of molecules in GCF after orthodontic tooth movement is still limited.
Although GCF is considered to be associated with changes in the PDL, no studies are available that have concomitantly evaluated cytokine expression in GCF and PDL. It is hypothesized that mechanical stimuli might trigger similar molecular changes in the PDL and GCF. It is still not clear whether these changes are, in part, linked. The aim of this study was to estimate the contributions of the PDL to the GCF changes, by concomitantly evaluating the molecular profiles in these 2 areas with mechanical stimuli.
Material and methods
Twenty-three patients (11 male, 12 female), aged 10 to 24 years (mean, 13.43 ± 2,64 years), seen in the Department of Pediatric Dentistry and Orthodontics, Faculty of Dentistry, Universidade Federal de Minas Gerais, Belo Horizonte, Minas Gerais, Brazil, from August 2011 to July 2013, were selected to participate in this study. All patients required extraction of their premolars for orthodontic reasons, such as crowding, dental biprotrusion, or Class II malocclusion, before orthodontic treatment. The inclusion criteria were as follows: (1) healthy patients with no evidence of type 1 or type 2 diabetes mellitus or osteoporosis; (2) patients who had not taken systemic antibiotics, or anti-inflammatory or hormonal drugs for 6 months before the study; (3) patients who required tooth extractions before treatment with fixed appliances; and (4) patients with good periodontal health and no radiographic evidence of periodontal bone loss.
This study was approved by our institutional ethics committee (protocol number 175.320/2012) and conducted in accordance with the Helsinki Declaration of 1975, as revised in 2000. Informed consent was obtained from each participant and his or her guardian if the patient was less than 18 years of age. At the first appointment (baseline), the Silness and Löe plaque index and the gingival bleeding index were recorded to ensure that the patients had no periodontal alteration at the start of the study. The mandibular or maxillary premolars without orthodontic appliances were used as the controls. The experimental group consisted of the contralateral teeth from the same arch that previously received orthodontic mechanical loading. The orthodontic appliance consisted of 0.022 × 0.028-in light Roth tubes (Eurodonto, Curitiba, Paraná, Brazil) and brackets (Aditek do Brasil, Cravinhos, São Paulo, Brazil) bonded with Transbond XT (3M Unitek, Monrovia, Calif). A 0.017 × 0.025-in beta-titanium alloy cantilever and a 0.010-in metallic ligature (Morelli Orthodontics, Sorocaba, São Paulo, Brazil) were placed between the premolar and the first molar on the same side by an orthodontist (D.F.M.) ( Fig 1 , A ). A force in the apical direction was applied to the premolar. The force magnitude was 0.980 N, measured with a digital tensiometer (model FGV-1X; Nidec-Shimpo, Itasca, Ill) that was perpendicular to cantilever ( Fig 1 , B ). No other forces were applied to the teeth before or during this phase. The experimental teeth were randomly selected. If a patient had 4 premolars to be extracted, pairs of teeth were allocated to 2 time points. The patients were instructed about proper oral hygiene. After mechanical stimuli, the teeth were extracted at these time points: 1, 3, 7, 14, 21, or 28 days. Just before the extractions, the force magnitude was measured again. The experimental and control teeth were extracted at the same time. Several time points were chosen to allow the evaluation of cytokine fluctuation after mechanical stimuli concomitantly in the PDL and GCF. After the experimental period, the patients were referred to start orthodontic treatment.
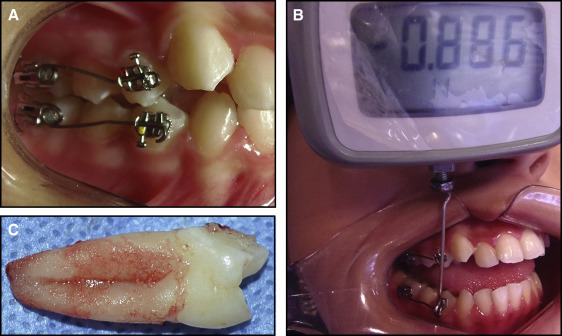
GCF samples were collected using periopaper strips (gingival fluid collection strips; Oraflow, Smithtown, NY) at the mesiobuccal and distobuccal sites of the control and experimental premolars. The teeth were previously isolated with cotton rolls, cleaned of plaque deposits, and dried gently with air before the paper strips were carefully inserted 1 mm into the gingival crevice for 30 seconds. Samples of GCF absorbed by the periopapers were measured using a calibrated Periotron 8000 (model 400 8000 precision gingival crevice fluid meter; Oraflow). Readings from the Periotron were converted to an actual volume (microliters) by reference to a standard curve calibrated with human serum. The PDL of each extracted tooth was taken from all root surfaces and immediately scraped using a 13/14 Gracey curette (Maximus, Contagem, Minas Gerais, Brazil) ( Fig 1 , C ). All tooth extractions and sample collections were performed by 1 professional (D.F.M.).
Samples of GCF and PDL were separately placed in sterile tubes that were immediately immersed in liquid nitrogen, and then kept frozen at −80°C for further analysis. Afterward, the GCF and PDL samples were separately homogenized in phosphate-buffered saline solution (0.4 mmol/L of sodium chloride and 10 mmol/L of sodium phosphate containing protease inhibitors [0.1 mmol/L of phenylmethylsulfonyl fluoride, 0.1 mmol/L of benzethonium chloride, 10 mmol/L of ethylenediaminetetraacetic acid, 0.01 mg/mL of aprotinin A, and 0.05% Tween-20 at 1 mg/mL]). The mixture was agitated on vortex for 30 seconds and then centrifuged (12.000 g) for 10 minutes at 4°C. Supernatants were collected and assayed with the cytometric bead array (CBA). Analyses of PDL and GCF were determined using a BD CBA Human Th1/Th2/Th17 Cytokine Kit (Becton, Dickinson and Company, BD Biosciences, San Diego, Calif) and analyzed on a BD FACSCalibur flow cytometer (Becton, Dickinson and Company). The concentrations of analytes (interleukin [IL]-2, IL-4, IL-6, IL-10, IL-17A, interferon-gamma [IFN-γ], and tumor necrosis factor-alpha [TNF-α]) were measured using a standard curve according to the manufacturer’s instructions. The sensitivity of the assays was 20 to 5000 picograms per milliliter for all cytokines. The results were expressed in picograms per milliliter for GCF and picograms per 100 mg of tissue for the PDL.
Statistical analysis
The Shapiro-Wilk test was used to assess quantitative variables ( P <0.05). For cytokines in which normality was seen, parametric tests were used, and for those without normality of cytokines, nonparametric tests were performed. The Mann-Whitney test was used to verify the influence of sex on the cytokines. The Kruskal-Wallis test was performed to compare cytokine levels and types of teeth. Paired Student t tests (parametric cytokines) and Wilcoxon tests (nonparametric cytokines) were used to assess the influence of these molecules on the experiment at each time point and to verify the difference of the collected GCF volumes between groups. Pearson (when both variables were parametric) and Spearman (when at least 1 variable was nonparametric) correlations were used to assess the association between age, plaque index, bleeding on probing, and cytokines, and also the correlations between cytokine levels in PDL and GCF, stratified by experimental and control groups. The analysis was performed for each time point separately. The level of statistical significance was set at P <0.05. All statistical evaluations were performed with SPSS software (version 19.0; IBM, Armonk, NY).
Results
A total of 68 premolars were obtained (36 maxillary first premolars, 2 maxillary second premolars, 28 mandibular first premolars, and 2 mandibular second premolars). A mean of 5.67 (n = 5-6) pairs of teeth was allocated at each time point. The appliances were well tolerated. Demographic descriptions of the participants are in Table I . The clinical gingival conditions were satisfactory at baseline, and no significant difference was seen for the plaque index or the gingival bleeding index between the groups. Although no difference between GCF volumes was seen on days 1, 3, 14, or 28 ( P >0.05), increased volumes of GCF were seen on days 7 and 21 for the experimental group ( P <0.05). The initially applied force magnitude of 0.980 N was gradually reduced to a mean of 0.866 ± 0.166 N just before extraction of the experimental teeth. Sex, type of tooth, age of participants, and experimental force had no influence on the concentrations of the examined cytokines at any time ( P >0.05).
| Time point (d) | n | Sex | Age (y) | PI | GBI | Control VGCF (μL) | Experimental VGCF (μL) | Initial force (N) | Final force (N) |
|---|---|---|---|---|---|---|---|---|---|
| 1 | 5 | 1M, 4F | 13.66 ± 3.44 | 0.09 ± 0.04 | 0.04 ± 0.02 | 0.47 ± 0.25 | 0.44 ± 0.10 | 0.98 ± 0.00 | 0.98 ± 0.00 |
| 3 | 5 | 2M, 3F | 15.66 ± 5.22 | 0.08 ± 0.03 | 0.03 ± 0.02 | 0.48 ± 0.19 | 0.92 ± 0.30 | 0.98 ± 0.00 | 0.86 ± 0.13 |
| 7 | 6 | 3M, 3F | 14.50 ± 21.17 | 0.14 ± 0.06 | 0.09 ± 0.04 | 0.47 ± 0.22 | 1.05 ± 0.30 ∗ | 0.98 ± 0.00 | 0.92 ± 0.07 |
| 14 | 6 | 2M, 4F | 12.67 ± 1.67 | 0.17 ± 0.05 | 0.10 ± 0.05 | 0.20 ± 0.13 | 0.33 ± 0.20 | 0.98 ± 0.00 | 0.90 ± 0.09 |
| 21 | 6 | 2M, 4F | 12.17 ± 1.17 | 0.15 ± 0.04 | 0.13 ± 0.03 | 0.22 ± 0.08 | 0.46 ± 0.14 ∗ | 0.98 ± 0.00 | 0.81 ± 0.10 |
| 28 | 6 | 4M, 2F | 12.33 ± 1.67 | 0.11 ± 0.03 | 0.06 ± 0.03 | 0.44 ± 0.19 | 0.52 ± 0.20 | 0.98 ± 0.00 | 0.73 ± 0.05 |
| Total | 23 | 11 M, 12 F | 13.43 ± 2.64 | 0.12 ± 0.05 | 0.07 ± 0.05 | 0.35 ± 0.18 | 0.57 ± 0.31 | 0.98 ± 0.00 | 0.87 ± 0.18 |
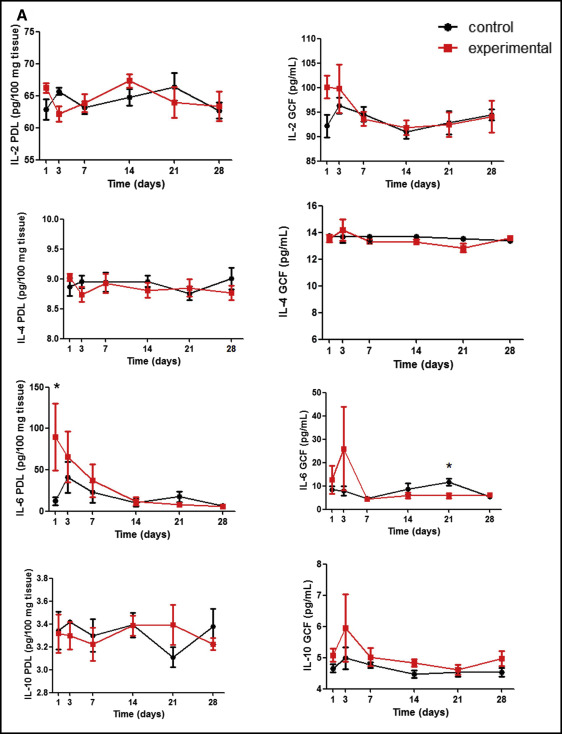
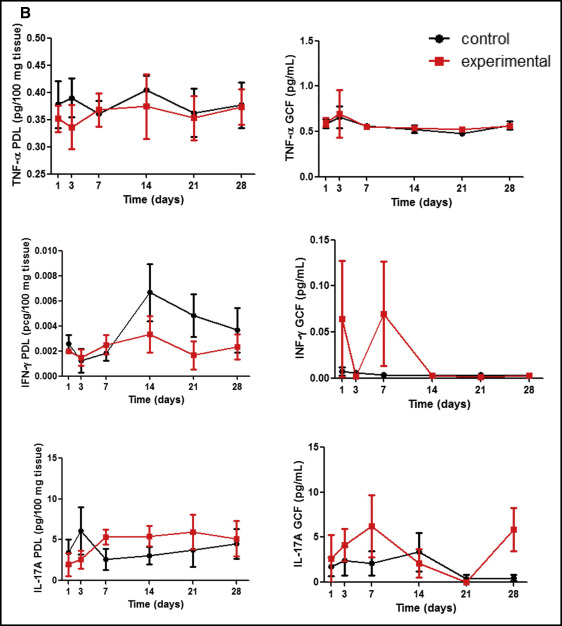
Figure 2 , A shows cytokine concentrations of Th2 response: interleukin-2 (IL-2), interleukin-4 (IL-4), interleukin-6 (IL-6), and interleukin-10 (IL-10). Th17, interleukin 17-A (IL-17A), and Th1, TNF-α, and IFN-γ levels are shown in Figure 2 , B . On day 1, a significant increase of IL-6 was seen in the PDL subjected to mechanical stress in relation to the control ( P = 0.043). Then, the IL-6 levels in the PDL were gradually reduced. In GCF, the peak of IL-6 was later than that observed for the PDL on day 3, with a subsequent decrease. On day 21, IL-6 concentration in the GCF of the experimental group was lower than that of the control ( P = 0.028). Descriptive analyses showed a similar phenomenon in the GCF for IL-10, IL-17A, and IFN-γ. Those cytokines seemed to increase at the beginning of orthodontic tooth movement in the experimental group, followed by a subsequent decrease at later stages, although there were no significant differences between the groups for any of these evaluated molecules ( P >0.05).
The correlations of cytokines in the PDL and GCF are described in Table II . Interestingly, a significantly strong positive correlation in the experimental group was observed on days 3 (IFN-γ), 7 (IL-10), 14 (IL-17A), and 28 (IL-17A, TNF- α), with significantly strong negative correlations on days 14 (IFN-γ) and 21 (IL-2, IL-10). For the control group, significantly strong negative correlations were seen on days 1 (IL-4), 21 (IFN-γ), and 28 (IL-2, IFN-γ)
| Day 1 | Day 3 | Day 7 | Day 14 | Day 21 | Day 28 | |
|---|---|---|---|---|---|---|
| Experimental, GCF vs PDL | ||||||
| IL-2 | −0.355 | 0.669 | 0.209 | −0.115 | −0.916 ∗ | −0.216 |
| IL-4 | −0.229 | −0.527 | 0.714 | 0.447 | −0.551 | 0.103 |
| IL-6 | −0.600 | 0.600 | 0.714 | −0.400 | 0.029 | 0.500 |
| IL-10 | −0.224 | 0.200 | 0.899 ∗ | −0.359 | −0.899 ∗ | −0.600 |
| IL-17A | −0.395 | −0.289 | −0.185 | 0.894 ∗ | −0.417 | 0.895 ∗ |
| IFN-γ | −0.148 | 0.900 ∗ | 0.086 | −0.949 ∗ | −0.516 | −0.300 |
| TNF-α | −0.053 | 0.400 | 0.235 | −0.400 | 0.058 | 0.900 ∗ |
| Control, GCF vs PDL | ||||||
| IL-2 | 0.862 | 0.251 | 0.147 | 0.737 | 0.054 | −0.891 ∗ |
| IL-4 | −903 ∗ | 0.708 | 0.800 | 0.505 | 0.549 | 0.052 |
| IL-6 | 0.300 | 0.400 | 0.429 | 0.400 | 0.116 | 0.800 |
| IL-10 | −0.483 | 0.141 | 0.611 | 0.392 | 0.245 | −0.041 |
| IL-17A | −0.860 | −0.287 | −0.290 | 0.112 | −0.417 | −0.447 |
| IFN-γ | −0.103 | 0.700 | 0.429 | 0.205 | −0.899 ∗ | −0.800 |
| TNF-α | −0.414 | −0.095 | −0.168 | −0.140 | 0.104 | −0.301 |
Stay updated, free dental videos. Join our Telegram channel
VIDEdental - Online dental courses


