Introduction
The association between pediatric sleep-disordered breathing caused by upper airway obstruction and craniofacial morphology is poorly understood and contradictory. The aims of this study were to evaluate the prevalence of children at risk for sleep-disordered breathing, as identified in an orthodontic setting by validated screening questionnaires, and to examine associations with their craniofacial and upper airway morphologies. A further aim was to assess the change in quality of life related to sleep-disordered breathing for affected children undergoing rapid maxillary expansion to correct a palatal crossbite or widen a narrow maxilla.
Methods
A prospective case-control study with children between 8 and 17 years of age (n = 81) at an orthodontic clinic was undertaken. The subjects were grouped as high risk or low risk for sleep-disordered breathing based on the scores from a validated 22-item Pediatric Sleep Questionnaire and the Obstructive Sleep Apnea-18 Quality of Life Questionnaire. Variables pertaining to a screening clinical examination, cephalometric assessment, and dental cast analysis were tested for differences between the 2 groups at baseline. Ten children who underwent rapid maxillary expansion were followed longitudinally until removal of the appliance approximately 9 months later with a repeated Obstructive Sleep Apnea-18 Quality of Life Questionnaire. All data were collected blinded to the questionnaire results.
Results
The frequency of palatal crossbite involving at least 3 teeth was significantly higher in the high-risk group at 68.2%, compared with the low-risk group at 23.2% ( P <0.0001). Average quality of life scores in the high-risk group indicated reduced quality of life related to sleep-disordered breathing by 16% compared with children in the low-risk group at baseline ( P <0.0001). Cephalometrically, mean inferior airway space, posterior nasal spine to adenoidal mass distance, and adenoidal mass to soft palate distance were reduced in the high-risk group compared with the low-risk group by 1.87 mm ( P <0.03), 2.82 mm ( P <0.04), and 2.13 mm ( P <0.03), respectively. The mean maxillary intercanine, maxillary interfirst premolar, maxillary interfirst molar, mandibular intercanine, and mandibular interfirst premolar widths were reduced in the high-risk group compared with the low-risk group by 4.22 mm ( P <0.0001), 3.92 mm ( P <0.0001), 4.24 mm ( P <0.0001), 1.50 mm ( P <0.01), and 1.84 mm ( P <0.01), respectively. Children treated with rapid maxillary expansion showed an average improvement of 14% in quality of life scores in the high-risk group compared with the low-risk group, which showed a slight worsening in quality of life related to sleep-disordered breathing by an average of 1% ( P <0.04), normalizing the quality of life scores in the high-risk children to the baseline scores compared with the low-risk group.
Conclusions
Children at high risk for sleep-disordered breathing are characterized by reduced quality of life, reduced nasopharyngeal and oropharyngeal sagittal dimensions, palatal crossbite, and reduced dentoalveolar transverse widths in the maxillary and mandibular arches. No sagittal or vertical craniofacial skeletal cephalometric predictors were identified for children at high risk for sleep-disordered breathing. In the short term, rapid maxillary expansion might aid in improvement of the quality of life for children with a narrow maxilla in the milder end of the sleep-disordered breathing spectrum.
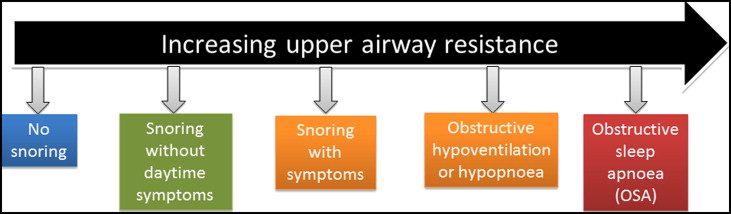
Pediatric sleep-disordered breathing (SDB) caused by upper airway obstruction is associated with the cardinal symptom of snoring. In children, SDB exhibits a spectrum of severity ranging from primary snoring as the mildest form to obstructive sleep apnea (OSA) as the most severe. Primary snoring is not associated with any gas exchange abnormalities or sleep fragmentation, whereas OSA is characterized by repetitive and prolonged partial or complete upper airway obstruction that disrupts normal ventilation during sleep. The spectrum of SDB ( Fig 1 ) in children has gained increased attention because of the deleterious health implications if it is left undiagnosed or untreated.
The reported prevalence of primary snoring ranges from 3.2% to 35%, and OSA ranges from 0.7% to 10.3% in children, depending on the diagnostic instrument used to measure SDB, with most authors reporting prevalences of 10% for primary snoring and <3% for OSA. Although snoring was once believed to be benign, it is now recognized that it can be associated with significant sleep disruption and daytime symptoms. Both primary snoring and OSA are known to impact quality of life, behavior, and neurocognition, the cardiovascular system, and lipid regulation in children. Children affected by SDB are more likely to be diagnosed with attention deficit hyperactivity disorder. There is relatively poor recognition of pediatric SDB in clinical practices because approximately 80% of symptomatic habitual snorers are not reported to their general medical practitioners. In addition, there is a 226% (2.3-fold) increase in health care utilization among children with OSA compared with the unaffected population. Hence early diagnosis and intervention should be beneficial and cost-effective.
Many studies have reported a positive relationship between craniofacial characteristics such as high palatal vault, narrow maxilla, mandibular retrognathia, increased facial height, and SDB in nonsyndromic children. However, evidence from 2 meta-analyses suggests that the sagittal and vertical craniofacial associations, as measured on a lateral cephalogram, might have low clinical significance in predicting childhood SDB. In contrast, evidence from clinical trials indicates that rapid maxillary expansion (RME) might be an effective treatment for children with a narrow maxilla and OSA. Little attention has been paid to children in the snoring end and the middle of the SDB spectrum. A recent questionnaire-based screening study by Huynh et al assessed patients in an orthodontic setting, with most children being at the milder end of the SDB spectrum. They found that SDB was primarily associated with adenotonsillar hypertrophy and morphologic features such as narrow palate, dolichofacial pattern, high mandibular plane angle, and severe maxillary and mandibular crowding. Interestingly, Huynh et al did not assess radiographic or dental cast measurements and relied solely on a visual clinical screening examination. Hence, the association between craniofacial and upper airway morphology and pediatric SDB in the orthodontic setting can be regarded as poorly understood and somewhat contradictory.
The primary cause of SDB in children is reported to be adenotonsillar hypertrophy, which results in upper airway obstruction particularly when accompanied by other factors affecting airway patency or muscle tone. Adenotonsillectomy is therefore recommended as the first line of treatment for pediatric SDB and is curative in 25% to 80% of patients. Normalization after adenotonsillectomy surgery is less frequently seen in black children, obese children, and those with severe OSA at baseline. Nasal continuous positive airway pressure is a nonsurgical alternative treatment, but there is evidence of developmental midface hypoplasia and other craniofacial side effects in children with this approach. Dentofacial orthopedics, particularly RME, is an emerging treatment modality in the management of pediatric OSA.
Overnight polysomnography is considered the gold standard for diagnosis of OSA in children; however, polysomnography is expensive, time-consuming, and frequently inaccessible. Various validated screening questionnaires have been developed to aid in the screening of children with SDB by standardizing history taking and evaluating quality of life, behavior, neurocognition, and caregiver concerns. The quality of sleep is related to the quality of life, and the measurement of health-related quality of life provides an assessment of the health status of a clinical sample and the effects of intervention, as perceived by the parent or the patient. To date, there are no data on changes in SDB-related quality of life after RME treatment for children at the snoring end of the SDB spectrum. Therefore, the main aims of this study were to evaluate the prevalence of children at risk for SDB, as identified in an orthodontic setting by validated screening questionnaires, and to examine associations with craniofacial and upper airway morphology. A further aim was to assess the change in the SDB-related quality of life for affected children having RME to correct a palatal crossbite or widen a narrow maxilla.
Material and methods
Ethical permission was granted by the Royal Adelaide Hospital (Adelaide, Australia) Human Research Ethics Committee. Informed consent was obtained from all parents or guardians, and verbal assent from the children before data collection for the study.
The subjects were children less than 18 years of age who came to the orthodontic clinic for diagnosis and treatment between February 2012 and April 2013. Good general health, normal weight, the availability of study models or lateral cephalometric radiographs within 6 months of the baseline orthodontic examination (T1), and no previous orthodontic treatment were required for inclusion. The initial sample comprised 81 children. Weight and height were measured at the orthodontic examination to calculate the body mass index (weight in kilograms divided by height in meters squared) for each child. Since obesity might be a confounding factor, 3 children with a body mass index above the 95th percentile (>31.9 kg/m 2 ) of the group were removed from the primary statistical analyses, leaving a final study cohort of 78 children (33 boys, 45 girls). Lateral cephalograms for 6 children and dental casts for 11 children were not taken at T1 for patient management reasons.
The parents or guardians at the clinical examination were asked to complete a medical history and 2 questionnaires on behalf of their children to assess sleep, daytime behavior, and sleep duration and quality at T1. The sleep and daytime behavior questionnaire was a modified and validated 22-item Pediatric Sleep Questionnaire (PSQ). All positive responses were grouped under “yes” and all negative responses under “no.” Each “yes” response was given a score of 1. The second questionnaire was the validated and modified version of the OSA-18 to assess the children’s quality of life in 4 domains that included sleep disturbance, physical discomfort, emotional distress, and caregiver concerns. At the end of the OSA-18 Quality of Life Questionnaire, the parents were asked to mark the perceived quality of life of their child caused by issues related to sleep and breathing on a 0 to 10 visual analog scale, with higher scores indicating a better SDB-related quality of life. The scoring for the PSQ varies from 0 to 22 points, with higher scores indicating greater severity; the scoring for OSA-18 varies from 15 to 126 points, with higher scores indicating a worse quality of life. Studies have validated that if a child’s PSQ score is greater than 7 “yes” responses or the OSA-18 score is greater than 60, a high probability of SDB can be expected. The PSQ has a sensitivity of 0.85 and a specificity of 0.87 in predicting SDB in comparison with the polysomnography. Children were grouped as “high risk” or “low risk” according to the results of the 2 questionnaires, with the high-risk group having more than 7 “yes” responses to the PSQ or a score of 60 or more on the OSA-18 questionnaire.
Fifteen participants (68.2%) in the high-risk group and 13 (23.2%) in the low-risk group were diagnosed with a palatal crossbite or a narrow maxilla and were recommended for RME treatment. Five children in the high-risk group and 5 in the low-risk group (n = 10) who underwent RME (mean age, 10.3 ± 1.3 years) were followed longitudinally until removal of the appliance (T2) approximately 7 to 9 months later (mean age, 10.9 ± 1.3 years). The RME appliance was a 4-banded hyrax-type with a rate of activation of 0.5 mm daily. The expansion was stopped between 14 and 21 days, or once the palatal cusps of the maxillary molars were in line with the buccal cusps of the mandibular molars, to allow for some relapse. After expansion, the RME device served as a passive retainer to allow sutural and bony adaptation. Since the OSA-18 Quality of Life Questionnaire has been validated to measure changes in SDB-related quality of life in a pediatric sample, it was repeated at T2 to assess the quality of life changes in the children treated with RME.
All subjects were clinically evaluated at T1 under the supervision of orthodontists, blinded to the questionnaire results, using a standardized orthodontic evaluation form covering dental, skeletal, functional, and esthetic factors. Sagittal craniofacial form was recorded as skeletal Class I, Class II, or Class III. Vertical evaluation included the visual categorization of face height as mesofacial, brachyfacial, and dolichofacial. The presence or absence of a palatal crossbite involving at least 3 teeth was recorded.
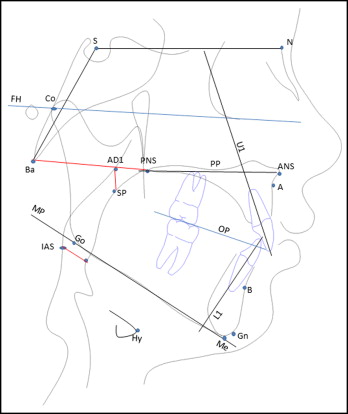
Fifty-five children in the low-risk group and 17 in the high-risk group (n = 72) had lateral cephalograms taken at T1, all taken on the same machine (Kodak Carestream CS 9000; Eastman Kodak Company, Rochester, NY), with the patient erect in natural head position, the teeth in maximum intercuspation, and the lips relaxed. The enlargement factor (8%) was adjusted to provide true size measurements. The cephalograms were digitized and analyzed using Dolphin Imaging software (version 11.5; Dolphin Imaging and Management Solutions, Chatsworth, Calif). The cephalometric landmarks and analyzed planes are shown in Figure 2 . Cephalometric measurements included 17 morphologic, 3 airway, and 1 hyoid position variables. The cephalometric variables tested were as follows.
- 1.
Cranial base assessment: cranial base length (SN length) and cranial base flexion (NSBa angle).
- 2.
Maxillary and mandibular skeletal assessment: maxillary position in relation to cranial base (SNA angle), mandibular position in relation to cranial base (SNB angle), maxillomandibular sagittal differential (ANB angle and Wits appraisal), maxillary length (Co–A-point), mandibular length (Co-Gn), and maxillomandibular length differential (Mx-Md, difference between maxillary and mandibular lengths).
- 3.
Vertical skeletal assessment: palatal plane to cranial base reference (SN-PP angle), mandibular plane to cranial base (FH-MP angle), maxillary-mandibular divergence (PP-MP angle), posterior face height (Co-Go), and lower anterior face height (ANS-Me).
- 4.
Dental measurements: angulation of maxillary incisor to cranial base (U1-SN angle), angulation of mandibular incisor to mandibular plane (L1-MP angle), and occlusal plane in relation to cranial base (OP-FH angle).
- 5.
Airway dimensions: oropharyngeal airway dimension (IAS), nasopharyngeal airway dimension (PNS-AD1), and patency of nasopharyngeal airway (AD1-SP).
- 6.
Hyoid position: perpendicular distance from anterosuperior point on hyoid body to mandibular plane (Hy-MP).
Forty-six children in the low-risk group and 21 children in the high-risk group had dental casts available (n = 67) at T1. Photocopies of dental models were taken for measurements and analyzed to true size (photocopier Aficio MP C5502a; Ricoh, Tokyo, Japan). The dental casts were not used for direct data collection to prevent their damage during repeated measurements. Centroids of the crowns of the canines, first premolars, and first molars were located in the occlusal plane according to the method of Moyers et al. The centroid of a dental crown in the occlusal plane is defined as the point halfway between 2 points calculated by joining the 2 approximal midpoints and the buccal and lingual midpoints. The corresponding centroids were used for intra-arch linear measurements. Calibrated digital sliding calipers were used for all measurements including maxillary intercanine width (MxIC), maxillary interfirst premolar width (MxIPM), maxillary interfirst molar width (MxIM), mandibular intercanine width (MdIC), mandibular interfirst premolar width (MdIPM), and mandibular interfirst molar width (MdIM). When permanent teeth were absent or unerupted, their deciduous counterparts were used as substitutes.
All cephalometric and dental cast measurements were made by the same investigator (V.K.), who was blinded to the results of the 2 questionnaires. Ten radiographs and study models were chosen at random and analyzed at least 2 weeks apart to calculate the error of the method. Intraclass correlation coefficients (ICC) were calculated using a 2-way mixed model and absolute agreement type for all angular and linear cephalometric variables. ICC values varied from 0.973 to 0.997 for the angular cephalometric measurements, from 0.912 to 0.981 for the linear cephalometric measurements, and from 0.992 to 0.998 for the dental cast measurements. This indicates a satisfactory level of intraobserver reliability.
Statistical analysis
Sample-size calculations were done a priori using cephalometric variables (ANB angle, FH-MP angle, and PNS-AD1) from previous meta-analyses. The calculated power of the study exceeded 0.90 at an alpha of 0.05, with sample sizes of the examined groups from 55 to 70 subjects.
All data were analyzed using SPSS Statistics for Windows software (version 21; IBM, Armonk, NY). The assumptions behind each statistical test were assessed and validated. Data are presented as means and the standard deviations for continuous variables, and frequencies or percentages for categorical variables. Pearson correlations were performed to check the associations between the questionnaire scores and patient data. The differences between the 2 groups for continuous variables at T1 were tested for statistical significance with a t test for independent samples and for matched pairs with a paired-sample t test. The high-risk and low-risk participants were further subdivided by age at T1 into young children (ages, 8-12.9 years) and teenagers (ages, 13-18 years) for subgroup analyses. When an independent t test indicated a significant difference, subgroup analysis was performed to enable greater resolution of the results using univariate analysis of variance test by pairwise comparison with the Bonferroni correction applied. Odds ratios were calculated for exposure and outcome categorical variables, and significance was tested with a 2 × 2 chi-square test. Statistical significance was assessed at P <0.05 (2 tailed). The data at T1 from the 3 excluded children were analyzed separately in a sensitivity analysis.
Results
The mean age of the final cohort of 78 children at T1 was 12.3 ± 2.5 years (range, 8.3-17.6 years). Sixty-eight children (87.1%) were white. Sixty (76.9%) questionnaires were completed by mothers, 10 (12.8%) by fathers, and 8 (10.3%) by guardians or grandparents of the children. The low-risk group (control) comprised 23 boys and 33 girls, and the high-risk group comprised 10 boys and 12 girls. No child in the low-risk group was reported as a habitual snorer based on the 2 questionnaires.
Demographic data at T1 for both groups are presented in Table I . Quality of life scores in the high-risk group were 39.9 ± 15.6 compared with the low-risk group at 22.6 ± 6.9, indicating worsening in SDB-related quality of life by 16% in the high-risk group ( P <0.0001). The prevalence of a palatal crossbite involving at least 3 teeth was significantly higher in the high-risk group at 68.2% than in the low-risk group at 23.2% ( P <0.0001). At T1, the OSA-18 Quality of Life scores and the PSQ scores correlated highly with each other (r = 0.81; P <0.0001), but the perceived quality of life correlated moderately with OSA-18 Quality of Life scores (r = −0.61; P <0.0001) and PSQ scores (r = −0.53; P <0.0001). The frequencies of positive responses to the PSQ survey are shown in Table II . Odds ratios and their 95% confidence intervals (CI) with statistical significance are also presented in Table II for a palatal crossbite involving at least 3 teeth and its association with each question of the PSQ.
| Demographics at T1 | HR group n = 22 Mean ± SD | LR group n = 56 Mean ± SD | Significance P value |
|---|---|---|---|
| Age (y) | 12.10 ± 2.26 | 12.49 ± 2.64 | 0.54 (NS) |
| Young children:teens (n) | 13:9 | 28:28 | 0.80 (NS) |
| Male:female ratio | 10:12 | 23:33 | 0.72 (NS) |
| BMI (kg/m 2 ) | 21.04 ± 4.76 | 21.26 ± 3.67 | 0.84 (NS) |
| Previous adenotonsillectomy (n) | 4 | 4 | 0.15 (NS) |
| Clinical examination sagittal type (Class I:Class II:Class III) | 9:9:4 | 15:33:8 | 0.34 (NS) |
| Clinical examination vertical type (brachyfacial:mesofacial:dolichofacial) | 8:6:7 | 23:16:17 | 0.96 (NS) |
| Palatal crossbite ≥3 teeth (n [%]) | 15 (68.2) | 13 (23.2) | <0.0001 ∗ |
| PSQ scores | 9.73 ± 3.43 | 2.88 ± 2.01 | <0.0001 ∗ |
| OSA-18 QoL score | 39.91 ± 15.64 | 22.63 ± 6.91 | <0.0001 ∗ |
| OSA-18 QoL parental score | 7.30 ± 1.65 | 8.72 ± 1.28 | <0.0001 ∗ |
| Total sleep time (h) | 10.06 ± 0.79 | 9.71 ± 0.98 | 0.14 (NS) |
| Survey to evaluate risk for pediatric SDB | Frequency of response of yes (%) | OR (95% CI) for maxillary palatal crossbite | Significance P value |
|---|---|---|---|
| 1. Child usually snores at night | 34 | 4.32 (1.57-11.90) | <0.01 ∗ |
| 2. Child always snores at night | 14 | 4.03 (1.01-16.17) | <0.04 † |
| 3. Child snores loudly at night | 25 | 7.17 (2.27-22.62) | <0.0001 ‡ |
| 4. Child breathes loudly or heavily at night | 34 | 6.60 (2.18-20.25) | <0.0001 ‡ |
| 5. Child has trouble breathing at night | 8 | 11.50 (1.26-104.86) | <0.01 ∗ |
| 6. Child ever stops breathing at night | 7 | 8.73 (0.92-82.69) | <0.03 † |
| 7. Child breathes through the mouth during the day | 58 | 2.08 (0.71-6.09) | NS |
| 8. Child has dry mouth on waking | 44 | 4.00 (1.38-11.58) | <0.01 ∗ |
| 9. Child occasionally wets the bed at night | 3 | 1.82 (0.11-30.18) | NS |
| 10. Child appears unrefreshed after sleep | 37 | 2.46 (0.90-6.71) | NS |
| 11. Child has daytime sleepiness | 12 | 0.91 (0.21-3.99) | NS |
| 12. Teacher has commented that child has daytime sleepiness | 6 | 1.25 (0.20-8.00) | NS |
| 13. Hard to wake up child in the morning | 31 | 0.83 (0.30-2.28) | NS |
| 14. Child wakes up with morning headaches | 7 | 8.36 (0.88-9.31) | <0.03 † |
| 15. Child had abnormal growth rate at any time | 4 | 4.27 (0.37-49.68) | NS |
| 16. Child is overweight | 14 | 0.49 (0.10-2.51) | NS |
| 17. Child does not listen when spoken to | 31 | 3.21 (1.16-8.89) | <0.02 † |
| 18. Child has difficulty organizing tasks/activities | 27 | 1.55 (0.55-4.39) | NS |
| 19. Child is easily distracted | 43 | 1.58 (0.61-4.12) | NS |
| 20. Child hand fidgets or squirms in his or her seat | 33 | 1.72 (0.64-4.61) | NS |
| 21. Child is “constantly on the go” | 25 | 3.66 (1.21-11.11) | <0.02 † |
| 22. Child interrupts/intrudes on others | 21 | 1.37 (0.43-4.41) | NS |
Table III summarizes the statistically significant differences in cephalometric and dental cast variables found between the 2 groups. The mean IAS, PNS-AD1, and AD1-SP values were lower in the high-risk group compared with the low-risk group by 1.87 mm ( P <0.03), 2.82 mm ( P <0.04), and 2.13 mm ( P <0.03), respectively. There were highly statistically significant differences between the groups in all width measurements except for MdIM ( P = 0.20). The mean MxIC, MxIPM, MxIM, MdIC, and MdIPM widths were reduced in the high-risk group compared with the low-risk group by averages of 4.22 mm ( P <0.0001), 3.92 mm ( P <0.0001), 4.24 mm ( P <0.0001), 1.50 mm ( P <0.01), and 1.84 mm ( P <0.01), respectively.
| Variable | Mean difference between groups (LR – HR) | 95% CI | Significance P value |
|---|---|---|---|
| Cephalometric analysis (n = 72) | |||
| Cranial base analysis | |||
| S-N (mm) | 1.22 | −0.68-3.13 | 0.20 (NS) |
| N-S-Ba (°) | −0.10 | −3.06-2.86 | 0.95 (NS) |
| Maxillary and mandibular skeletal analysis | |||
| SNA (°) | −0.19 | −2.07-1.68 | 0.84 (NS) |
| SNB (°) | 0.71 | −1.40-2.81 | 0.51 (NS) |
| ANB (°) | −0.66 | −2.44-1.11 | 0.46 (NS) |
| Wits (mm) | −0.87 | −3.26-1.53 | 0.47 (NS) |
| Co-A (mm) | 1.18 | −1.73-4.10 | 0.42 (NS) |
| Co-Gn (mm) | −0.12 | −4.29-4.04 | 0.95 (NS) |
| Mx-Md (mm) | −1.30 | −4.50-1.90 | 0.42 (NS) |
| Vertical skeletal analysis | |||
| SN-PP (°) | 0.35 | −1.31-1.99 | 0.68 (NS) |
| FH-MP (°) | −0.51 | −3.45-2.43 | 0.73 (NS) |
| PP-MP (°) | −1.34 | −4.57-1.90 | 0.41 (NS) |
| Co-Go (mm) | 0.28 | −2.42-2.97 | 0.84 (NS) |
| ANS-Me (mm) | −0.77 | −3.67-2.12 | 0.59 (NS) |
| Dental analysis | |||
| U1-SN (°) | −0.68 | −5.18-3.81 | 0.76 (NS) |
| L1-MP (°) | 2.26 | −2.33-6.85 | 0.33 (NS) |
| OP-FH (°) | 0.75 | −1.67-3.16 | 0.54 (NS) |
| Airway analysis | |||
| IAS (mm) | 1.87 | 0.24-3.49 | <0.03 ∗ |
| PNS-AD1 (mm) | 2.82 | 0.26-5.39 | <0.04 ∗ |
| AD1-SP (mm) | 2.13 | 0.34-3.92 | <0.02 ∗ |
| Hy-MP (mm) | −0.61 | −3.68-2.47 | 0.69 (NS) |
| Dental cast analysis (n = 67) | |||
| Maxillary arch widths | |||
| MxIC (mm) | 4.22 | 2.73-5.70 | <0.0001 † |
| MxIPM (mm) | 3.92 | 2.31-5.53 | <0.0001 † |
| MxIM (mm) | 4.24 | 2.57-5.91 | <0.0001 † |
| Mandibular arch widths | |||
| MdIC (mm) | 1.50 | 0.46-2.53 | <0.01 ‡ |
| MdIPM (mm) | 1.84 | 0.55-3.13 | <0.01 ‡ |
| MdIM (mm) | 0.98 | −0.54-2.50 | 0.20 (NS) |
Stay updated, free dental videos. Join our Telegram channel
VIDEdental - Online dental courses


