Introduction
This investigation was carried out to correlate the normal arch forms of male and female subjects derived mathematically by the beta function with commercially available preformed rectangular nickel-titanium archwires.
Methods
The mathematical beta function was used to derive planar projections of natural archforms by using the spatial coordinates of the labial bracket interfacing surfaces in the maxillary and mandibular arches of both sexes. Graphic planar representations of corresponding bracket base spatial coordinates of archforms of 30 popular rectangular nickel-titanium archwire-bracket assemblies (derived through the same mathematical function) were superimposed on relevant maxillary and mandibular arches.
Results
The rectangular nickel-titanium archwire-bracket assemblies exceeded the intercanine width by averages of 7.159 mm in the maxillary arches of females, 6.289 mm in the maxillary arches of males, 6.667 mm in the mandibular arches of females, and 5.337 mm in the mandibular arches of males. The average intermolar width exceeded the natural width by 2.893 mm in the maxillary arches and 1.861 mm in the mandibular arches. The average intermolar-intercanine width ratios for natural arches (2.11 for mandibular and 1.75 for maxillary) were greater than the ratios for the wire-bracket assemblies (1.78 for mandibular and 1.53 for maxillary).
Conclusions
The prefomed rectangular nickel-titanium archwires might result in wider arch forms. The intercanine width difference is greater than the intermolar width. The differences were more pronounced for arches in female subjects compared with those in males. These findings influence posttreatment retention, stability, and facial esthetics. A subsequent change to stainless steel wires to restore a more natural form and size can lead to round tripping and increased treatment duration.
Archwires are the vital and instrumental components of fixed orthodontic treatment. They store and deliver power through the brackets and bands to the teeth and surrounding tissues. Improperly shaped archwires create and contribute to many posttreatment problems. Unplanned contraction or expansion, especially in the canine or molar regions, produces instability.
With the advent of highly elastic nickel-titanium preformed archwires, the clinician can often introduce larger cross-section rectangular wires in the early stages of leveling and alignment. Nickel-titanium archwires exhibit exceptional springiness, but wire bending in the classical sense (or the formability of the wire) is poor because they do not undergo plastic deformation until high forces are applied.
The initial nickel-titanium archwires (0.014 or 0.016 in) used for leveling and alignment exert light forces and are usually tied for short periods. They can be expected to have little influence on the arch form, since their forms are often temporarily distorted from tying on malaligned teeth. As the teeth align and the treatment progresses, heavier rectangular nickel-titanium or heat-activated nickel-titanium followed by stainless steel archwires are used. They have greater tensile strength and are used for longer times, resulting in more influence on the arch form.
The rectangular nickel-titanium archwires of 0.017 × 0.025 in and 0.019 × 0.025 in can permanently alter the arch form if tied for longer periods. This could be a significant factor in determining posttreatment retention and stability. The mandibular intercanine and intermolar widths are accurate indexes of the muscular balance inherent in each patient and dictate the limits of arch expansion during treatment. They are important to establish and maintain proper functional balance as an aid in treating and retaining orthodontic patients.
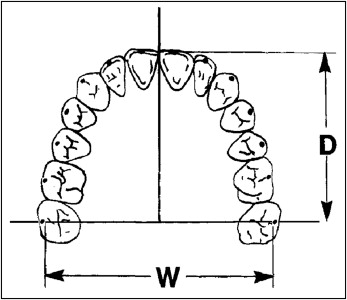
The dental arch form is initially shaped by the configuration of the supporting bone. After the eruption of teeth, the circumoral musculature and intraoral functional forces have significant influences over the arch form. The principal clinical factors that affect a patient’s arch form and dimensions are dental perimeter, cross-arch width, and arch depth ( Fig 1 ). An analytical equation of dental arch shape is necessary to describe the relationship between arch width, depth, and perimeter, which influence the arch form.
The occlusal views of dental arches in an Angle Class I occlusion have been described by the mathematical beta function with average correlation coefficients of 0.98 for the mandible and 0.97 for maxilla. The beta function is shown to be an accurate representation of planar projections of natural arch forms defined by spatial coordinates of labial bracket interfacing surfaces in maxillary and mandibular arches.
This study was undertaken to correlate the arch forms of Angle Class I normal occlusion and various archwire-bracket assemblies derived by the beta function in their form and dimension. The intercanine and intermolar widths of natural arch forms were compared with those of rectangular nickel-titanium archwire-bracket assemblies in the maxillary and mandibular arches of both sexes.
Material and methods
Orthodontic models of maxillary and mandibular arches of 20 male and 20 female subjects with normal occlusions were selected as the control groups from approximately 2500 students in Sawangi, Wardha, India. The control groups belonged to different ethnic groups of the Indian population, with various arch forms and sizes. The inclusion criteria were Angle Class I molar and canine relationships, normal overbite and overjet, and well-aligned arches with the second molars in occlusion. Models with attrition, fractured teeth, ectopically erupted teeth, deciduous teeth, and arch length deficiency greater than 3 mm were excluded. The control groups were female maxillary, female mandibular, male maxillary, and male mandibular arches.
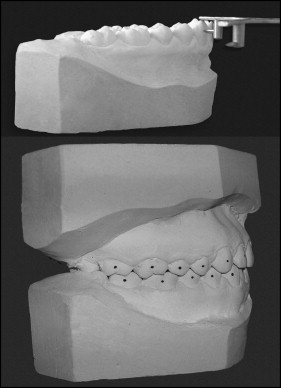
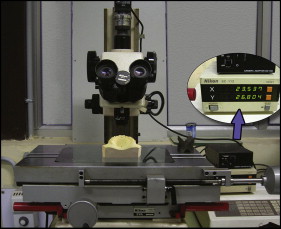
A bracket height gauge was used to mark the bracket placement points on the labial surfaces of the teeth. Points were marked at the center of the tooth incisogingivally and mesiodistally along the long axis ( Fig 2 ). Each cast was oriented in a Microval Co-ordinate Measuring Microscope (Nikon, Tokyo, Japan ) for determining the coordinates of bracket placement points ( Fig 3 ). This device is used in the machine tool industry to measure the precision of parts with an accuracy of 0.001 mm. The linear accuracy of the machine is 0.006 mm, and reproducibility is 0.004 mm.
The casts were secured to a fixed plane, and an optical beam was used to identify the 14 points. The corresponding x, y, and z coordinates were stored automatically in a computer data file. Coordinates of a point in space in 3 orthogonal axes were measured up to 1 μm. The curve fitting program (table curve 2-dimensional version 5.1; Systat Software, Chicago, Ill) was used to apply mathematical beta function (with the least squares method) to process the measured x and y coordinates. The z coordinates were reduced to zero to obtain planar projections of each point. The values were fed into the software, and the beta function was selected from the equation list for data processing and to derive uniform bilaterally symmetrical arch forms representing natural arch forms.
The average correlation coefficient between the dimensions measured on the models and the mathematical arch forms expressed by the beta function was 0.97 (SD 0.03) ( Tables I and II ). By using the average correlation coefficient as a measure of fit, the natural dental arch form is accurately represented mathematically by the beta function as also seen in previous studies. Therefore, the beta function was used to derive accurate planar projections of dental arch forms by using the coordinates of the bracket placement points. These arch forms were used for correlation with arch forms of 0.019 × 0.025-in rectangular nickel-titanium wire-bracket assemblies derived by the beta function.
| Sample | Measured values (mm) | Curve fit values (mm) | Correlation | ||||
|---|---|---|---|---|---|---|---|
| Intercanine width | Intermolar width | Depth | Intercanine width | Intermolar width | Depth | Coefficient | |
| Maxilla | |||||||
| 1 | 32.007 | 57.415 | 42.019 | 32.319 | 58.021 | 42.21 | 0.97 |
| 2 | 31.216 | 55.616 | 41.987 | 31.645 | 56.104 | 42.707 | 0.96 |
| 3 | 32.412 | 57.853 | 41.843 | 32.716 | 58.757 | 42.201 | 0.99 |
| 4 | 32.179 | 55.813 | 40.758 | 32.948 | 55.915 | 41.201 | 0.98 |
| 5 | 33.769 | 57.314 | 42.719 | 34.143 | 57.925 | 43.371 | 0.96 |
| 6 | 35.016 | 60.879 | 39.716 | 35.216 | 61.425 | 40.371 | 0.97 |
| 7 | 31.142 | 54.119 | 42.014 | 31.416 | 54.724 | 42.864 | 0.96 |
| 8 | 34.207 | 57.614 | 38.713 | 34.916 | 58.124 | 39.971 | 0.98 |
| 9 | 36.715 | 59.143 | 40.219 | 37.103 | 60.215 | 41.371 | 0.98 |
| 10 | 31.204 | 59.463 | 39.142 | 31.716 | 60.224 | 39.864 | 0.96 |
| 11 | 32.312 | 57.216 | 43.714 | 32.977 | 58.106 | 44.154 | 0.96 |
| 12 | 34.109 | 57.515 | 41.649 | 34.716 | 58.216 | 42.054 | 0.97 |
| 13 | 28.757 | 54.719 | 41.463 | 29.157 | 55.216 | 42.865 | 0.98 |
| 14 | 32.216 | 60.763 | 39.012 | 32.849 | 61.931 | 39.864 | 0.98 |
| 15 | 34.191 | 57.419 | 41.613 | 34.716 | 58.345 | 42.054 | 0.97 |
| 16 | 34.012 | 58.213 | 41.253 | 34.571 | 58.941 | 42.058 | 0.96 |
| 17 | 31.012 | 55.814 | 40.257 | 31.679 | 56.745 | 40.864 | 0.96 |
| 18 | 34.107 | 60.713 | 40.531 | 34.519 | 61.025 | 41.371 | 0.98 |
| 19 | 31.218 | 56.771 | 42.143 | 31.847 | 57.214 | 42.701 | 0.97 |
| 20 | 31.129 | 54.121 | 41.693 | 31.519 | 54.781 | 42.154 | 0.96 |
| Average | 32.65 | 57.42 | 41.12 | 33.13 | 58.10 | 41.81 | 0.97 |
| SD | 1.83 | 2.05 | 1.30 | 1.83 | 2.14 | 1.19 | 0.03 |
| SEM | 0.41 | 0.46 | 0.29 | 0.41 | 0.48 | 0.27 | 0.01 |
| Maximum | 36.71 | 60.88 | 43.71 | 37.10 | 61.93 | 44.15 | 0.99 |
| Minimum | 28.76 | 54.12 | 38.71 | 29.16 | 54.72 | 39.86 | 0.96 |
| Mandible | |||||||
| 1 | 24.213 | 51.718 | 38.027 | 24.816 | 52.241 | 38.514 | 0.98 |
| 2 | 24.131 | 51.415 | 36.857 | 24.619 | 52.247 | 37.956 | 0.98 |
| 3 | 25.017 | 55.614 | 36.219 | 25.413 | 56.104 | 36.701 | 0.96 |
| 4 | 24.867 | 51.713 | 39.016 | 25.013 | 52.147 | 39.167 | 0.96 |
| 5 | 25.105 | 54.721 | 36.845 | 25.419 | 55.021 | 37.228 | 0.97 |
| 6 | 26.213 | 58.137 | 39.147 | 26.701 | 59.051 | 39.824 | 0.98 |
| 7 | 24.315 | 51.713 | 37.916 | 24.859 | 52.051 | 38.686 | 0.97 |
| 8 | 26.191 | 54.619 | 38.153 | 26.512 | 55.051 | 38.824 | 0.96 |
| 9 | 26.314 | 54.859 | 34.819 | 26.814 | 55.284 | 35.239 | 0.97 |
| 10 | 27.131 | 55.613 | 36.913 | 27.456 | 56.121 | 37.199 | 0.95 |
| 11 | 25.814 | 51.783 | 33.857 | 26.219 | 53.184 | 34.439 | 0.96 |
| 12 | 26.138 | 54.783 | 35.716 | 26.598 | 55.284 | 36.239 | 0.96 |
| 13 | 21.949 | 51.649 | 36.413 | 22.017 | 52.213 | 37.236 | 0.97 |
| 14 | 25.513 | 57.413 | 38.71 | 26.014 | 58.741 | 39.239 | 0.97 |
| 15 | 27.716 | 54.615 | 36.014 | 28.151 | 55.787 | 37.839 | 0.97 |
| 16 | 25.312 | 53.714 | 37.914 | 25.819 | 54.159 | 38.139 | 0.98 |
| 17 | 26.413 | 54.106 | 37.013 | 26.713 | 54.253 | 37.647 | 0.98 |
| 18 | 27.013 | 56.213 | 38.814 | 27.431 | 57.105 | 38.641 | 0.97 |
| 19 | 22.813 | 53.141 | 37.615 | 22.859 | 53.841 | 38.849 | 0.98 |
| 20 | 23.817 | 50.014 | 32.143 | 24.314 | 50.147 | 33.167 | 0.98 |
| Average | 25.30 | 53.88 | 36.91 | 25.69 | 54.50 | 37.54 | 0.97 |
| SD | 1.45 | 2.19 | 1.79 | 1.52 | 2.32 | 1.70 | 0.03 |
| SEM | 0.33 | 0.49 | 0.40 | 0.34 | 0.52 | 0.38 | 0.01 |
| Maximum | 27.72 | 58.14 | 39.15 | 28.15 | 59.05 | 39.82 | 0.98 |
| Minimum | 21.95 | 50.01 | 32.14 | 22.02 | 50.15 | 33.17 | 0.95 |
| Sample | Measured values (mm) | Curve fit values (mm) | Correlation | ||||
|---|---|---|---|---|---|---|---|
| Intercanine width | Intermolar width | Depth | Intercanine width | Intermolar width | Depth | Coefficient | |
| Maxilla | |||||||
| 1 | 34.103 | 59.814 | 42.919 | 34.639 | 60.714 | 43.169 | 0.98 |
| 2 | 33.219 | 57.396 | 42.349 | 33.714 | 58.153 | 43.614 | 0.98 |
| 3 | 32.413 | 56.514 | 43.215 | 32.749 | 57.214 | 44.674 | 0.98 |
| 4 | 36.747 | 60.819 | 42.267 | 37.143 | 61.216 | 43.674 | 0.98 |
| 5 | 34.103 | 61.413 | 45.213 | 34.913 | 61.874 | 46.716 | 0.98 |
| 6 | 32.219 | 58.014 | 41.945 | 32.839 | 58.241 | 43.064 | 0.98 |
| 7 | 32.314 | 57.894 | 44.394 | 32.914 | 58.357 | 45.641 | 0.98 |
| 8 | 32.105 | 58.716 | 45.218 | 32.216 | 59.315 | 46.314 | 0.99 |
| 9 | 31.716 | 58.013 | 43.129 | 32.082 | 58.837 | 44.214 | 0.98 |
| 10 | 34.716 | 58.127 | 39.142 | 35.216 | 59.537 | 40.674 | 0.97 |
| 11 | 36.107 | 59.418 | 46.746 | 36.419 | 60.061 | 46.917 | 0.99 |
| 12 | 34.213 | 58.231 | 43.149 | 34.713 | 58.968 | 44.215 | 0.97 |
| 13 | 35.357 | 59.213 | 44.314 | 35.813 | 60.219 | 45.016 | 0.96 |
| 14 | 32.814 | 58.761 | 42.371 | 33.256 | 59.662 | 42.914 | 0.97 |
| 15 | 32.747 | 56.649 | 42.764 | 33.143 | 57.214 | 43.641 | 0.98 |
| 16 | 33.216 | 55.213 | 43.214 | 33.813 | 56.153 | 44.215 | 0.98 |
| 17 | 35.014 | 59.613 | 43.974 | 35.649 | 60.153 | 44.687 | 0.99 |
| 18 | 32.987 | 58.713 | 46.461 | 33.413 | 59.147 | 47.214 | 0.97 |
| 19 | 32.659 | 57.216 | 46.741 | 33.143 | 58.143 | 46.971 | 0.97 |
| 20 | 31.807 | 57.103 | 42.641 | 32.219 | 57.419 | 42.914 | 0.98 |
| Average | 33.53 | 58.34 | 43.61 | 34.00 | 59.03 | 44.52 | 0.97 |
| SD | 1.45 | 1.48 | 1.85 | 1.48 | 1.46 | 1.70 | 0.03 |
| SEM | 0.33 | 0.33 | 0.41 | 0.33 | 0.33 | 0.38 | 0.01 |
| Maximum | 36.75 | 61.41 | 46.75 | 37.14 | 61.87 | 47.21 | 0.99 |
| Minimum | 31.72 | 55.21 | 39.14 | 32.08 | 56.15 | 40.67 | 0.96 |
| Mandible | |||||||
| 1 | 27.945 | 56.719 | 38.103 | 28.143 | 57.413 | 38.413 | 0.97 |
| 2 | 25.341 | 55.614 | 35.917 | 25.817 | 56.419 | 36.416 | 0.98 |
| 3 | 28.164 | 57.107 | 36.914 | 28.716 | 57.654 | 37.814 | 0.98 |
| 4 | 27.264 | 54.715 | 37.213 | 27.614 | 55.025 | 37.819 | 0.96 |
| 5 | 27.647 | 55.915 | 39.214 | 28.103 | 56.314 | 40.215 | 0.96 |
| 6 | 26.814 | 53.613 | 37.814 | 27.417 | 53.707 | 38.814 | 0.96 |
| 7 | 27.914 | 53.719 | 37.614 | 28.513 | 54.959 | 38.271 | 0.97 |
| 8 | 27.641 | 53.615 | 33.716 | 28.115 | 54.819 | 34.291 | 0.97 |
| 9 | 28.146 | 57.412 | 38.416 | 28.716 | 58.012 | 39.145 | 0.95 |
| 10 | 27.846 | 57.615 | 40.215 | 28.315 | 58.214 | 40.697 | 0.97 |
| 11 | 27.761 | 54.197 | 39.614 | 28.149 | 54.942 | 40.215 | 0.96 |
| 12 | 27.209 | 55.012 | 40.716 | 27.769 | 55.553 | 41.678 | 0.95 |
| 13 | 27.461 | 53.007 | 38.214 | 28.144 | 53.009 | 39.845 | 0.98 |
| 14 | 23.016 | 55.127 | 40.159 | 23.412 | 55.713 | 41.023 | 0.98 |
| 15 | 25.541 | 57.614 | 37.2154 | 26.017 | 58.149 | 37.841 | 0.98 |
| 16 | 22.914 | 57.293 | 34.974 | 23.213 | 57.913 | 35.417 | 0.97 |
| 17 | 24.612 | 57.614 | 41.697 | 25.597 | 58.916 | 42.614 | 0.97 |
| 18 | 27.106 | 59.615 | 39.146 | 27.763 | 60.521 | 39.941 | 0.98 |
| 19 | 25.314 | 56.549 | 38.645 | 25.897 | 57.743 | 39.745 | 0.98 |
| 20 | 24.136 | 58.715 | 37.415 | 24.913 | 58.917 | 38.413 | 0.98 |
| Average | 26.54 | 56.04 | 38.15 | 27.02 | 56.70 | 38.93 | 0.97 |
| SD | 1.75 | 1.87 | 1.93 | 1.70 | 1.95 | 2.04 | 0.03 |
| SEM | 0.39 | 0.42 | 0.43 | 0.38 | 0.44 | 0.46 | 0.01 |
| Maximum | 28.16 | 59.62 | 41.70 | 28.72 | 60.52 | 42.61 | 0.98 |
| Minimum | 22.91 | 53.01 | 33.72 | 23.21 | 53.01 | 34.29 | 0.94 |
Stay updated, free dental videos. Join our Telegram channel
VIDEdental - Online dental courses


