Introduction
The application of cone-beam computed tomography (CBCT) in orthodontics ushered in a new era in 3-dimensional analysis that promises to provide more comprehensive understanding of craniofacial skeletal anatomy. That promise is now being realized in multiple studies. The purposes of this study were to investigate a portion of transverse dimension relationships by using CBCT and to propose a transverse analysis to assist practitioners with treatment decisions.
Methods
The CBCT scans of 241 patients with and without crossbite were analyzed to assess the width of the jaws and the inclination of the first molars. The dental and skeletal measurements were compared between the noncrossbite and the crossbite groups.
Results
The noncrossbite group included patients who had apparently normal transverse relationships, but also a surprising number of patients with an obvious skeletal transverse discrepancy masked by dental compensation. The noncrossbite patients with molar inclinations within 1 SD of the mean were defined as the control group, and those with dental compensations were identified as either superior convergent or inferior convergent. The obvious unilateral crossbite patients demonstrated dental compensation in the maxillary first molar on the noncrossbite side, whereas the obvious bilateral crossbite patients had normal dental inclinations.
Conclusions
Skeletally, both the bilateral and unilateral crossbite groups had narrower maxillary widths than did the controls, but also wider mandibles, with more severe bilateral crossbites. Dentally, the unilateral crossbite group had more upright teeth on the noncrossbite side. In the noncrossbite groups with dental compensations, the superior convergent and inferior convergent differences in both dental and skeletal characteristics were marked. Patients without crossbites can have significant discrepancies that might warrant treatment.
Athough many analyses of the lateral cephalometric headfilm have been developed for use in orthodontic and orthognathic treatment planning, the posteroanterior cephalogram has been largely ignored. Several factors make posteroanterior analysis challenging. First, the superimposition of many structures on the posteroanterior view reduces the clarity of the landmarks and increases identification errors. Second, any rotation or tipping of the head when taking the posteroanterior cephalogram affects the horizontal relationships of the landmarks, making it hard to assess symmetry and measure horizontal distances. Finally, landmarks located farther from the posteroanterior porionic axis have greater variations and are less reliable in evaluating the transverse dimension than closer landmarks.
Despite these problems, a number of posteroanterior cephalometric analyses have emerged to evaluate the breadth, symmetry, morphology, shape, and size of the craniofacial skeleton in the coronal plane. The most common assessment of skeletal transverse discrepancy compares the widths between the right and left jugale points and between the right and left antegonial points. However, the correlation between these points accounts for only 50% of the variance of the outcome. Consequently, the jugale point to the antegonial point ratio might not be as reliable an indicator of transverse relationships as is commonly believed. With these limitations, the practitioner is often challenged to make the proper diagnosis when using the posteroanterior cephalogram.
Cone beam computed tomography (CBCT) scans reduce the sources of error that orthodontists observe with 2-dimensional cephalometry. From CBCT images, asymmetry, condylar pathology, airway patency, and skeletal discrepancies can be accurately analyzed by methods unavailable for standard 2-dimensional radiographs. Recent studies have shown that 3-dimensional measurements from CBCT scans are closer to anatomic measurements than are traditional 2-dimensional measurements. Routine orthodontic treatment can be enhanced by the ability to diagnose and plan treatment in 3 dimensions of space. However, comprehensive orthodontic treatment planning has not been possible because of the lack of craniofacial normative values.
The aim of this study was to develop a transverse analysis based on CBCT and valid skeletal and dental landmarks. We sought to determine the range of normal positions and relationships between the maxillary and mandibular molars and the related skeleton.
Material and methods
The CBCT scans of 2279 patients from 2 private orthodontic offices were examined. All scans were reviewed retrospectively. The Institutional review board of Harvard University reviewed and approved the consent forms, study protocols, and affiliation agreements with the practices before data collection. Each patient had a 20-second CBCT scan performed on an i-CAT scanner (Imaging Sciences International, Hatfield, Pa) (0.4-mm voxel size). The included patients were those with mixed or permanent dentition and erupted maxillary and mandibular first permanent molars in bilateral Angle Class I relationships. Class I intercuspation of the posterior occlusion and Class I canines were required to be included in the study. Because of some rotations and crossbites, not all first molars were in Angle Class I relationships. Exclusion criteria were missing teeth (other than the third molars), crowding of more than 4 mm, overbite or overjet of more than 4 mm, crowns or cuspal restorations, previous orthodontic treatment, craniofacial trauma or surgery, or temporomandibular joint pain. Crowding and overjet were limited to increase the likelihood that the skeletal transverse relationship was not skewed by sagittal skeletal discrepancies.
Our sample included 241 patients; 54 patients were in posterior lingual crossbite of the maxillary and mandibular first permanent molars on at least 1 side (28 boys, 26 girls) in centric relation, and 187 patients were not in crossbite (77 boys, 110 girls). Thirty-three of the 54 posterior crossbite patients had bilateral crossbite in centric relation, and 21 had unilateral crossbite with no shift. The mean age of our sample was 13 years. Table I reports the sex and age distribution in the sample.
| Group | n | Mean age (y) | SD | Girls | Boys |
|---|---|---|---|---|---|
| Unilateral crossbite | 21 | 12.68 | 8.70 | 10 | 11 |
| Bilateral crossbite | 33 | 12.20 | 4.70 | 16 | 17 |
| Control | 79 | 13.12 | 1.68 | 45 | 34 |
| Superior convergent | 61 | 12.41 | 2.30 | 38 | 23 |
| Inferior convergent | 47 | 14.33 | 3.57 | 27 | 20 |
Dental landmarks were used to examine the maxillary and mandibular permanent first molar angulations in the noncrossbite group. The skeletal landmarks were examined to determine which skeletal measurements would represent the transverse width relationship between the maxilla and the mandible in the noncrossbite group. Mean values were then derived for the dental and skeletal measurements from both the unilateral and bilateral crossbite groups. Finally, we compared the dental and skeletal measurements between the crossbite and noncrossbite groups.
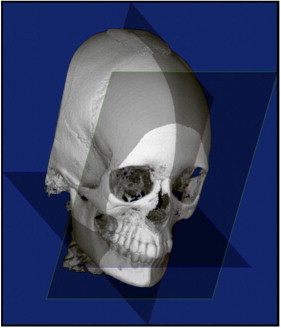
The following reference planes were used to ensure that the 2-dimensional coronal slices were consistently oriented ( Fig 1 ): (1) the axial plane was defined as the functional occlusal plane ; (2) the coronal plane was perpendicular to the axial plane, passing through the buccal groove of the maxillary right first molar; and (3) the sagittal plane was perpendicular to both the axial and coronal planes, passing through the midpoint between the medial rims of the orbits.
Fourteen skeletal and dental landmarks were located bilaterally on the CBCT coronal cross-sections (5-mm thickness) through the middle of the maxillary and mandibular first molar crowns on separate slices. Although the patients all had Class I relationships, it was often necessary to evaluate neighboring slices around the first molars to visualize the long axis of the mesial root of the mandibular first molar and the mesiobuccal root of the maxillary first molar. Five-millimeter slices were used to visualize both the mesiobuccal and palatal roots of the maxillary molar on the same section, since these 2 structures are separated in the sagittal plane. We thought that this would minimize error, since, with a thinner section, a portion of the root might appear and mislead the investigator as to the location of the furcation.
Twenty-six measurements were made by using a custom analysis software program (Dolphin Imaging Sciences, Chatsworth, Calif). After we evaluated all measurements on a pilot sample, we chose 2 linear measurements and 4 angular measurements for significance ( Table II ). The resulting CBCT transverse analysis was developed.
| Landmark or parameter | Definition |
|---|---|
| Long axis, maxillary molar | The line drawn between the deepest concavity between the buccal and palatal cusps and the furcation of the roots |
| Long axis, mandibular molar | The line drawn between the deepest concavity between the buccal and lingual cusps and the root apex |
| Functional occlusal plane | The line drawn between the points of contact between the maxillary and mandibular molars |
| Palatal S′ point | The point on the palatal cortex of the maxilla at a vertical level halfway between the buccal alveolar crest and the buccal root apex of the maxillary first molar |
| Lingual S′ point | The point on the lingual cortex of the mandible at a vertical level halfway between the buccal alveolar crest and the apex of the mandibular first molar |
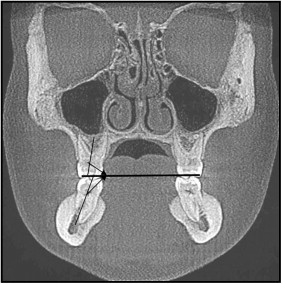
Molar axial angle refers to the angle between the long axis of the first molar and the axial plane ( Fig 2 ) in the coronal plane. This measurement was made for each first permanent molar, for a total of 4 measurements.
Maxillary width at the palatal midalveolar level was measured from the right and left S′ points on the alveolar bone ( Fig 3 ). S′ point was defined as the alveolar point on the palatal surface opposite the midpoint of the maxillary first molar root.
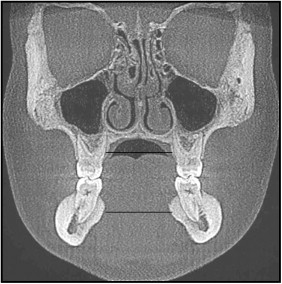
Mandibular arch width at the lingual midalveolar level was the width of the mandible measured from the right and left S′ points on the alveolar bone ( Fig 3 ). S′ point is on the lingual alveolar bone at the same level as S point.
The difference between the maxillary and mandibular palatal and lingual midalveolar widths was calculated.
Statistical analysis
Twenty scans were randomly selected for remeasurement. Intrarater reliability was determined by performing the CBCT transverse analysis for each scan on 2 separate occasions by 1 examiner (S.A.) at least 1 week apart. A second examiner made the same measurements on the same scans once. Interrater reliability was determined as a measure of agreement between the 2 examiners. The Cronbach alpha test was used to assess the interexaminer and intraexaminer reliabilities of the measurements.
Standard descriptive statistics, including means and standard deviations, were calculated for each measurement. The normality of the outcome data was examined by the Kolmogorov-Smirnov test. Independent sample t test, Mann-Whitney U-test (where appropriate, when the data were nonparametric), and multi-variable linear regression analysis with the ordinary least squares approach were used to examine the associations between the measurements (linear and angular) and the groups (crossbite vs noncrossbite).
All statistical tests were 2-sided, and a P value less than 0.05 was deemed to be statistically significant. All analyses where performed with software (version 8; StataCorp, College Station, Tex; version 15; SPSS, Chicago, Ill).
Results
The Cronbach alpha test showed that intraexaminer and interexaminer agreement was reliable (α >0.9; mean, .95; range, .92-.98) for the 6 angular and linear measurements chosen. The error thus measured included the errors in orientation as well as in landmark location.
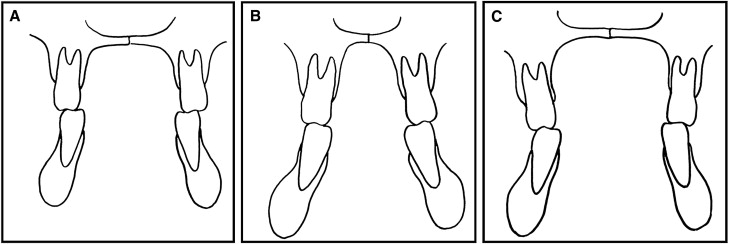
Preliminary analysis of the original noncrossbite group showed high variability in all linear and angular measurements. After we reviewed the distribution and standard deviations of the measurements, the noncrossbite group included patients who had apparently normal skeletal and dental transverse relationships ( Fig 4 , A ), but also patients with an obvious skeletal transverse discrepancy between the maxilla and the mandible that had been masked by dental tipping either buccally or lingually (dental compensation) ( Fig 4 , B and C ). To further understand this variability, the number of noncrossbite patients was increased to 187. Because of this high variability in the noncrossbite group, we divided the noncrossbite group into 3 groups ( Table III ).
- 1.
Control group. Inclusion in this group was defined by molar inclinations of all permanent first molars within 1 SD above or below the mean of the noncrossbite group. This group had normal transverse molar relationships.
- 2.
Superior convergent group. In this group, at least 1 permanent first molar inclination was at least 1 SD above the mean of the noncrossbite group, so that the long axes converged superiorly. This means that the superior convergent group had maxillary molars that were tipped more buccally or mandibular molars that were tipped more lingually than those in the control group.
- 3.
Inferior convergent group. In this group, the inclination of at least 1 permanent first molar was at least 1 SD below the mean of the noncrossbite group and therefore converged inferiorly. This means that the inferior convergent group had maxillary molars that were tipped more lingually and mandibular molars that were tipped more buccally than those in the control group.
| Measurement | Control | Unilateral crossbite | Bilateral crossbite | Superior convergent | Inferior convergent |
|---|---|---|---|---|---|
| Maxillary right molar axial angle | 97.77 ± 2.7 | 96.98 ± 6.02 | 96.33 ± 5.22 | 93.18 ± 3.67 ∗,†,‡,§ | 102.29 ± 4.29 ∗,†,‡ |
| Maxillary left molar axial angle | 98.29 ± 2.56 | 101.51 ± 4.24 ∗ | 98.2 ± 5.52 † | 94.97 ± 3.33 ∗,†,‡,§ | 102.98 ± 3.83 ∗,‡ |
| Mandibular right molar axial angle | 104.22 ± 2.67 | 99.81 ± 6.29 ∗ | 103.59 ± 6.29 | 101.66 ± 3.84 § | 107.57 ± 4.81 ∗,†,‡ |
| Mandibular left molar axial angle | 103.85 ± 2.47 | 105.93 ± 5.74 | 103.11 ± 6.75 | 101.94 ± 4.31 § | 107.41 ± 4.85 ∗,‡ |
| Palatal S′ width | 27.73 ± 2.08 | 26.43 ± 2.12 | 25.55 ± 2.77 ∗ | 26.16 ± 3.00 ∗ | 29.21 ± 2.41 ∗,†,‡,§ |
| Lingual S′ width | 28.95 ± 2.79 | 32.35 ± 2.75 | 32.14 ± 4.18 ∗ | 31.04 ± 2.66 ∗ | 28.53 ± 2.6 †,‡,§ |
| Maxillomandibular width difference | −1.22 ± 2.91 | −4.38 ± 7.06 ∗ | −6.6 ± 5.32 ∗ | −4.88 ± 3.08 ∗ | 0.69 ± 2.82 ∗,†,‡,§ |
Stay updated, free dental videos. Join our Telegram channel
VIDEdental - Online dental courses


