Introduction
Our objective was to compare the craniofacial hard and soft tissue characteristics between children with operated unilateral cleft lip and palate (UCLP) and children with noncleft lip and palate (non-CLP) with a Class III skeletal relationship.
Methods
The study sample consisted of 30 subjects (18 boys, 12 girls; mean age, 10.21 years) affected by UCLP and 30 non-CLP subjects (17 boys, 13 girls; mean age, 10.19 years) as the control group. All subjects were in the mixed dentition with a Class III skeletal relationship. Cone-beam computed tomography–synthesized cephalograms were traced and evaluated, and craniofacial hard and soft tissue morphologies were compared between the UCLP and non-CLP groups.
Results
Maxillary length and gonial angle were 2.66 mm shorter and 3.67° greater, respectively, in the UCLP group than those in the non-CLP group. The SNA and SNB angles describing the sagittal positions of the maxilla and mandible, respectively, relative to the cranial base were significantly smaller in the UCLP group ( P <0.001 and P = 0.003, respectively). However, the 2 groups had similar sagittal intermaxillary relationships with similar ANB angles ( P = 0.669). In the vertical dimension, the mandibular plane angle and the growth direction vector were significantly greater in the UCLP group ( P = 0.007 and P <0.001, respectively). Lastly, the UCLP group had a more concave soft tissue profile, manifested by a reduced facial convexity angle, as well as an acute nasolabial angle and a more protruded lower lip.
Conclusions
Although the 2 groups had similar sagittal intermaxillary relationships, patients in the UCLP group had more retrusive maxillary and mandibular positions relative to the cranial base and more severe vertical discrepancies. Additionally, the soft tissue profiles of patients affected by UCLP were more concave, and the compensatory adaptation was less satisfactory.
Highlights
- •
Craniofacial morphology was compared in UCLP and non-CLP subjects.
- •
The maxilla and mandible were more retrusive relative to cranial base in UCLP subjects.
- •
UCLP subjects had more severe vertical discrepancies and hyperdivergent growth patterns.
- •
Soft tissue profiles were more concave in the UCLP subjects.
Cleft lip and palate (CLP) is a congenital facial anomaly characterized by underdevelopment of maxillary growth, caused by surgical repair, palatal muscle strain, scar contracture, or congenital development deficiency. Patients affected by CLP often have abnormal lip morphology and increased muscle tension that might exert negative effects on growth and the function of craniofacial structures. According to Shetye and Evans, patients affected by CLP generally have an anterior crossbite and a tendency toward Class III malocclusion. Williams et al reported that among 12-year-old patients affected by CLP, approximately 70% have a of Class III skeletal deformity.
To identify the craniofacial characteristics of patients with CLP, previous studies investigated the differences in hard and soft tissue morphologies between CLP and non-CLP subjects. However, although many patients affected by CLP tend to have a Class III skeletal relationship, few studies have compared the craniofacial morphologies of CLP and non-CLP subjects with a Class III skeletal deformity.
The leading cause of Class III malocclusion in non-CLP subjects is heredity, and skeletal discrepancies are mainly in the sagittal dimension; however, multiple factors contribute to the development of Class III malocclusion in CLP subjects, including heredity, local cleft defect, surgical disturbance, and abnormal lip tension.
Because of the inherent compensation of the craniofacial structures, growth and development in 3 dimensions would allow interactions across all dimensions, so that transverse asymmetry caused by a cleft defect would also affect the morphology in the sagittal and vertical dimensions. Therefore, it is reasonable to assert that considerable differences exist in both hard and soft tissues between CLP and non-CLP Class III subjects. Notably, the locations of the differences in craniofacial morphology and their impact on the diagnosis and treatment of CLP patients has not yet been studied.
The purpose of this study was to evaluate and compare craniofacial hard and soft tissue morphologies of operated UCLP and non-CLP patients with a Class III skeletal deformity. All patients were in the mixed dentition with a Class III skeletal relationship and an anterior crossbite.
Material and methods
This retrospective study was approved by the ethics committee of the Peking University School of Stomatology, Beijing, China. All participants and their parents provided written informed consent, and all clinical investigations were conducted according to the principles of the Declaration of Helsinki.
All patients were Chinese residents of Northern Chinese origin. They were selected according to the following criteria. Inclusion criteria for the UCLP group were (1) operated nonsyndromic UCLP, (2) Class III skeletal relationship with an ANB angle less than 1° and an anterior crossbite, (3) mixed dentition and cervical vertebral maturation stage between 1 and 3, and (4) no previous orthodontic treatment.
Included in the UCLP group were 30 children (18 boys, 12 girls) between the ages of 8.3 and 11.9 years (mean, 10.21 years; SD, 1.01 years). Of the UCLP patients, 23 (76.67%) had a cleft on the left side, and 7 (23.33%) had a cleft on the right side. All UCLP subjects underwent cheiloplasty before they were 1 year old, palatoplasty before 3 years old, and alveolar bone grafting surgery at least 3 months before starting this study. All surgeries were performed at the Cleft Lip and Palate Treatment Center, Peking University School of Stomatology, Beijing, China.
The non-CLP subjects had similar inclusion criteria to the UCLP group. They were selected from the Department of Orthodontics, Peking University School and Hospital of Stomatology. Included in the non-CLP group were 30 children (17 boys, 13 girls) between the ages of 8.8 and 11.9 years (mean, 10.19 years; SD, 0.91 years) ( Table I ).
| UCLP group (n = 30) | Non-CLP group (n = 30) | P value | |
|---|---|---|---|
| Boys/girls (n) | 18/12 | 17/13 | 0.793 ∗ |
| Mean age (y) | 10.21 ± 1.01 | 10.19 ± 0.91 | 0.950 † |
In assessing the sample size, we used the results from 2 previous studies to calculate the scientifically appropriate number of subjects. A 2-sample t test power analysis of 3 representative measurements—ANB angle, maxillary length, and mandibular plane angle—was conducted using PASS software (version 11; NCSS, Kaysville, Utah) with alpha, beta, and power values set at 0.05, 0.10, and 0.90, respectively. Results of this analysis confirmed that sample sizes of 30 for the UCLP group and 30 for the non-CLP group were sufficient to achieve 90% power in detecting differences between the groups.
The cone-beam computed tomography (CBCT) images were obtained using the same device (DCT Pro; VATECH-EWOO Group, Seoul, South Korea) before any orthodontic treatment. Each patient was seated in a chair with natural head position oriented by experienced clinicians, in centric occlusion, and with a relaxed tongue and passive lips. All scans were completed using the following protocol: field of view, 200 × 190 mm 2 ; 90 kV(p); 144 mA; scan time, 24 seconds; and voxel size, 0.4 mm 3 .
Cephalograms were built from CBCT images using Dolphin Imaging Software (version 11.7; Dolphin Imaging and Management Solutions, Chatsworth, Calif) in orthogonal projection by parallel rays that allowed no magnification.
Before the cephalograms were generated, the image data were carefully oriented in 3 dimensions using the following protocol: (1) the Frankfort horizontal (FH) plane passed through the bilateral porion and orbitale on the unaffected side of the UCLP patients (for non-CLP subjects, the right side was used) and was parallel to the ground; (2) the sagittal plane passed through sella and nasion and was perpendicular to the FH plane; and (3) the coronal plane passed through basion and was perpendicular to the sagittal and the FH planes.
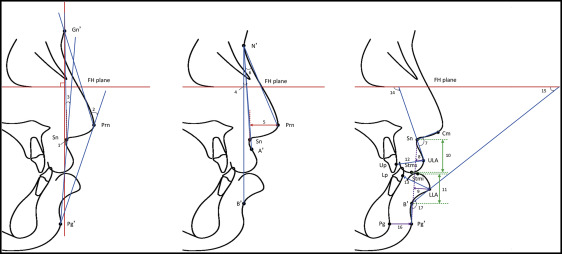
Cephalometric assessment was performed using the Dolphin Imaging software. Cephalometric landmarks and measurements of hard tissues are shown in Figure 1 , and soft tissue landmarks and measurements are shown in Figure 2 . Descriptions of measurements are presented in Table II (hard tissues) and Table III (soft tissues).
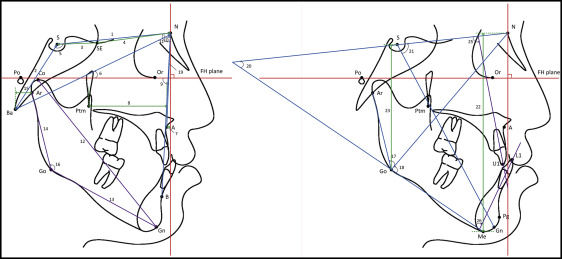
| Hard tissue measurement | Definition |
|---|---|
| 1. S-N (mm) | Anterior cranial base length |
| 2. S-Ba (mm) | Posterior cranial base length |
| 3. S-SE (mm) | Distance between sella and sphenoidale |
| 4. SE-N (mm) | Distance between sphenoidale and nasion |
| 5. N-S-Ba (°) | Cranial base angle |
| 6. N-Ba/FH (°) | Cranial base flexion |
| 7. N-A (// FH) (mm) | Anterior position of maxilla |
| 8. A-Ptm (// FH) (mm) | Effective depth of maxilla |
| 9. Lande’s angle (°) (FH/N-A) | Anteroposterior position of maxilla relative to the forehead |
| 10. SNA (°) | Anteroposterior position of the maxilla relative to the cranial base |
| 11. SNB (°) | Anteroposterior position of the mandible relative to the cranial base |
| 12. Co-Gn (mm) | Total mandibular length |
| 13. Go-Gn (mm) | Mandibular body length |
| 14. Ar-Go (mm) | Ramus height |
| 15. Ar-Ba (// FH) (mm) | Anteroposterior position of mandible relative to basion |
| 16. Ar-Go-Me (°) | Gonial angle |
| 17. Ar-Go-N (°) | Upper gonial angle |
| 18. N-Go-Me (°) | Lower gonial angle |
| 19. ANB (°) | Sagittal intermaxillary relationship |
| 20. MP/SN (°) | Mandibular plane angle |
| 21. SN/S-Gn (°) | y-axis angle |
| 22. N-Me (⊥FH) (mm) | Total anterior face height |
| 23. S-Go (⊥FH) (mm) | Total posterior face height |
| 24. S-Go/N-Me (%) | Posterior face height/anterior face height |
| 25. U1/SN (°) | Maxillary incisor angle |
| 26. L1/MP (°) | Mandibular incisor angle |
| Soft tissue measurement | Definition |
|---|---|
| 1. G′-Sn (// FH) | Prominence of subnasale |
| 2. G′-Prn-Pg′ (°) | Angle of total facial convexity |
| 3. G′-Sn-Pg′ (°) | Angle of facial convexity |
| 4. A′-N′-B′(°) | Soft tissue A′-N′-B′ angle |
| 5. Prn-Sn (// FH) (mm) | Prominence of the nasal tip, on the FH plane |
| 6. Prn-N′-Sn (°) | Nasal angle |
| 7. Cm-Sn-UL (°) | Nasolabial angle |
| 8. ULA-SnPg′ (mm) | Protrusion of the upper lip |
| 9. LLA-SnPg′ (mm) | Protrusion of the lower lip |
| 10. Sn-Stms (⊥FH) (mm) | Upper lip length |
| 11. Stmi-B′ (⊥FH) (mm) | Lower lip length |
| 12. Up-ULA (mm) | Upper lip thickness |
| 13. Lp-LLA (mm) | Lower lip thickness |
| 14. ULA-Sn/FH (°) | Upper lip inclination |
| 15. LLA-B′/FH (°) | Lower lip inclination |
| 16. Pg-Pg′ (mm) | Thickness of the soft tissue chin |
| 17. LLA-B′-Pg′ (°) | Mentolabial angle |
Statistical analysis
To evaluate intraobserver reliability, 10 cephalograms were randomly selected from the groups to be redigitized and remeasured 2 weeks later by the same investigator (Y.L.). Random errors were calculated by Dahlberg’s formula, d=√∑d22n
d = ∑ d 2 2 n
, where d is the difference between the first and second measurements, and n is the sample size that was remeasured. The errors for the linear and angular measurements were within 0.9 mm and 0.9°, respectively.
To evaluate interobserver reliability, 10 randomly chosen cephalograms were measured by another investigator (Z.F.). The intraclass correlation coefficients ranged from 0.85 to 0.99, indicating a high level of reliability.
Independent t tests were performed to compare the cephalometric data between the UCLP and non-CLP patients. A level of P <0.05 was considered statistically significant. All statistical analyses were performed using the SPSS statistical software package, (version 13.0; SPSS, Chicago, Ill).
Results
There were no significant differences between the UCLP and the non-CLP groups with regard to mean age and sex distribution ( Table I ). The results (mean values, standard deviations, P values, and 95% confidence intervals [95% CI]) of the variables are presented in Tables IV and V . CBCT synthesized cephalograms of the 2 groups and the superimposition of the mean cephalometric tracings on the anterior cranial base are shown in Figure 3 .
| Variable | UCLP (n = 30) | Non-CLP (n = 30) | P value | 95% CI (lower, upper) | ||
|---|---|---|---|---|---|---|
| Mean | SD | Mean | SD | |||
| Cranial base | ||||||
| S-N (mm) | 58.87 | 3.36 | 58.12 | 2.48 | 0.330 | (−0.78, 2.28) |
| S-Ba (mm) | 39.89 | 2.04 | 39.55 | 2.48 | 0.561 | (−0.83, 1.52) |
| S-SE (mm) | 25.07 | 1.82 | 24.80 | 1.51 | 0.536 | (−0.60, 1.13) |
| SE-N (mm) | 35.04 | 2.14 | 34.33 | 2.02 | 0.193 | (−0.37, 1.78) |
| N-S-Ba (°) | 131.93 | 4.71 | 130.62 | 4.12 | 0.255 | (−0.97, 3.60) |
| N-Ba/FH (°) | 27.59 | 2.22 | 27.30 | 1.77 | 0.580 | (−0.75, 1.33) |
| Nasomaxillary complex | ||||||
| N-A (// FH) (mm) | −4.95 | 3.18 | −2.38 | 2.59 | 0.001 ∗ | (−4.07, −1.07) |
| A-Ptm (// FH) (mm) | 36.47 | 2.13 | 39.13 | 1.78 | <0.001 ∗ | (−3.68, −1.65) |
| Lande’s angle (FH/N-A) | 83.93 | 2.46 | 87.00 | 2.38 | <0.001 ∗ | (−4.32, −1.82) |
| SNA (°) | 75.85 | 3.38 | 78.76 | 2.54 | <0.001 ∗ | (−4.46, −1.37) |
| Mandibular morphology and position | ||||||
| Co-Gn (mm) | 97.10 | 3.63 | 98.03 | 4.39 | 0.375 | (−3.01, 1.15) |
| Go-Gn (mm) | 68.53 | 3.70 | 69.47 | 3.67 | 0.326 | (−2.85, 0.96) |
| Ar-Go (mm) | 39.63 | 2.68 | 40.39 | 2.72 | 0.282 | (−2.15, 0.64) |
| Ar-Ba (// FH) (mm) | 7.73 | 1.60 | 8.50 | 1.70 | 0.077 | (−1.62, 0.09) |
| Ar-Go-Me (°) | 128.74 | 4.58 | 125.07 | 5.49 | 0.007 ∗ | (1.05, 6.28) |
| Ar-Go-N (°) | 50.12 | 3.00 | 49.07 | 3.52 | 0.217 | (−0.64, 2.75) |
| N-Go-Me (°) | 78.61 | 4.28 | 76.00 | 4.50 | 0.025 ∗ | (0.35, 4.88) |
| SNB (°) | 77.71 | 4.00 | 80.48 | 2.76 | 0.003 ∗ | (−4.55, −0.99) |
| Intermaxillary relationship | ||||||
| ANB (°) | −1.86 | 1.22 | −1.72 | 1.41 | 0.669 | (−0.83, 0.54) |
| Vertical dimension | ||||||
| MP/SN (°) | 38.60 | 4.58 | 35.36 | 4.36 | 0.007 ∗ | (0.93, 5.55) |
| SN/S-Gn (°) | 71.82 | 3.54 | 68.46 | 3.21 | <0.001 ∗ | (1.61, 5.10) |
| N-Me (⊥FH) (mm) | 103.87 | 3.39 | 102.41 | 3.88 | 0.125 | (−0.42, 3.35) |
| S-Go (⊥FH) (mm) | 80.24 | 3.66 | 81.97 | 3.58 | 0.068 | (−3.61, 0.14) |
| S-Go/N-Me (⊥FH) (%) | 77.30 | 3.84 | 80.09 | 3.31 | 0.004 ∗ | (−4.65, −0.94) |
| Dental relationship | ||||||
| Overjet (mm) | −3.36 | 0.81 | −2.72 | 0.91 | 0.006 ∗ | (−1.08, −0.19) |
| Overbite (mm) | 2.20 | 0.89 | 2.09 | 0.87 | 0.629 | (−0.34, 0.56) |
| U1/SN (°) | 94.23 | 5.44 | 103.82 | 5.35 | <0.001 ∗ | (−12.37, −6.80) |
| L1/MP (°) | 83.31 | 5.96 | 85.92 | 5.41 | 0.081 | (−5.55, 0.34) |
Stay updated, free dental videos. Join our Telegram channel
VIDEdental - Online dental courses


