Introduction
In this study, we aimed to verify, via computed volumetric tomography, a correlation between the morphology of the mandibular symphysis and the various facial types.
Methods
From a sample of 148 digital volumetric tomographs, the subjects were classified as either short face (25 subjects), normal face (27 subjects), or long face (28 subjects) according to the average values of their Frankfort-mandibular plane angle. The 80 healthy subjects were between 12 and 40 years of age. Tomography was carried out using NewTom 3G volume scanner (QRsr1, Verona, Italy). The following parameters were measured on the sections corresponding to the 4 mandibular incisors: height, thickness, and area of the entire symphysis; height, thickness, and area of the cancellous bone of the symphysis; distance of the vestibular and lingual cortices from the apices of the 4 incisors; and possible inclination of each mandibular incisor, expressed in degrees. The F test or analysis of variance (ANOVA) and the Tukey HSD Test were subsequently used.
Results
The total thickness of the symphysis was greater in the short-face subjects than in the long-face subjects. No statistically significant differences in the total and cancellous areas of the symphysis were found between the 3 facial types. In all 3 groups, the total and cancellous heights and areas were greater at the central incisors than at the lateral incisors.
Conclusions
There is a statistically significant relationship between facial type and the total thickness of the mandibular symphysis.
The attempt to identify an orthodontically ideal, long-lasting, and equilibrated position of the incisors that will not cause periodontal problems, future articular pathologies, or crowding relapse, and will be esthetically pleasing, has included the possible determination of the anterior-most limit of the teeth. The mandibular symphysis is the anatomic factor that limits the movement of those incisors, so awareness of this structure lowers the risk of potential damage to tooth roots and alveolar bone when moving teeth orthodontically.
Thus, the choice of treatment plan should be greatly influenced by the morphology of the symphysis and the position of the mandibular incisors.
Several studies have demonstrated a correlation between facial type and the alveolar bone morphology of the mandible. In 1991, Siciliani et al, while conducting a teleradiographic study of the correlation between facial biotypes and the morphology of the mandibular symphysis in 150 orthodontically untreated patients, found that the symphysis is thin and elongated in patients with long faces, whereas it is thicker in those with short faces.
In 1998, Tsunori et al, using computed tomography (CT), found a correlation between facial type, mandibular cortical bone thickness, and the buccolingual inclinations of the first and second molars.
However, because bidimensional radiographic representation of the region of the mandibular symphysis is plagued by intrinsic errors such as superimposition of anatomic structures, difficulty in identifying single dental elements, and magnification error of the x-ray because of the divergence of the radiant beam, it is only by using computed axial tomography that we can achieve accurate evaluation of the bony support of the mandibular incisors. Cone-beam CT yields high-definition images of the teeth and bone at a far lower dosage of radiation than that in medical imaging and closer to the range of standard dental film series.
Therefore, we used computed volumetric tomography in this study to verify a correlation between the morphology of the mandibular symphysis and the various facial typologies.
Material and methods
Cone-beam CT images of 148 patients between 19 and 43 years of age were analyzed. These tomographs were obtained by using a NewTom 3G volume scanner (QRsr1, Verona, Italy) at the following settings: field of view, 12 in; 110 kV (AP-LL); 2.00 mA (AP); and 1.00 mA (LL); exposure time, 5.4 seconds, and section thickness, 0.50 mm.
Subjects with syndromes, craniofacial malformations, or evidence of trauma, and those who had had surgery on the stomatognathic apparatus or previous orthodontic treatment, and those with metal prostheses that could generate scattering phenomena were excluded from the initial sample of 148 digital volumetric tomography scans. The remaining 80 tomographs were from subjects (Class I or Class II malocclusion) from 19 to 37 years of age (mean, 29.5 years). Each computed volumetric tomograph was then subjected to NewTom 3G analysis by an orthodontist who was an expert in the use of this software. This secondary reconstruction permitted the creation of 3-dimensional (3D) maximum-intensity projection images, from which it was possible to make the linear and angular measurements. Subsequently, the points required for construction of the diagnostic triangle according to Tweed were identified on each image: porion and orbitale to determine the Frankfort plane, and menton and gonion to determine the mandibular plane. Thus, via Tweed’s cephalometric analysis, the Frankfort-mandibular plane (FMA) angles were calculated for each subject, so that they were classified by facial type: 25 short-face subjects (FMA, 15°-21°), 27 normal-face subjects (FMA, 22°-28°), and 28 long-face subjects (FMA, 29°-35°).
A further secondary reconstruction was created for each digital volumetric tomography scan using NewTom 3G software to obtain axial sections that allowed identification of the dental canals of the central and lateral incisors. A line passing through the center of each canal of the root was then traced, from the left canine to the right canine, and the software automatically generated sagittal sections 0.5 mm apart of the mandible perpendicular to this line ( Fig 1 ).
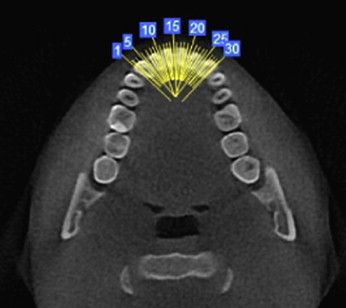
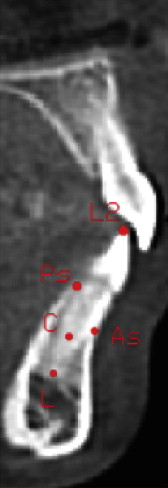
Constructing the sagittal plane through the center of the radicular canal ensured that the various sagittal scans of each tooth corresponded to the central axis of each root. Moreover, the availability of many sagittal sections can be extremely advantageous in evaluating the structures involved. In this case, the sagittal sections analyzed were those passing through the central axes of the 2 central and 2 lateral incisors. For each of these sections, the following measurements were calculated ( Fig 2 ): (1) height of the mandibular symphysis, the segment parallel to the axis of the incisor from prosthion to the external surface of the lingual cortex; (2) cancellous bone height of the mandibular symphysis, the line parallel to the axis of the incisor from the vestibular to the lingual cortex of the symphysis; (3) thickness of the mandibular symphysis, the segment perpendicular to the axis of the incisor that passes through the apex of the root between the external surfaces of the lingual and vestibular cortices; and (4) cancellous bone thickness of the mandibular symphysis, the line perpendicular to the axis of the incisor that passes through the apex of the root coincident with the thickness of the symphysis between the internal surfaces of the lingual and vestibular cortices.

We subsequently divided the cancellous bone thickness into vestibular and lingual portions ( Fig 2 ).
Twenty-four measurements (6 for each section) were made with the NewTom 3G software for each of the 80 patients, giving 1920 measurements.
Each sagittal section was saved in JPEG format and imported into the planning program AutoCAD (16.2, 2005, Autodesk inc, San Rafael, California), which allowed us to calculate the total area and the internal (cancellous bone) area of the symphyses.
The mandibular incisors and the osseous variables in the region of the incisors were defined as follows ( Figs 3 and 4 ): (1) axis of the incisor, the line that passes through the apex of the root (point L) and the central incisal margin (point L2); (2) points As and Ps, the most anterosuperior and posterosuperior points of the mandibular alveolar process, respectively; (3) center of rotation (C), the hypothetical center of rotation of the mandibular incisors was considered the median point of the portion of the root embedded in bone, halfway along an imaginary line passing through As and Ps and the root apex; and (4) points A and P, the points on the internal surfaces of the anterior cortex and the posterior cortex, respectively, where the radicular apices would meet if a trajectory of the hypothetical rotation of the roots of the mandibular incisors around their center of rotation was plotted.
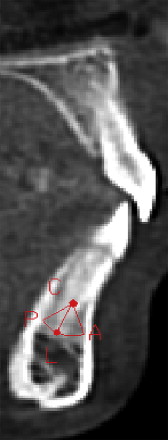
The other variables, calculated with AutoCAD, were as follows ( Fig 4 ): (1) A-P, the arc between points A and P that corresponds to the cancellous bone thickness of the alveolar process; (2) A-L, the arc between points A and L that identifies the labial portion of the cancellous bone of the symphysis and indicates the distance that the apex of the root could move in a vestibular direction without involving the cortex; (3) L-P, the arc between points L and P identifies the lingual portion of the cancellous bone of the symphysis and indicates how far the apex of the root could move in a lingual direction without involving the cortex; and (4) angle A-C-L, the intersection of lines A-C (the point where the radicular apex meets the internal profile of the vestibular surface of the cortex and center of rotation) and C-L (center of rotation and radicular apex) and indicates how much the crown of the mandibular incisor could be moved lingually and the apex moved vestibularly; and (5) angle P-C-L, the intersection of lines L-C (radicular apex and center of rotation) and C-P (center of rotation and the point where the radicular apex meets the internal profile of the lingual surfacial of the cortex) and indicates how much the crown of the mandibular incisor could be moved vestibularly and the apex moved lingually.
AutoCAD was used to make 20 measurements (5 for each section) for each of the 80 patients, giving 1600 measurements, which, with the measurements made with the NewTom 3G software, made a total of 3520 measurements.
Statistical analysis
The F test, or 1-way analysis of variance (ANOVA), was used for the analysis, in which we initially compared the various facial types and then analyzed the 4 incisors of each facial type. The means and standard deviations of each value were then calculated.
When ANOVA was significant at 95%, the Tukey HSD post-hoc test was applied to verify where the statistically significant differences were correlated.
Results
In Tables I through IV , the means and standard deviations of the measurements for each incisor in the 3 groups (short, normal, and long faces) are detailed; in the last 2 columns, the results of the statistical analysis are reported.
| Short (S) | Long (L) | Normal (N) | |||
|---|---|---|---|---|---|
| Mean (SD) | Mean (SD) | Mean (SD) | ANOVA test F | Tukey HSD test | |
| Total bone height (mm) | 20.92 (3.17) | 22.64 (2.51) | 21.79 (2.61) | NS | |
| Cancellous bone height (mm) | 11.22 (2.64) | 12.03 (1.92) | 11.36 (2.78) | NS | |
| Total bone thickness (mm) | 9.32 (2.20) | 7.42 (2.20) | 8.39 (2.02) | 0.026 | 0.019 S-L |
| Cancellous bone thickness (mm) | 5.16 (1.89) | 3.70 (2.09) | 4.42 (2.23) | NS | |
| Labial part (mm) | 3.36 (1.57) | 2.33 (1.23) | 2.90 (1.58) | NS | |
| Lingual part (mm) | 1.80 (0.98) | 1.39 (1.19) | 1.52 (0.90) | NS | |
| Total area (mm 2 ) | 200.44 (50.81) | 191.88 (33.53) | 184.05 (34.77) | NS | |
| Cancellous area (mm 2 ) | 78.48 (30.12) | 78.54 (23.37) | 69.87 (20.57) | NS | |
| A-P (°) | 4.59 (2.01) | 3.57 (2.11) | 4.07 (2.37) | NS | |
| A-C-L (°) | 2.80 (1.36) | 2.10 (1.16) | 2.54 (1.60) | NS | |
| L-P (°) | 1.79 (1.20) | 1.47 (1.23) | 1.53 (0.92) | NS | |
| A-L (°) | 47.85 (17.63) | 32.65 (12.39) | 43.20 (20.92) | 0.023 | 0.020 S-L |
| P-C-L (°) | 29.00 (18.86) | 21.55 (14.81) | 25.40 (13.32) | NS |
| Short (S) | Long (L) | Normal (N) | |||
|---|---|---|---|---|---|
| Mean (SD) | Mean (SD) | Mean (SD) | ANOVA test F | Tukey HSD test | |
| Total bone height (mm) | 21.81 (3.33) | 23.30 (2.57) | 22.31 (3.00) | NS | |
| Cancellous bone height (mm) | 13.08 (2.66) | 13.72 (2.26) | 12.96 (2.81) | NS | |
| Total bone thickness (mm) | 9.61 (2.03) | 7.78 (2.23) | 9.30 (2.62) | 0.034 | 0.039 S-L |
| Cancellous bone thickness (mm) | 5.59 (1.87) | 4.07 (2.00) | 5.07 (2.39) | NS | |
| Labial part (mm) | 3.61 (1.24) | 2.57 (1.03) | 3.60 (1.69) | 0.024 | 0.045 S-L 0.047 N-L |
| Lingual part (mm) | 1.98 (1.04) | 1.50 (1.18) | 1.47 (1.07) | NS | |
| Total area (mm 2 ) | 221.06 (52.98) | 206.75 (39.61) | 201.26 (35.14) | NS | |
| Cancellous area (mm 2 ) | 96.96 (34.35) | 88.76 (25.88) | 82.30 (27.10) | NS | |
| A-P (°) | 4.85 (1.77) | 3.92 (2.07) | 4.39 (2.26) | NS | |
| A-C-L (°) | 2.93 (0.99) | 2.38 (1.06) | 2.99 (1.44) | NS | |
| L-P (°) | 1.91 (1.14) | 1.54 (1.18) | 1.40 (0.98) | NS | |
| A-L (°) | 53.90 (12.83) | 37.20 (9.98) | 47.35 (14.47) | 0.001 | 0.001 S-L 0.035 N-S |
| P-C-L (°) | 34.10 (17.68) | 23.50 (16.06) | 21.95 (13.01) | 0.035 | 0.045 S-N |
| Short (S) | Long (L) | Normal (N) | |||
|---|---|---|---|---|---|
| Mean (SD) | Mean (SD) | Mean (SD) | ANOVA test F | Tukey HSD test | |
| Total bone height (mm) | 21.18 (3.24) | 22.33 (2.22) | 21.46 (2.64) | NS | |
| Cancellous bone height (mm) | 13.29 (2.65) | 13.19 (2.36) | 12.93 (3.35) | NS | |
| Total bone thickness (mm) | 9.62 (2.43) | 7.58 (1.99) | 9.10 (2.68) | 0.024 | 0.023 S-L |
| Cancellous bone thickness (mm) | 5.66 (2.18) | 3.89 (2.11) | 4.96 (2.34) | 0.047 | 0.037 S-L |
| Labial part (mm) | 3.72 (1.74) | 2.52 (1.23) | 3.47 (1.50) | 0.036 | 0.038 S-L |
| Lingual part (mm) | 1.94 (1.13) | 1.37 (1.14) | 1.49 (1.12) | NS | |
| Total area (mm 2 ) | 222.94 (55.06) | 206.38 (37.77) | 210.80 (36.88) | NS | |
| Cancellous area (mm 2 ) | 98.52 (34.46) | 93.30 (29.38) | 84.17 (29.83) | NS | |
| A-P (°) | 4.85 (2.02) | 3.64 (2.03) | 4.45 (2.42) | NS | |
| A-C-L (°) | 2.91 (1.31) | 2.20 (1.06) | 2.90 (1.41) | NS | |
| L-P (°) | 1.94 (1.29) | 1.39 (1.20) | 1.56 (1.31) | NS | |
| A-L (°) | 49.40 (17.86) | 40.55 (16.22) | 49.95 (15.25) | NS | |
| P-C-L (°) | 32.45 (19.96) | 23.05 (16.31) | 24.10 (17.54) | NS |
| Short (S) | Long (L) | Normal (N) | ||
|---|---|---|---|---|
| Mean (SD) | Mean (SD) | Mean (SD) | ANOVA test F | |
| Total bone height (mm) | 20.49 (3.04) | 21.60 (2.05) | 20.95 (2.69) | NS |
| Cancellous bone height (mm) | 11.39 (2.77) | 12.13 (18.4) | 11.16 (2.53) | NS |
| Total bone thickness (mm) | 9.37 (2.20) | 7.62 (2.18) | 8.96 (2.76) | NS |
| Cancellous bone thickness (mm) | 5.28 (2.03) | 3.75 (2.67) | 4.76 (2.60) | NS |
| Labial part (mm) | 3.73 (1.56) | 2.61 (1.52) | 3.29 (1.78) | NS |
| Lingual part (mm) | 1.56 (0.89) | 1.14 (1.19) | 1.47 (1.17) | NS |
| Total area (mm 2 ) | 201.58 (57.92) | 192.66 (40.26) | 191.90 (37.83) | NS |
| Cancellous area (mm 2 ) | 82.29 (32.31) | 80.61 (25.02) | 70.53 (23.69) | NS |
| A-P (°) | 4.82 (2.07) | 3.43 (2.12) | 4.01 (2.20) | NS |
| A-C-L (°) | 3.16 (1.42) | 2.24 (1.29) | 2.63 (1.41) | NS |
| L-P (°) | 1.61 (0.99) | 1.20 (1.26) | 1.38 (1.14) | NS |
| A-L (°) | 46.80 (16.55) | 37.35 (14.95) | 42.55 (18.20) | NS |
| P-C-L (°) | 22.85 (11.05) | 18.05 (18.05) | 19.45 (14.37) | NS |
At the mandibular right lateral incisor ( Table I ), because the values for the total thickness and angle A-C-L were significant with ANOVA, the Tukey HSD test was used to compare each facial type with the others. The mean thickness of the symphysis in short-face subjects (9.32 ± 2.20 mm) was significantly greater ( P = 0.019) than that in the long-face subjects (7.42 ± 2.20 mm). The Tukey test also had a P value of 0.020 for angle A-C-L, showing that the mean is distinctly greater in subjects with short faces (47.85° ± 17.63°) than in those with long faces (32.65° ± 17.63°).
At the mandibular right central incisor ( Table II ), ANOVA showed statistically significant differences in total thicknesses, thickness of the vestibular portion, angle A-C-L, and angle P-C-L. From the Tukey HSD test, we can see, by comparing the facial types, that the mean A-C-L angle in short-face subjects (53.90° ± 12.83°) was significantly greater ( P = 0.001) than that in long-face subjects (37.20° ± 9.98°), as was the mean in normal-face subjects (47.35° ± 14.47°, P = 0.035). For angle P-C-L, the mean in short-face subjects (34.10° ± 17.68°) was significantly greater ( P = 0.045) than that in normal-face subjects (21.95° ± 13.01°). The mean total thickness in short-face subjects (9.61 ± 2.03 mm) was significantly greater ( P = 0.039) than that in long-face subjects (7.78 ± 2.23 mm). Relative to the vestibular part, the mean thickness in short-face subjects (3.61 ± 1.24 mm) was significantly greater ( P = 0.045) than that in long-face subjects (2.57 ± 1.03 mm) and normal-face subjects (3.60 ± 1.69 mm, P = 0.047).
For the mandibular left central incisor ( Table III ), the F-test showed significant differences in total thickness, cancellous bone thickness, and thickness of the vestibular part. The Tukey HSD test showed that the mean total thickness in short-face subjects (9.62 ± 2.43 mm) was significantly greater ( P = 0.023) than in long-face subjects (9.10 ± 2.68 mm), the mean cancellous bone thickness in short-face subjects (5.66 ± 2.18 mm) was significantly greater ( P = 0.037) than in long-face subjects (3.89 ± 2.11 mm), and the mean thickness of the vestibular part in short-face subjects (3.72 ±1.74 mm) was significantly greater ( P = 0.038) than those measured in long-face subjects (2.52 ± 1.23 mm).
The mandibular left lateral incisor ( Table IV ) showed no significant differences between the 3 facial biotypes with ANOVA.
In Tables V through VII , the means and standard deviations of the measurements for each group are reported, with, in the last 2 columns, the results of ANOVA and the Tukey HSD tests.
| 4.2 (A) | 4.1 (B) | 3.1 (C) | 3.2 (D) | |||
|---|---|---|---|---|---|---|
| Mean (SD) | Mean (SD) | Mean (SD) | Mean (SD) | ANOVA F test | Tukey HSD test | |
| Total bone height (mm) | 20.92 (3.17) | 21.81 (3.34) | 21.18 (3.24) | 20.49 (3.04) | 0.002 | 0.05 A vs B 0.001 B vs D |
| Cancellous bone height (mm) | 11.22 (2.64) | 13.08 (2.66) | 13.29 (2.65) | 11.39 (2.77) | 0.001 | 0.001 A vs B-C 0.001 B vs D 0.001 C vs D |
| Total bone thickness (mm) | 9.32 (2.20) | 9.61 (2.03) | 9.62 (2.43) | 9.37 (2.20) | NS | |
| Cancellous bone thickness (mm) | 5.16 (1.89) | 5.59 (1.87) | 5.66 (2.18) | 5.28 (2.03) | NS | |
| Labial part (mm) | 3.36 (1.57) | 3.61 (1.24) | 3.72 (1.74) | 3.73 (1.56) | NS | |
| Lingual part (mm) | 1.80 (0.98) | 1.98 (1.04) | 1.94 (1.13) | 1.56 (0.89) | NS | |
| Total area (mm 2 ) | 220.44 (50.81) | 221.06 (52.98) | 222.94 (55.06) | 201.58 (57.92) | 0.001 | 0.001 A vs B-C 0.001 B vs D 0.001 C vs A-D |
| Cancellous area (mm 2 ) | 78.48 (30.12) | 96.96 (34.35) | 98.52 (34.46) | 82.29 (32.31) | 0.001 | 0.01 A vs B-C 0.01 B vs D 0.01 C vs D |
| A-P (°) | 4.59 (2.01) | 4.85 (1.77) | 4.85 (2.02) | 4.83 (2.07) | NS | |
| A-C-L (°) | 2.80 (1.36) | 2.93 (0.99) | 2.91 (1.31) | 3.16 (1.42) | NS | |
| L-P (°) | 1.79 (1.20) | 1.91 (1.14) | 1.94 (1.29) | 1.61 (0.99) | NS | |
| A-L (°) | 47.85 (17.63) | 53.90 (12.83) | 49.40 (17.86) | 46.80 (16.55) | NS | |
| P-C-L (°) | 29.00 (18.86) | 34.10 (17.68) | 32.45 (19.96) | 22.85 (11.05) | 0.031 | 0.03 B vs C |
Stay updated, free dental videos. Join our Telegram channel
VIDEdental - Online dental courses


