Introduction
The purpose of this investigation was to characterize the placement pattern and factors influencing the primary stability of mini-implants in human cadavers. The factors studied were mini-implant length, placement depth, bone density, and bone type.
Methods
Sixty standard mini-implants (6, 8, and 10 mm; 20 of each size) were placed into the maxillas and mandibles of 5 fresh human cadavers. Computed tomography imaging was used to measure the placement pattern, bone density, and thickness surrounding each device. The mini-implants were subsequently subjected to increasing tensile forces (pull-out force) until failure, and the maximum mechanical anchorage force of each was recorded with a dynamometer. A statistical model was realized by using MATLAB version 7.5.0 with Statistics Toolbox 7 (MathWorks, Natick, Mass) including the maximum anchorage force, mini-implant length, bone type, placement depth, and density surrounding each section of the mini-implant.
Results
Placement depth was strongly dependent on mini-implant length: 15% of the 6-mm implants failed to anchor their parallel sections into cortical bone, but 95% of the 10-mm mini-implant parallel sections penetrated beyond the buccal cortical bone; all 20 tips of the 6-mm mini-implants (100%) reached cancellous bone, whereas 75% of the 10-mm implants penetrated both cortical plates, reaching the lingual cortical bone. Longer mini-implants were associated with greater incidences of sinus and bicortical perforations. The correlation coefficients between the initial maximum mechanical anchorage force and the studied factors were as follows: bone density and placement depth combined (r = 0.65, P <0.001), mini-implant length (r = 0.45, P = 0.004), bone density (r = 0.42, P = 0.007), and placement depth (r = 0.29, P = 0.06).
Conclusions
During mini-implant length selection, the clinician should consider the important trade-off between anchorage and risk of placement complications or damage to the tissues. Longer mini-implants enable more anchorage; however, they are associated with a higher risk of damage to neighboring structures. Placement depth and bone density at the site of mini-implant placement are the best predictors of primary stability.
The mini-implant is becoming a widely used temporary anchorage device in orthodontic treatment. Although previously developed intraoral devices usually provide insufficient anchorage, and extraoral appliances often suffer from poor patient compliance, the mini-implant offers reliable absolute anchorage by securing itself to skeletal bone. The innovative features of these devices are transforming orthodontic treatment planning and biomechanics. In particular, mini-implants provide absolute anchorage with just a simple surgical procedure, are available in a variety of shapes and sizes, can be placed in many locations around the mouth, and rarely require patient compliance.
Despite the rapidly growing use of mini-implants, there is still insufficient knowledge about optimal placement patterns, safety, and anchorage characteristics in relation to the bone into which they were placed. This lack of information might contribute to the rather high failure rate of these devices that could be a major deterrent for their use. A systematic review by Schätzle et al compared 17 studies assessing mini-screw failure rates and estimated an average rate of 16.4% by meta-analysis. Other recent studies have analyzed mini-implants in relation to factors such as implant type, cortical bone density, bicortical placement, cortical thickness, and maximum anchorage force. Nevertheless, the strong interdependence among these variables might obfuscate conclusions when analyzed individually. As a result, there are multiple conflicting theories pertaining to the key determinants of mini-implant stability. At present, there is a lack of comprehensive and well-controlled studies examining all of these factors simultaneously. Furthermore, no studies analyzing maximum anchorage force were done with human subjects.
In this study, a multifactorial approach with computed tomography (CT) was used to analyze the placement pattern and initial mechanical anchorage force of mini-implants in human cadavers. This unique approach allowed us to characterize mini-implant placement patterns in relation to relevant bone architecture and establish, for the first time, the correlation between initial mechanical anchorage force and bone density, bone thickness, and implant length.
Material and methods
Five unembalmed human cadavers were obtained by donation to the Virginia State Anatomical Program. Study approval was obtained by the Eastern Virginia Medical School Institutional Review Board, #09-06NH-0146. Only cadavers with posterior teeth and no postmortem processing of the tissues were included in the study. The average age of the cadavers was 87 years old (SD, ± 5 years); 2 were male, and 3 were female. Soft-tissue resections of the orobuccal tissues were performed to facilitate accurate and reproducible placement of the mini-implants. All dental restorative materials on the cadaver teeth that might interfere with the x-ray transmissions used by CT imaging were removed with a dental drill.
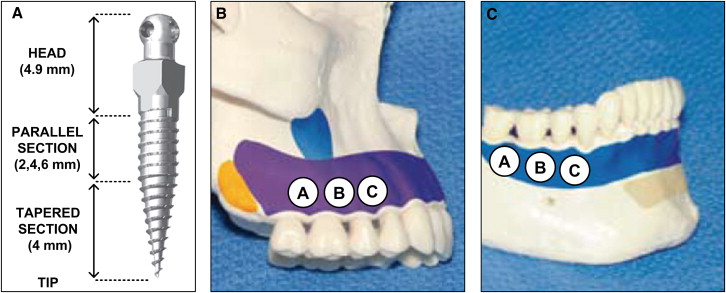
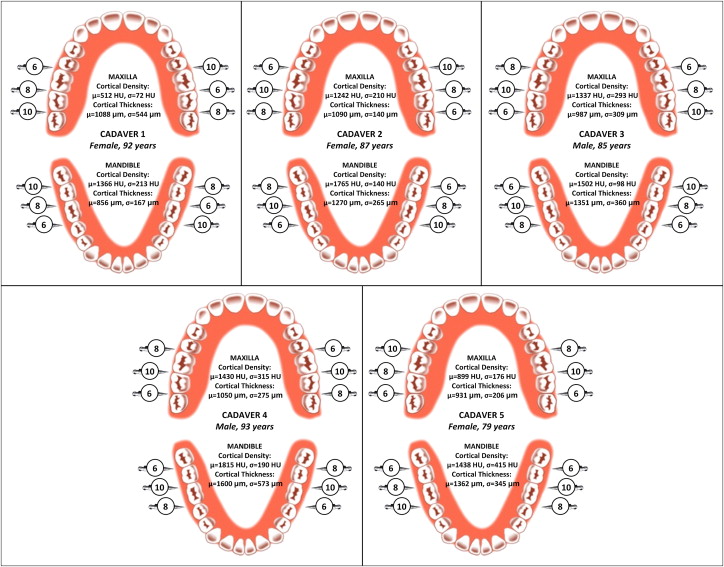
Twelve thread-forming 1.8-mm diameter mini-implants (IMTEC, 3M Unitek, Monrovia, Calif) ( Fig 1 , A ) were placed into the buccal alveolar bone of each cadaver by using an IMTEC Ortho LT driver (3M Unitek) ; 6 were placed into maxillary buccal alveolar bone ( Fig 1 , B ), and the other 6 were placed into mandibular buccal alveolar bone ( Fig 1 , C ), for a total of 60 mini-implants placed in the jaws of all 5 cadavers. The mini-implants were divided into 3 identifiable regions, from tip to head, that compose their length: (1) a conical tapered section designed to self-tap and drill the bone, (2) a cylindrically shaped parallel section designed to anchor into the bone, and (3) an unthreaded head region designed as an anchorage point ( Fig 1 , A ). An equal number of 6-, 8-, and 10-mm implants were used (20 of each length) and distributed across the 60 locations as shown in Figure 2 .
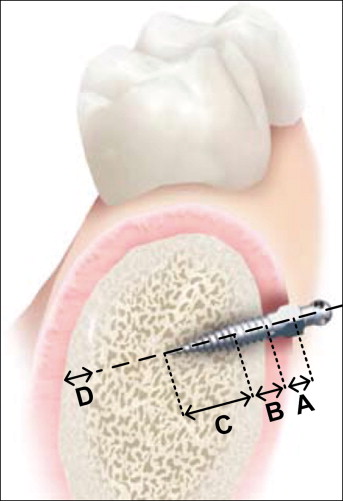
All mini-implants were placed by the same certified and experienced orthodontist (J.M.R.) in accordance with the manufacturer’s guidelines. In the case of excessive resistance to manual placement, pilot holes were made with a slow-speed straight handpiece at 800 rpm by using a 1-mm diameter hand piece 35 carbide bur (Kerr Jet Brand, Beavers Dental, Morrisburg, Ontario, Canada) to facilitate subsequent mini-implant placement. The pilot hole should not affect the primary stability of the implant. Soft-tissue thickness was verified with a measuring probe and was found to be less than 1.5 mm at all placement sites. (The manufacturer recommends a soft-tissue thickness of less than 1.5 mm when using the shortest [6 mm] mini-implant; all placement sites met this criterion.) The mini-implants were placed perpendicular to the buccal bone and between the roots of the teeth. A diagram of mini-implant placement into alveolar bone is provided in Figure 3 , where the soft tissues, and cortical and cancellous bones are clearly depicted.
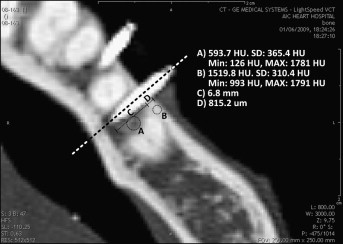
High-resolution CT images of each head were taken before and after the mini-implants were placed by using a LightSpeed 64 slide scanner (General Electric, Milwaukee, Wis) with sections spaced 0.625 mm apart. Characterization of the bone and placement pattern of each mini-implant was achieved by using View Personal (version 1.0.10.0; Synedra Information Technologies, Innsbruck, Austria) with the viewing scale set to 2 cm. More specifically, the bone type, thickness, and density surrounding the tip and parallel sections of the mini-implant were measured as illustrated in Figure 4 as a representative example. Damage to the neighboring structures was also assessed: root damage, and sinus and bicortical perforation. All measurements were repeated 3 times by the same person (G.L.) to prevent intraoperator variability.
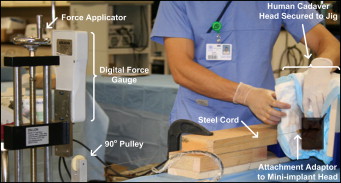
Maximum anchorage force for each mini-implant was measured by using the custom tensile-strength apparatus shown in Figure 5 . The cadaver specimens were secured with an adjustable vise, and screws were placed at multiple points into the temporal bones to prevent slippage and rotation while an 0.18-in nickel-titanium wire connected the head of the mini-implant to a dynamometer (GS digital force gauge; Dillon, Avery Weigh-Tronix, Montreal, Canada) with a maximum measurable force of 500 N and accuracy of 0.2 N. A slowly increasing tensile force was then applied to each mini-implant until failure, and then it was pulled out of the bone. The maximum initial anchorage force was recorded at this point. To mimic actual clinical procedures as much as possible and to standardize the process across all 60 mini-implants, the force was applied in a direction parallel to the occlusal plane. The entire apparatus was developed and tested on fresh pig heads before the actual human experimentation. (The apparatus that measured the maximum anchorage force of mini-implants was developed at McGill University with the help of Gary Savard from the Department of Mechanical Engineering.) All placement sites met these criteria. Materials, construction, and design were made to minimize elasticity in the setup and ensure a static tensile force between the mini-implant and the dynamometer.
Statistical analysis
The measurement data were used to construct a statistical model in MATLAB version 7.5.0 with Statistics Toolbox 7 (MathWorks, Natick, Mass), including the maximum anchorage force, mini-implant length, bone type, placement depth, and density surrounding each section of the mini-implant. The model was used to determine the correlation coefficients between these variables. The statistical significance level was set at P <0.05.
Results
The results of this study are divided into 2 parts: analysis of the placement pattern (location of the mini-implants as it relates to bone architecture and assessment of damage to neighboring structures) and determination of the initial maximum anchorage force and its relationship to implant length, placement depth, and bone density.
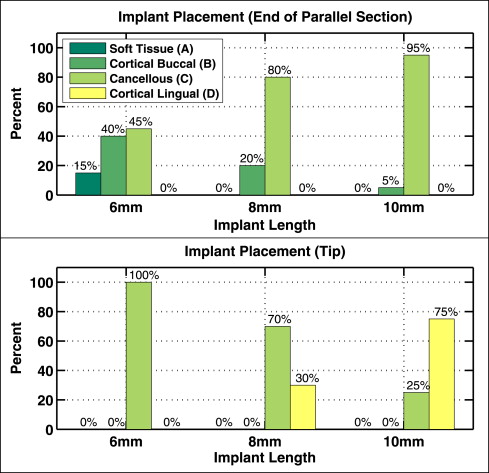
CT images were used to localize the tip and parallel section of each mini-implant into 1 of 4 layers ( Fig 3 ): soft tissue (gingiva), buccal cortical bone, cancellous bone, and lingual cortical bone. The distribution of the mini-implant tips and parallel sections in the 4 layers are plotted in Figure 6 for each implant length (6, 8, and 10 mm). The degree of implant penetration strongly depended on implant length: 15% of the 6-mm implants failed to anchor their parallel sections into cortical bone, whereas 95% of the 10-mm mini-implant parallel sections penetrated beyond the buccal cortical bone; all 20 tips of the 6-mm mini-implants (100%) reached cancellous bone, and 75% of the 10-mm implants penetrated both cortical plates, reaching the lingual cortical bone.
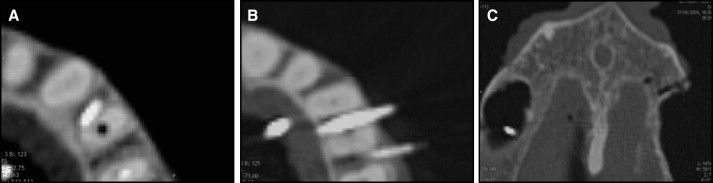
The CT images were also used to identify damage caused by the mini-implant to adjacent anatomic structures including (1) perforation into tooth root structures ( Fig 7 , A ), (2) bicortical placement and perforation ( Fig 7 , B ), and (3) penetration into sinuses ( Fig 7 , C ). The incidence of each is reported in Table I by group of implant length. Of the 60 mini-implants, 32 (53%) were placed less than 1 mm from an adjacent tooth root structure. Moreover, 25% of the 6-mm mini-implants, 30% of the 8-mm mini-implants, and 15% of the 10-mm mini-implants perforated directly into root structures. As for damage to adjacent anatomic spaces, none of the 6-mm implants, 10% of the 8-mm implants, and 15% of the 10-mm implants penetrated the maxillary sinus, and 30% of the 8-mm implants and 75% of the 10-mm implants reached the lingual cortical bone (bicortical placement). Of those bicortically situated, 1 of the 8-mm mini-implants and 6 of the 10-mm mini-implants perforated entirely through the lingual cortical plate, either in the palatal region, the nasal cavity, or the lingual area.
| 6-mm implant (n = 20) | 8-mm implant (n = 20) | 10-mm implant (n = 20) | |
|---|---|---|---|
| Average distance to adjacent root structure | 528 μm | 441 μm | 414 μm |
| Incidence of penetration into root structure | 5 (25%) | 6 (30%) | 3 (15%) |
| Incidence of bicortical placement | 0 (0%) | 6 (30%) | 15 (75%) |
| Incidence of sinus perforation | 0 (0%) | 2 (10%) | 3 (15%) |
The static tensile force at which each mini-implant failed, hereinafter called the maximum anchorage force, was measured by a dynamometer. Several confounding factors were encountered during the experiment: 7 mini-implant heads were damaged or broken during the pull-out tests, and cord slippage or instrumentation failure was encountered in 13 pull-out tests. Since the primary end point of the experiment was maximum anchorage force, these events were disqualified by definition and were not analyzed.
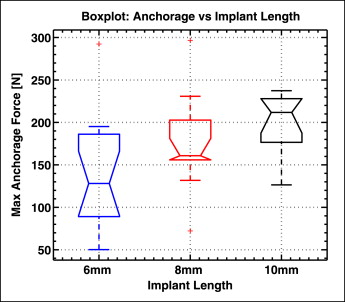
A boxplot of the maximum anchorage force is shown in Figure 8 for each mini-implant length. The median force increased from 128 N to 160 N and to 211 N for the 6-, 8-, and 10-mm mini-implants, respectively. Therefore, there was a significant difference between the anchorage force of the 6-mm and the 10-mm implants ( P <0.05). Although mini-implant length is a logical determinant of anchorage (especially since the placement pattern analysis showed that longer implants tended to penetrate deeper into the bone), the roles of bone density and thickness might be just as important. The correlation coefficients between maximum anchorage force and various combinations of these parameters were calculated, and the results are summarized in Table II . The correlation between anchorage force and bone thickness improved when both the cortical and the cancellous bones were considered. Furthermore, inclusion of both the parallel and the tapered sections of the mini-implant increased the correlation. Although the implant length provides a correlation to maximum anchorage force of r = 0.45 ( P = 0.004), a much stronger relationship was found with bone density and thickness. The strongest correlation (r = 0.65, P <0.001) was when the bone density and thickness of the parallel and tapered sections were considered simultaneously.
| Parallel section | Tapered section | Correlation (R) | 95% CI | P value | |
|---|---|---|---|---|---|
| L implant | x | x | 0.45 | 0.16–0.67 | 0.004 |
| ρ cortical | NA | NA | 0.42 | 0.13–0.65 | 0.007 |
| ρ cancellous | NA | NA | 0.36 | 0.06–0.61 | 0.021 |
| ID cortical | x | 0.26 | −0.06–0.53 | 0.110 | |
| ID cancellous | x | 0.24 | −0.08–0.51 | 0.137 | |
| ID cortical + ID cancellous | x | 0.27 | −0.04–0.54 | 0.087 | |
| ID cortical | x | x | 0.23 | −0.09–0.50 | 0.161 |
| ID cancellous | x | x | 0.21 | 0.177 | |
| ID cortical + ID cancellous | x | x | 0.29 | −0.02–0.55 | 0.066 |
| (ID cortical · ρ cortical ) | x | 0.49 | 0.21–0.69 | 0.002 | |
| (ID cancellous · ρ cancellous ) | x | 0.38 | 0.07–0.61 | 0.017 | |
| (ID cortical · ρ cortical ) + (ID cancellous · ρ cancellous ) | x | 0.55 | 0.29–0.74 | <0.001 | |
| (ID cortical · ρ cortical ) | x | x | 0.41 | 0.11–0.64 | 0.008 |
| (ID cancellous · ρ cancellous ) | x | x | 0.44 | 0.15–0.66 | 0.004 |
| (ID cortical · ρ cortical ) + (ID cancellous · ρ cancellous ) | x | x | 0.65 | 0.42–0.80 | <0.001 |
Stay updated, free dental videos. Join our Telegram channel
VIDEdental - Online dental courses


