Introduction
The purpose of this study was to compare the mandibular dental arch form and the mandibular basal bone arch form of patients with Class I malocclusion with those of patients with Class II Division 1 malocclusion. Our aims were to determine differences in dental and basal transverse dimensions and arch forms between the 2 groups, and to determine the usefulness of WALA points as a reference for predicting a stable dental arch form in Class II Division 1 patients.
Methods
Three-dimensional graphic representations of mandibular casts from 35 Class I malocclusion patients and 32 Class II Division 1 patients were created by using a laser scanning system. Anatomic reference points were subjectively identified and used to represent the dental arch form (FA points) and the arch form of the basal bone (WALA points).
Results
The FA point intercanine width was found to be significantly larger in the Class II Division 1 sample compared with the Class I sample, whereas the basal arch form, represented by the WALA ridge, was not significantly different. No significant difference was found in the FA points for intermolar width or in the arch form of the basal bone between the 2 groups. A highly significant correlation between basal and dental arch forms was found at the canine and molar areas in the Class II Division 1 sample, and the FA and WALA point arch forms were highly individual in the Class II Division 1 sample.
Conclusions
The mandibular dental arch forms for both the Class I and Class II samples were essentially the same, except at the canines; this is likely due to the nature of the occlusion in Class II Division 1 patients. There was no difference in arch forms of the basal bone between the 2 groups. The use of WALA points or other anatomic landmarks of the basal bone to predict the ideal dental arch form for a patient seems possible and could ensure a more stable orthodontic treatment outcome.
One goal of orthodontic treatment is to create a dental arch form that establishes a stable relationship with the underlying basal bone. To date, few studies have been done to determine the relationship of the arch form of the basal bone to arch forms characterized by anatomic points derived from teeth.
The term “apical base” is used to describe basal bone and was first defined by Lundstrom in 1925 as the junction of the alveolar and basal bones of the maxilla and the mandible in the region of the apices of the teeth. To appreciate the apical base clinically, Andrews and Andrews identified what they described as the “WALA ridge.” This ridge was defined by the band of keratinized soft tissue directly adjacent to the mucogingival line and represents the site of the apical base. By assigning points to the WALA ridge (WALA points) directly beneath the midpoints of the facial axes of corresponding teeth (FA points), they could investigate both the arch forms of the basal bone and the arch form characterized by the sites of the orthodontic brackets.
Recently, Ronay et al used 3-dimensional (3D) scans of the mandibular casts of 35 Class I malocclusion patients to compare the arch forms derived from WALA points with those from the FA points of corresponding teeth. They determined a highly significant correlation between FA and WALA point widths in the canine and molar areas. Their study also found that both arch forms derived from FA and WALA points were highly individual and could not be defined by 1 generalized shape. Investigation of the relationship of basal and dental arch forms in other classes of malocclusion would help to determine whether these findings are consistent for Class II Division 1, Class II Division 2, and Class III malocclusion patients. In our study, we compared the mandibular dental and basal arch forms of patients with Class II Division 1 malocclusion with those of Class I malocclusion patients.
The Class II malocclusion has been proposed to be the most commonly observed skeletal discrepancy in the orthodontic population. Efforts to characterize the dental arch form of patients with Class II malocclusion have yielded conflicting results. In 1965, Frolich compared the arch characteristics of children with Class II malocclusion with those of children with normal occlusion and found little variation in the absolute arch widths between the groups. However, most studies since then support the generally accepted conclusion that subjects with Class II Division 1 malocclusion have a narrower maxillary dental arch than those with Class I normal or ideal occlusion or Class I malocclusion.
Consensus on the mandibular arch form is more fleeting. Braun et al used beta function curves to describe the Class II Division 1 mandibular arch form as having a smaller arch width and depth than the Class I mandibular arch form. Sayin and Turkkahraman argued that mandibular intercanine width is greater in Class II Division 1 arches compared with Class I ideal occlusion arches, but there was no significant difference in the widths of the mandibular posterior teeth between the 2 groups. In contrast, Staley et al determined that mandibular intercanine widths were similar in Class I normal occlusion and Class II Division 1 malocclusion arches, whereas male subjects with Class I normal occlusion have greater intermolar widths. Usyal et al reported that mandibular intercanine widths of Class II Division 1 patients are significantly larger than those of patients with normal occlusion. Nie and Lin concluded that, although mandibular arches of subjects with Class II Division 1 malocclusion are larger than those of Class I normal occlusion subjects, arch shapes were not significantly different regardless of sex. Finally, Al-Khateeb and Alhaija found no significant difference in mandibular intercanine widths or arch lengths of Class II Division 1 malocclusion patients compared with Class I malocclusion patients. In general, most of these studies used multiple dental landmarks to create arch forms. Their inconsistent results show the need for further investigation of the mandibular arch form of subjects with Class II Division 1malocclusion, particularly at the basal arch level.
In our study, we asked whether (1) there is a difference in the transverse dimensions of the dental and basal arch forms for groups of Class II Division 1 and Class I malocclusion patients, (2) the mandibular arch forms derived from WALA and FA points differ between the 2 groups, and (3) there is a significant relationship between WALA and FA points in Class II Division 1 patients.
Material and methods
Pretreatment mandibular dental casts of Class I and Class II Division I malocclusion patients were selected from a sample of 750 patients for this study. The casts were selected by visual inspection, and the patients’ treatment records were reviewed. The data collected by Ronay et al were used for the Class I sample. Power analysis performed by Ronay et al indicated that a sample size of 32 or greater was needed. In the Class I group, 35 patients (13 boys, 22 girls) were randomly selected. Their mean age was 15 years, and the median age was 12 years. Those patients were classified as skeletal and dental Class I with an ANB angle of 0° to 4° and bilateral Class I molar and canine relationships. All patients had fully developed permanent dentitions from first molar to first molar. In the Class II Division 1 malocclusion group, 32 patients (15 boys, 17 girls) were randomly selected from the sample of 750 patients. Their mean age was 13 years, and the median age was 11 years. These patients were classified as skeletal and dental Class II Division 1 with an ANB angle of >4°, bilateral Class II canine and molar relationships, and protrusive incisors. All patients had fully developed permanent dentitions from first molar to first molar. Exclusion criteria for both groups included (1) missing or decayed teeth; (2) dental restorations that would alter tooth size, shape, or location of the midpoint of the clinical crown; (3) prosthetic crowns or gingival defects; (4) marked crowding or spacing (no tooth size-arch length or arch circumference discrepancy >2 mm); (5) unilateral or bilateral crossbite; and (6) casts with unidentifiable mucogingival junctions. Second molars were excluded from consideration because of the inability to ensure complete eruption in this age group. Institutional review board approval for this study was granted by Harvard Medical School.
A laser scanning system was used to scan the casts and achieve a 3D graphic representation of each model. The system consisted of a computer-assisted noncontact high-definition 3D scanning system including a laser-scanning unit (Dental Plaster Model Shape Scanning System, Surflacer Model VMS-100f, UNISN, Osaka, Japan), computer-aided-design software program (Dent-Merge version 5.0, UNISN), and dental cast analyzing software (version 9.0, Surfacer, Imageware, Ann Arbor, Mich). This system was used to create and edit images of the dental casts and identify anatomic landmarks used for arch form characterization. Hayama et al described the accuracy and performance characteristics of this system in a previous study.
The laser-scanning unit consisted of 4 main components: a slit-ray laser projector, 2 sets of video cameras, 2 x-y object tables, and an r-table to measure the circumference of the object. The mandibular dental casts were scanned at 3 angles in the frontal and sagittal planes. Each dental cast required 60 to 80 minutes to be scanned. Scanned images, including about 90,000 sets of x, y, and z coordinates per cast, were captured by the computer software. The data from the coordinates of both the frontal and sagittal planes were then joined and manually corrected for scanning errors. By using Dent-Merge software, the 2 planes were then merged into 1 data set. Finally, a 3D model of the entire cast was created with the cast-analyzing software (Surfacer).
By using the Surfacer software, the anatomic reference points were subjectively identified. The first author (R.L.B.) was calibrated with Ronay et al to ensure that the points were selected in the same manner. The reference points included the FA points and WALA points, defined below.
- 1.
For all teeth except the molars, the FA point is defined as the most prominent part of the central lobe of the clinical crown or the midpoint of the facial axis of the clinical crown. The FA point for the first molars is the most prominent point of the clinical crown in line with the mesiobuccal groove that separates the 2 large facial cusps. The FA point is the point on the crown where an orthodontic bracket would be placed for a fully preadjusted appliance system.
- 2.
The WALA point is defined as the point along the WALA ridge directly beneath the FA point of each tooth. The WALA ridge is a band of soft tissue immediately superior to the mandible’s mucogingival junction. It is located at or nearly at the same vertical level as the horizontal center of rotation of the teeth in an arch.
Each set of points was digitized as x, y, and z coordinates with the Surfacer software. The sets of points were then exported into Excel software (version 2002, Microsoft, Redmond, Wash) by using an ASCII format. A standard graph format was used to create individual graphs of WALA and FA points arch forms by connecting the individual FA and WALA point values by linear interpolation. Distances between the FA and WALA points for each tooth were then calculated. Mandibular intercanine and intermolar widths for FA and WALA points were also calculated.
To evaluate the reliability of the selection and assignment of the FA and WALA points, 10 mandibular dental casts were randomly selected from the sample. To determine intraoperator reliability, the FA and WALA points were reassigned on the right and the left sides of the dental arch 2 weeks after the initial assignments by the same examiner. Means and standard deviations of the 3D distance between the 2 locations were calculated to evaluate the reliability of landmark location. The same determination was made once by an independent operator to evaluate interoperator reliability. The intra- and interoperator reliability values for the FA points were 0.27 mm (SD, 0.22 mm) and 0.49 mm (SD, 0.63 mm), respectively. The intra- and interoperator reliability values for the WALA point were 0.71 mm (SD, 0.42 mm) and 0.95 mm (SD, 0.75 mm), respectively.
Statistical analysis
Statistical analysis of the mean distances and standard deviations between the FA and WALA points for the Class I and Class II Division 1 malocclusion groups was performed by using the Bonferroni test. Statistical comparison of the mandibular intercanine and intermolar widths of the 2 groups was performed by using an independent samples t test. Correlation statistics were used to assess the correlation between the FA and WALA point distances at the canine and molar areas for both groups.
Results
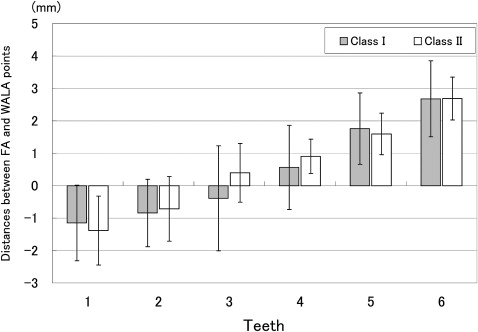
The mean distances and standard deviations between corresponding FA and WALA points for both groups and the results of the Bonferroni statistical test are shown in Table I . Bar graphs of these measurements are shown in Figure 1 , illustrating which FA points are located more lingually (positive values) and which are located more facially (negative values) in relation to corresponding WALA points. There was a positive mean distance between FA and WALA points in both groups at the molar and premolar sites. There was a negative mean distance between FA and WALA points at the incisor sites for both groups. In the Class I group, the mean distance between canine FA and WALA points was negative, whereas the mean distance between canine FA and WALA points was positive for the Class II Division 1 group. The only statistically significant difference between the Class I and Class II Division 1 FA and WALA point distances was at the canines, although the difference was small (0.8-mm difference between the mean values).
| Distances between FA and WALA points (mm) | |||||||
|---|---|---|---|---|---|---|---|
| 1 | 2 | 3 | 4 | 5 | 6 | ||
| Class I | Mean | −1.1 | −0.8 | −0.4 | 0.6 | 1.8 | 2.7 |
| SD | 1.2 | 1.0 | 1.6 | 1.3 | 1.1 | 1.2 | |
| Class II | Mean | −1.4 | −0.7 | 0.4 | 0.9 | 1.6 | 2.7 |
| SD | 1.1 | 1.0 | 0.9 | 0.5 | 0.6 | 0.7 | |
| Comparison | Difference | −0.2 | 0.1 | 0.8 | 0.3 | −0.2 | 0.0 |
| P | 0.2046 | 0.4897 | <0.0001 | 0.0636 | 0.3741 | 0.9559 | |
Descriptive statistics for FA and WALA point canine and molar widths for the 2 groups, and the results of the independent samples t test comparing FA and WALA point intercanine and intermolar widths are shown in Table II . The mandibular intercanine FA point widths were significantly larger in the Class II Division 1 malocclusion group compared with the mandibular intercanine FA point widths of the Class I malocclusion group ( P <0.05). No significant differences were found between mandibular intercanine WALA point widths, mandibular intermolar FA point widths, and mandibular intermolar WALA point widths.
| FA points | WALA points | |||
|---|---|---|---|---|
| Class I | Class II | Class I | Class II | |
| Canine width (mm) | ||||
| Mean | 27.5 | 28.5 | 28.8 | 29.2 |
| SD | 1.6 | 1.3 | 2.0 | 1.9 |
| t | 2.65 | 1.669 | ||
| P | 0.01 ∗ | 0.481 (NS) | ||
| Molar width (mm) | ||||
| Mean | 51.1 | 50.3 | 56.3 | 55.5 |
| SD | 2.9 | 2.4 | 3.1 | 2.3 |
| t | 1.19 | 1.241 | ||
| P | 0.237 (NS) | 0.219 (NS) | ||
Stay updated, free dental videos. Join our Telegram channel
VIDEdental - Online dental courses


