Introduction
The aim of this study was to assess the diagnostic accuracy and surface matching characteristics of 3-dimensional digital dental models obtained from various sources.
Methods
Three sets of maxillary and mandibular digital models of 30 subjects were included in this study. Three-dimensional stereolithography model files were obtained from a 3-dimensional laser desktop scanner (Ortho-Insight 3D; Motionview Software, Hixson, Tenn), the emodel system (GeoDigm, Chanhassen, Minn), and cone-beam computerized tomography. Arch-length discrepancy measurements were made on the 3-dimensional digital models and compared with direct caliper measurements. Additionally, stereolithography files from the 3 digital model systems were paired and superimposed using a best-fit algorithm. Average linear differences between the stereolithography shells were computed together with surface correlation amounts at various tolerance levels. Data were evaluated using intraclass correlation coefficients and the Tukey mean difference test.
Results
Although all 3 digital model groups displayed good correlation with caliper measurements, the virtual scan models had the highest correlation with the manual method (ICC > 0.95). The Tukey mean difference test showed no consistent bias of one approach vs the others compared with caliper measurements; random errors were detected in all the comparisons. For the estimation of arch-length discrepancy, the mean bias of the scanned virtual models in comparison with caliper measurements (0.24 ± 0.67 mm) was smaller than the mean biases of the emodels and the models generated from cone-beam computed tomography. Additionally, the best surface overlap correlation was observed between the virtual scanned models and the emodels. The mean linear distances between the stereolithography shells of these 2 model systems were 0.14 and 0.13 mm for the maxillary and mandibular arches, respectively.
Conclusions
All 3 digital model systems can provide diagnostic information similar to caliper measurements, with varying degrees of agreement limits. The scanned virtual models had the least mean bias. A strong surface match correlation was observed between the virtual scanned models and the emodels, indicating that these could be used interchangeably.
Plaster models have been the gold standard in dental diagnosis and treatment procedures for many years. However, they require rigorous archiving and massive physical storage space. Moreover, plaster models are not practical in the long term because of breakage and degradation issues associated with them. Accordingly, digital models made a rapid introduction into clinical practice in the late 1990s, and their clinical use has escalated since then.
There have been numerous efforts to investigate the diagnostic accuracy and measurement sensitivity of digital models compared with plaster models. It was reported that information obtained from digital models is interchangeable with direct caliper measurements made on conventional plaster models. According to these reports, 2-point linear measurements such as intermolar and intercanine width, tooth size, tooth height, overjet, and overbite always show near-excellent agreement between conventional models and the analog alternatives. However, some other studies have identified slightly high discrepancies between digital and stone models for comparisons of more complex diagnostic measurements such as the Bolton ratio, space analysis, and the irregularity ratio.
Different techniques used in obtaining digital models inevitably cause standardization issues and might account for differences between the conventional plaster and digital models. Not only do the digital models differ from each other regarding their construction phases, but they also require the use of various proprietary softwares. Ideally, it should be possible to view, measure, and store 3-dimensional (3D) digital models universally regardless of the technique-specific details. The stereolithography (STL) file format is an industry standard for computer-aided design and manufacturing and allows the 3D files to be viewed and manipulated universally by many software packages.
The aims of this study were to (1) evaluate the diagnostic accuracy of 3D STL files of the same dental anatomy obtained from different digitizing procedures and to compare them with direct caliper measurements using the same software, and (2) report the surface correlations of the 3D STL files of these model systems.
Material and methods
Approval for the study was obtained from the institutional review board of the University of Texas Health Science Center at Houston. The sample comprised the records of 30 orthodontic patients between the ages of 14 and 30 years. Each subject had maxillary and mandibular dental impressions made with Identic (Dux Dental, Oxnard, Calif) alginate along with bite registrations taken with polyvinyl siloxane material (Blue Moose; Parkell, Edgewood, NY). The impressions were immediately poured with Snow White Plaster (Kerr, Orange, Calif). The patients recruited for this study also had medium field-of-view (15 × 15 cm) cone-beam computed tomography (CBCT) scans in their files for various diagnostic purposes. All CBCT scans were made on the Galileos Comfort x-ray unit (Sirona Dental Systems, Bensheim, Germany) with exposure parameters of 85 kVp, 21 mA, 14 seconds, and 0.3-mm voxel size. CBCT scans with artifacts caused by patient movement and metal restorations were not included in the sample.
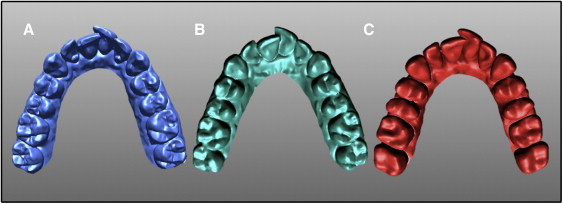
Three sets of maxillary and mandibular digital models were obtained via different protocols. The first group consisted of virtual dental models obtained with a 3D desktop scanner ( Fig 1 , A ). The Ortho Insight 3D laser scanner (Motionview Software, Hixson, Tenn) was used to directly scan the plaster models. The images were processed with Motionview software, which generated files with the STL extension for each dental model. The second group ( Fig 1 , B ) included digital models made with the emodel system (GeoDigm, Chanhassen, Minn). For this study, the models were scanned, digitized, and converted to STL files by the company. Once finalized, the files were downloaded from the company’s servers. The third group consisted of CBCT-generated digital dental models ( Fig 1 , C ). CBCT scans of the study sample were uploaded to the company’s servers (Anatomage, San Jose, Calif). The 3D images were segmented, digitally reformatted, and converted to STL files by the company. The digital models were then ready to download. All STL files in the 3 groups were saved in the same personal computer (Core i7-2600 CPU @3.40 Ghz with 8 MB of memory; Intel, Fort Worth, Tex).
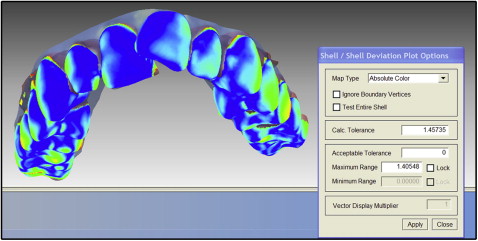
The plaster models were measured manually with a digital caliper. These measurements set the gold standard in this study. The same software was used for manipulation and measurements of the 3D STL files. The files were opened in random order with the Rapidform software program (Inus Technology, Seoul, South Korea). Mesiodistal tooth widths and dental arch segments were measured on both the plaster models and the STL files to the nearest 0.01 mm. Maxillary and mandibular arch-length discrepancies were calculated based on these measurements. STL files from all 3 groups of digital models were also paired and digitally registered to create 3 groups that reflected the differences in the surface areas of these models. Surface registration of the model pairs was accomplished using the best-fit algorithm of the Rapidform software ( Fig 2 ). After the registration protocol, average linear differences between the 2 STL files were recorded using the measurement tool of the same software. Additionally, surface overlap correlations between the file pairs were evaluated at 3 tolerance levels: 0.25, 0.5, and 1 mm.
Statistical analysis
Two examiners (S.A. and C.S.), working independently, repeated all measurements twice 3 to 4 weeks later. The intraobserver repeatability and reproducibility of these observers were evaluated with intraclass correlation coefficients (ICCs). One-way analysis of variance (ANOVA) was used to compare the mean values of the measurements between the 4 groups. Agreement between the digital platforms compared with the caliper measurements was evaluated with both ICCs and the Tukey mean difference test (Bland-Altman analysis). Statistical analyses were carried out with both SPSS statistics (version 20; IBM, Armonk, NY) and XLSTAT Mac (version 2012; Addinsoft, New York, NY).
Results
Both the intraobserver repeatability and the reproducibility of the observers showed near perfect agreement (ICCs > 0.92). According to 1-way ANOVA, no significant differences were found between the groups for the arch-length discrepancy measurements ( Table I ). The ICCs of the digital platforms compared with the caliper measurements are listed in Table I . Although all 3 digital model groups had good correlations with the caliper measurements, the virtual scan models had the highest correlation with the manual method (ICCs > 0.95). The findings from the Tukey mean difference test supported this finding and are summarized in Table II . Tukey mean difference plots can be seen in Figure 3 . This analysis showed no consistent bias of 1 approach vs the others compared with the caliper measurements, and random errors were detected in all comparisons. For the estimations of arch-length discrepancies in both jaws, the mean bias (0.24 ± 0.67 mm) of the scanned virtual models compared with the caliper measurements was smaller than the mean biases for the emodels and the CBCT-generated models. All 3 digital platforms provided similar measurements to the caliper measurements. However, from a clinical perspective, the measurements on the scanned virtual models provided better agreement with the manual caliper measurements, as shown by the smaller confidence interval (agreement limit) range ( Table II ).
| Caliper measurements | Emodels | Virtual scanned models | CBCT-generated models | ||||||||
|---|---|---|---|---|---|---|---|---|---|---|---|
| Mean | SD | Mean | SD | ICC | Mean | SD | ICC | Mean | SD | ICC | |
| Maxillary crowding (mm) | 4.9 | 3.8 | 4.4 | 3.3 | 0.91 | 4.7 | 3.3 | 0.95 | 4.5 | 3.0 | 0.85 |
| Mandibular crowding (mm) | 4.7 | 3.1 | 4.3 | 3.0 | 0.89 | 4.5 | 3.0 | 0.96 | 4.2 | 3.2 | 0.85 |
| Caliper measurements compared with | |||
|---|---|---|---|
| Emodels | Scanned virtual models | CBCT-generated models | |
| Bias | −0.49 | −0.24 | −0.45 |
| SD | 0.81 | 0.67 | 1.10 |
| 95% CI | −2.11 to 1.23 | −1.62 to 1.1 | −2.65 to 1.74 |
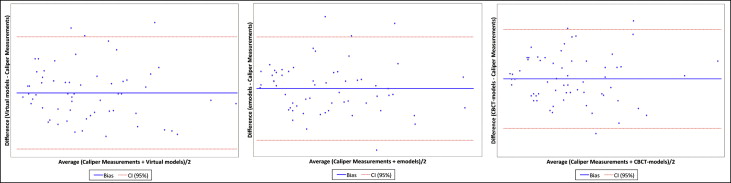
Table III presents the summary of the surface registration analysis of the matched pairs of maxillary and mandibular digital models. The best surface overlap correlation was observed between the virtual scanned models and the emodels. The mean linear distances between the STL shells of these 2 model systems were 0.14 and 0.13 mm for the maxillary and mandibular arches, respectively. However, when the virtual scanned models or the emodels were paired with CBCT-generated models, the mean surface difference increased by almost 0.2 mm in both cases. A 95% surface overlap correlation was observed between the virtual scanned models and the emodels at a tolerance level of 0.5 mm ( Table IV ). This means that if a 0.5-mm average linear distance between the 2 STL files could be tolerated, 95% of the surface area would coincide. However, the same amount of surface overlap correlation (95%) did not exist in the paired groups, including the CBCT-generated models, until the tolerance level was doubled. At the 1-mm tolerance level, the virtual scanned models and the emodels displayed 99% correlations.
| n | Mean (mm) | SD | |
|---|---|---|---|
| Maxillary model pairs | |||
| Scanned virtual models and emodels | 30 | 0.14 | 0.04 |
| Scanned virtual models and CBCT- generated models | 30 | 0.32 | 0.06 |
| CBCT-generated models and emodels | 30 | 0.34 | 0.07 |
| Mandibular model pairs | |||
| Scanned virtual models and emodels | 30 | 0.13 | 0.04 |
| Scanned virtual models and CBCT-generated models | 30 | 0.31 | 0.06 |
| CBCT-generated models and emodels | 30 | 0.32 | 0.07 |
Stay updated, free dental videos. Join our Telegram channel
VIDEdental - Online dental courses


