Introduction
Computer software can be used to predict orthognathic surgery outcomes. The aim of this study was to subjectively compare the soft-tissue surgical simulations of 2 software programs.
Methods
Standard profile pictures were taken of 10 patients with a Class III malocclusion and a concave facial profile who were scheduled for double-jaw orthognathic surgery. The patients had horizontal maxillary deficiency or horizontal mandibular excess. Two software programs (Dentofacial Planner Plus [Dentofacial Software, Toronto, Ontario, Canada] and Dolphin Imaging [version 9.0, Dolphin Imaging Software, Canoga Park, Calif]) were used to predict the postsurgical profiles. The predictive images were compared with the actual final photographs. One hundred one orthodontists, oral-maxillofacial surgeons, and general dentists evaluated the images and were asked whether they would use either software program to plan treatment for, or to educate, their patients.
Results
Statistical analyses showed differences between the groups when each point was judged. Dolphin Imaging software had better prediction of nasal tip, chin, and submandibular area. Dentofacial Planner Plus software was better in predicting nasolabial angle, and upper and lower lips. The total profile comparison showed no statistical difference between the softwares.
Conclusions
The 2 types of software are similar for obtaining 2-dimensional predictive profile images of patients with Class III malocclusion treated with orthognathic surgery.
Over 70% of patients with a dentofacial deformity mention esthetics as the major factor motivating them to seek orthodontic or orthognathic treatment. In view of this, prediction generated by computerized techniques has become a resource used by many professionals around the world. However, a major concern regarding computer-assisted surgical prediction is its accuracy, and several studies have reached contrasting conclusions.
It is difficult, if not impossible, to foresee the facial changes after orthognathic surgery without visual aids. Manipulations of images with these programs influence a patient’s expectations about the end result. In addition, it is virtually impossible, even with present technology, to predict variables, such as the thickness of the soft tissues and muscular tonicity in computerized predictions.
Sarver et al reported that 89% of a patient sample judged video images to be realistic and thought that the goal was achieved. In addition, 83% of patients said that it helped them to decide whether to have the treatment. Sinclair et al analyzed the opinions of 2 experienced clinicians, using the prescribed plan, image software, and teleradiographs, and concluded that 60% to 80% of the simulated images were clinically accepted for the treatment plan. The areas evaluated were the lips, lip-mental sulcus, chin, and submental region. Although that study used only 2 clinicians to evaluate the images, it helped to guide other studies in the same area.
Since then, various computer programs have been released on the market: Dentofacial Planner Plus (Dentofacial Software, Toronto, Ontario, Canada) (DFP), Quick Ceph (Quick Ceph Systems, San Diego, Calif), Orthognathic Treatment Planner (GAC International, Birmingham, Ala), and Dolphin Imaging (version 9.0, Dolphin Imaging Software, Canoga Park, Ca) (DI), among others. Over the last few years, DI has gained popularity among professionals. Therefore, the aim of this study was limited to comparing, through subjective evaluation, the soft-tissue surgical simulation (predictive profile) of DFP and DI in patients with a Class III occlusion and a concave face treated with double-jaw orthognathic surgery.
Material and methods
Ten patients having orthognathic surgery participated in this study. The surgical movements were mandibular retropositioning and maxillary advancement, with linear movements of at least 4 mm in 1 bone segment or in the sum of maxillary advancement and mandibular retropositioning, and with minimal or no postsurgical orthodontic movement ( Table ).
| Movement (mm) | Horizontal of the maxillary incisor | Vertical of the maxillary incisor | Horizontal of the maxillary first molar | Vertical of the maxillary first molar | Horizontal of the mandibular incisor | Vertical of the mandibular incisor |
|---|---|---|---|---|---|---|
| Patient | ||||||
| 1 | 2.9 | –2.2 | 3.7 | 2.9 | –3.2 | –1.6 |
| 2 | 1.9 | –3.3 | 2.3 | –0.3 | –4.0 | –2.0 |
| 3 | 6.0 | 2.0 | 6.2 | 3.0 | –4.0 | 4.8 |
| 4 | 4.4 | 2.0 | 5.0 | 4.6 | –1.6 | 2.4 |
| 5 | 4.0 | 0.4 | 4.2 | 2.1 | –0.4 | 2.4 |
| 6 | 4.0 | –1.1 | 4.2 | 2.1 | –4.8 | 1.6 |
| 7 | 10 | 4.0 | 10 | 4.0 | –4.0 | 8.8 |
| 8 | 6.0 | –0.4 | 5.9 | –1.0 | –6.4 | 0.0 |
| 9 | 7.0 | –2.0 | 7.2 | –0.4 | –0.4 | –3.6 |
| 10 | 9.2 | –1.2 | 9.2 | –1.2 | –4.4 | 0.8 |
The profile prediction for this study were made 6 months after the surgery and used the real movements as the values of prediction. The real movements were obtained through the superimposition of the final cephalometry over the initial one of each patient. Then the soft-tissue images of preoperative, real predictive images of DFP and DI, and postoperative image were compared. All images were taken with the patient in centric relationship with the lips at rest.
The devices for creating the simulation of the postoperative profile were a Pentium 4 processor (Intel, Corporation, Santa Clara, Calif), a digitizer table (Numonics, Montgomeryville, Pa), a digital camera (EOS 10D, Canon, Lake Success, NY), DFP, DI, Photoshop (version 6.0, Adobe, San Jose, Calif), and PowerPoint software (Microsoft, Redmond, Wash).
The preoperative and postoperative profile images were digitized and standardized in the Photoshop program with regard to size, position, brightness, and contrast; they were cut a little behind the tragus and on the hairline. After this, they were exported to the Dentofacial Showcase (Dentofacial Software) and subsequently to the DFP and DI programs.
The postoperative lateral cephalometric radiographs for the DFP program were digitized by using the digitizer table; for the DI program, digitization was done with a scanner.
The maxillary and mandibular movements were made by using the real values in millimeters, previously obtained when comparing the preoperative and postoperative lateral cephalometric radiographs of the surgical movements in the vertical and horizontal directions for the maxillary incisors and molars and the mandibular incisors ( Table ).
To analyze the profile, we used the methods of Sinclair et al, Magro-Érnica, Giangreco et al to compare the simulated and real images according to the points or areas of analysis (tip of the nose, nasolabial angle, upper lip, lower lip, menton region, base of the mandible, and complete profile) and the similarity among images (ranging from very similar to different). The PowerPoint program was used to create a comparative presentation between the images simulated by the programs and the real postoperative image. For each slide, there was a corresponding form to be filled out by the examiners. The form explained the scale for classifying the images.
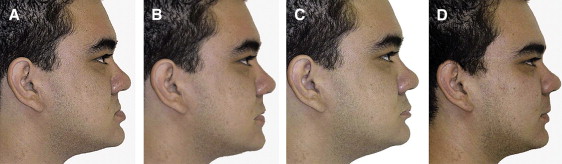
One hundred one dentists, including orthodontists, maxillofacial surgeons, and general dentists, evaluated the images and filled out a form for each patient. The images of a patient are shown in Figure 1 .