Introduction
The purpose of the study was to examine the changes in stability of pharyngeal airway space (PAS) and hyoid bone position after 2 types of mandibular osteotomies in comparison with a control group.
Methods
The subjects included 46 Japanese women with skeletal Class III malocclusion. Twenty-five patients with mandibular prognathism underwent single-jaw surgery with bilateral sagittal split ramus osteotomy (SSRO), and 21 patients underwent bilateral intraoral vertical ramus osteotomy (IVRO). The control subjects included 30 volunteer women with normal occlusion. The treated subjects were assessed at the beginning of treatment, immediately after surgery, and after postsurgical treatment.
Results
The Class III subjects had a significantly wider PAS than did the control subjects. Significant decreases in the lower PAS were observed after orthognathic surgery. The hyoid bone showed upward and forward movement with upward movement of the lower border of the PAS during the postsurgical stage in the SSRO group. In contrast, the anterior border of the PAS and the hyoid bone showed considerable backward movement in the IVRO group.
Conclusions
The posttreatment morphology of the PAS in both Class III groups approached that of the control group. The IVRO group showed a reduction in the airway dimensions, especially during the postsurgical period, which occurred during surgery in the SSRO group.
Mandibular setback surgery improves the occlusion, function, and esthetics by changing the position of the mandible, but it can also cause narrowing of the pharyngeal airway space (PAS) and changes in the position of the hyoid bone and the tongue. Pharyngeal airway narrowing can cause obstructive sleep apnea syndrome (OSAS). Riley et al suggested that mandibular setback might contribute to further development of OSAS after surgery, and it could be associated with airway patency because airway resistance appears to increase after surgery. Kawakami et al demonstrated that PAS was maintained shortly after mandibular setback surgery, whereas the hyoid bone moved inferiorly to compensate for the reduction in the oral volume. The positions of the tongue and the hyoid bone are also thought to change after mandibular setback surgery.
A sagittal split ramus osteotomy (SSRO) has been performed based on the ability to apply rigid internal fixation with screw or plate devices, whereas an intraoral vertical ramus osteotomy (IVRO) without bony interface between the segments has been thought to be favorable for the treatment of patients with symptoms of temporomandibular disorders. A number of studies have demonstrated hard-tissue changes during postsurgical orthodontic treatment after SSRO and IVRO mandibular setback surgery. Although SSRO and IVRO patients showed similar levels of stability after surgery, the tendency to relapse differed because IVRO patients exhibited backward movement of the distal segment, but SSRO patients relapsed in the opposite direction. Differences in the skeletal and profile changes after the 2 types of surgical procedures have been compared; however, few studies have so far compared the postsurgical changes of the pharyngeal airway morphology and the hyoid bone position after these 2 types of mandibular osteotomy.
It was thus considered important to clarify the relationship between the morphologic changes in the lower face and those of the PAS with orthognathic treatment of skeletal mandibular prognathism patients with these 2 surgical procedures.
The purpose of this study was to evaluate the hypothesis that there is no change in stability in the PAS and the hyoid bone position after the 2 types of mandibular osteotomies. Furthermore, we focused on the changes after the release of the intermaxillary fixation (IMF), and we also compared these effects with patients in the control group.
Material and methods
The subjects consisted of 46 Japanese women who were diagnosed with mandibular prognathism and underwent single-jaw mandibular setback surgery with either SSRO (25 patients; mean age, 25.1 ± 5.6 years) or IVRO (21 patients; mean age, 24.2 ± 5.2 years), and had presurgical and postsurgical orthodontic treatment with the multi-bracket system ( Table I ). All subjects were randomly selected from the files of patients with jaw deformations registered between 2000 and 2006 in the Kyushu University Hospital at Fukuoka, Japan. Patients who either underwent bimaxillary surgery or had a craniofacial anomaly were excluded. No asymmetry patients were included in the study. The 46 patients were randomized to undergo either SSRO or IVRO according to an adaptive random-assignment procedure.
| Control (n = 30) | SSRO (n = 25) | IVRO (n = 21) | |||||
|---|---|---|---|---|---|---|---|
| Mean | SD | Mean | SD | Mean | SD | Difference | |
| Body mass index | 20.1 | 1.8 | 21.4 | 3.4 | 20.2 | 3.5 | NS |
| SNA,° | 82.7 | 3.6 | 81.2 | 3.4 | 81.4 | 4.4 | NS |
| SNB,° | 79.7 | 3.9 | 84.8 | 3.2 | 84.7 | 5.3 | NS |
| FMA,° | 27.4 | 5.7 | 29.8 | 3.2 | 30.0 | 6.9 | NS |
| Duration of presurgical orthodontic treatment, mo | – | – | 20.9 | 4.8 | 21.8 | 7.9 | NS |
| Average age at operation, y | – | – | 25.1 | 5.6 | 24.2 | 5.2 | NS |
| Average amount of mandibular setback at T2, mm | – | – | 8.9 | 3.3 | 8.1 | 3.3 | NS |
| Average amount of mandibular setback at T3, mm | – | – | 8.1 | 3.1 | 10.4 | 3.8 | ∗ |
| Duration of maxillomandibular fixation, d | – | – | 13.6 | 1.3 | 20.9 | 1.5 | † |
| Duration of postsurgical orthodontic treatment, mo | – | – | 12.4 | 4.1 | 11.3 | 4.1 | NS |
| Duration of overall orthodontic treatment, mo | – | – | 33.4 | 6.3 | 33.1 | 9.9 | NS |
Maxillary premolars were extracted in 11 subjects who had SSRO and in 8 subjects in the IVRO group to eliminate maxillary crowding and reduce maxillary incisor proclination for decompensation. In the mandibular arch, incisor alignment and proclination were accomplished without extractions, except in 2 patients in the IVRO group with severe crowding. Semirigid fixation was used in the SSRO operation with 2 mono-cortical titanium screws (15.0 and 17.0 mm) on each side. The average amount of mandibular setback at Point B was 8.1 ± 3.1 mm in the SSRO group. IMF was postoperatively maintained for 13.6 ± 1.3 days. No osseous fixation was used in the IVRO group, but it was used in the IMF procedure until a mean of 21.5 ± 3.4 days after surgery. The average amount of mandibular setback at Point B was 10.4 ± 3.8 mm in the IVRO group.
The control group consisted of 30 volunteer women (mean age, 25.1 ± 5.6 years) with normal visual harmony of the facial and skeletal profile, and normal dental Class I occlusion, and normal overbite and overjet. The mean of the peer assessment rating index was 3.63 (SD, 2.93) in the control group, and the mean body mass index was 20.1 (SD, 1.8). All subjects in the volunteer group were healthy, with no craniofacial anomalies. They were recruited with the approval of the institutional ethics committee; their informed consent was obtained.
Lateral cephalometric radiographs were taken by a standardized technique with the mandible in the habitual occlusal position, the lips and tongue relaxed, and the cephalostat in the Frankfort horizontal. A lateral cephalogram was taken for each patient at the start of the presurgical orthodontic treatment (T1), immediately after surgery (T2), and after the postsurgical treatment (T3).
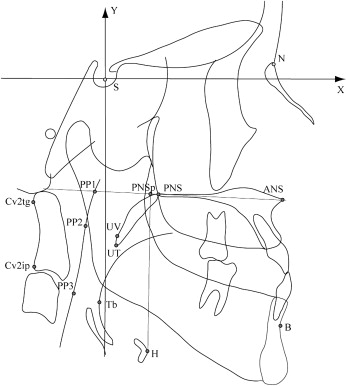
Sella was used as the origin, and a horizontal line passing through sella parallel to the Frankfort horizontal plane was used as the x-coordinate in the analyses. A line perpendicular to the x-axis passing through sella was defined as the y-coordinate.
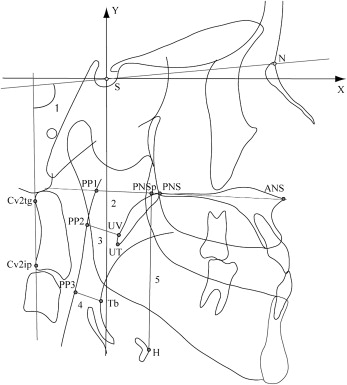
All cephalograms were traced on acetate paper by the same investigator (T.K.) to eliminate any interexaminer variability. The conventional cephalometric measurements and the coordinates of the reference points ( Figs 1 and 2 ) were calculated by using a cephalometric analysis software program (version 5, WinCEPH, Rise, Sendai, Japan). The measurements of the pharyngeal airway morphology and the hyoid bone position represented 4 linear variables and an angular variable. The width of the PAS was measured in the sagittal plane at 3 levels: nasopharynx (PP1-PNS), oropharynx (PP2-UV), and the region of minimal airway space at the base of the tongue (PP3-Tb).
A random sample of 20 cephalometric tracings was selected and digitized to assess the measurement errors. The measurements of the coordinates were completed twice on 2 separate occasions, 4 weeks apart, by the same investigator. The mean values measured on each occasion were compared by using paired t tests to detect any systematic errors. The error variance was calculated according to Dahlberg’s formula. The error analyses found no significant differences between any paired measurements ( Table II ). All x and y coordinates had accidental errors smaller than 1.0 mm.
| Landmark | X-coordinate | Landmark | Y-coordinate | ||
|---|---|---|---|---|---|
| Dahlberg agreement | Paired t test ( P value) | Dahlberg agreement | Paired t test ( P value) | ||
| H | 0.550 | 0.188 | H | 0.275 | 0.170 |
| PP1 | 0.535 | 0.368 | PP1 | 0.660 | 0.695 |
| PP2 | 0.795 | 0.332 | PP2 | 0.437 | 0.241 |
| PP3 | 0.900 | 0.359 | PP3 | 0.530 | 0.132 |
| Tb | 0.986 | 0.287 | Tb | 0.950 | 0.163 |
| UV | 0.487 | 0.151 | UV | 0.621 | 0.202 |
| UT | 0.636 | 0.167 | UV | 0.568 | 0.241 |
| Cv2ip | 0.794 | 0.133 | Cv2ip | 0.510 | 0.200 |
| Cv2tg | 0.606 | 0.389 | Cv2tg | 0.957 | 0.253 |
The Student t test was used to compare the mean differences in the x and y coordinates, and the linear and angular measurements among the 2 Class III groups (SSRO and IVRO) and the control group by using the JMP statistical software package (release 6.0, SAS Institute, Cary, NC). Any statistically significant differences in the cephalometric coordinates and variables between T1 and T3 were determined by paired t tests. Differences with P values less than 0.05 were considered statistically significant.
Results
No significant differences were identified, except for an average amount of mandibular setback at T3 and the duration of IMF between the SSRO and IVRO groups, as shown in Table I ( P <0.05 and P <0.001, respectively). The cephalometric parameters showed similar maxillomandibular relationships as denoted by the SNA, SNB, and FMA in the 2 patient groups.
Comparisons of the mean values and standard deviations of the hard-tissue variables between the 3 observation periods are presented in Table III . The SNB angle in both the SSRO and IVRO groups decreased significantly after surgery. At the postoperative stage, the SNB angle in the SSRO group appeared to be stable but was significantly decreased in the IVRO group ( P <0.001). The FMA showed posterior (clockwise) rotation after surgery in both the SSRO and IVRO groups ( P <0.05 and P <0.001, respectively). There were no significant postoperative changes in the SSRO group, whereas a significant increase of FMA was found in the IVRO group ( P <0.001).
| SSRO | IVRO | |||||||||||||||
|---|---|---|---|---|---|---|---|---|---|---|---|---|---|---|---|---|
| T1 | T2 | T3 | T1 | T2 | T3 | |||||||||||
| Mean | SD | Mean | SD | T1-T2 | Mean | SD | T2-T3 | Mean | SD | Mean | SD | T1-T2 | Mean | SD | T2-T3 | |
| SNB° | 84.8 | 3.2 | 80.2 | 3.7 | † | 80.4 | 3.5 | NS | 84.7 | 5.3 | 80.5 | 4.7 | † | 79.4 | 4.6 | ‡ |
| FMA° | 29.8 | 3.2 | 30.9 | 4.3 | ∗ | 30.7 | 3.5 | NS | 30.0 | 6.9 | 32.4 | 7.1 | † | 36.9 | 7.9 | ‡ |
The SSRO and IVRO groups’ measurements of the width of the PAS, the distance from palatal plane to the hyoid bone (PNSp-H) and the craniocervical angulations at the uppermost part of the cervical spine (OPT/NSL) at T1, T2, and T3 were compared and are presented in Table IV . One significant difference in the distance from the back of the tongue to the posterior pharyngeal wall (PP3-Tb) was observed between the SSRO and IVRO groups at the presurgical stage ( P <0.05).
| Procedure | n | OPT/NSL (°) | PP1-PNS (mm) | PP2-UV (mm) | PP3-Tb (mm) | PNSp-H (mm) | ||||||
|---|---|---|---|---|---|---|---|---|---|---|---|---|
| SSRO | T1 | 25 | 98.4 ± 4.1 | NS | 26.9 ± 3.4 | NS | 12.2 ± 3.2 | NS | 11.5 ± 3.1 | ∗ | 61.4 ± 5.0 | NS |
| IVRO | T1 | 21 | 99.4 ± 9.2 | 27.2 ± 3.9 | 12.7 ± 2.7 | 13.0 ± 2.6 | 59.9 ± 3.9 | |||||
| SSRO | T2 | 25 | 100.5 ± 6.0 | NS | 27.5 ± 2.2 | NS | 10.8 ± 2.1 | NS | 11.9 ± 3.6 | NS | 69.2 ± 6.1 | NS |
| IVRO | T2 | 21 | 100.8 ± 8.1 | 26.8 ± 3.7 | 9.9 ± 3.1 | 11.3 ± 3.3 | 66.3 ± 5.3 | |||||
| SSRO | T3 | 25 | 99.9 ± 6.7 | NS | 28.1 ± 3.1 | NS | 10.1 ± 2.9 | NS | 10.5 ± 2.9 | NS | 63.8 ± 4.3 | NS |
| IVRO | T3 | 21 | 100.8 ± 7.9 | 26.7 ± 3.5 | 8.8 ± 2.9 | 9.6 ± 3.2 | 62.5 ± 5.4 |
Table V shows the comparisons among the SSRO, IVRO, and control groups and the comparisons in measurements at each treatment stage of the PAS and hyoid bone. The distances from the uvula to the posterior pharyngeal wall (PP2-UV) and PP3-Tb in the Class III group were significantly greater than those in the control group at T1 ( P <0.05 and P <0.001, respectively).
| SSRO (n = 25) | IVRO (n = 21) | |||||||||||||||||||||||
|---|---|---|---|---|---|---|---|---|---|---|---|---|---|---|---|---|---|---|---|---|---|---|---|---|
| Control (n = 30) | T1 | T2 | T3 | T1 | T2 | T2 | ||||||||||||||||||
| Mean | SD | Mean | SD | Mean | SD | T1-T2 | Mean | SD | T2-T3 | Mean | SD | Mean | SD | T1-T2 | Mean | SD | T2-T3 | |||||||
| OPT/NSL,° | 100.8 | 7.9 | 98.4 | 4.1 | NS | 100.5 | 6.0 | NS | NS | 99.9 | 6.7 | NS | NS | 99.4 | 9.2 | NS | 100.8 | 8.1 | NS | NS | 100.8 | 7.9 | NS | NS |
| PP1-PNS, mm | 27.3 | 3.4 | 26.9 | 3.4 | NS | 27.5 | 2.2 | NS | NS | 28.1 | 3.1 | NS | NS | 27.2 | 3.9 | NS | 26.8 | 3.7 | NS | NS | 26.7 | 3.5 | NS | NS |
| PP2-UV, mm | 9.8 | 2.5 | 12.2 | 3.2 | † | 10.8 | 2.1 | NS | ‡ | 10.1 | 2.9 | NS | NS | 12.7 | 2.7 | † | 9.9 | 3.1 | NS | § | 8.8 | 2.9 | NS | ‖ |
| PP3-Tb, mm | 10.1 | 2.5 | 11.5 | 3.1 | ∗ | 11.9 | 3.6 | ∗ | NS | 10.5 | 2.9 | NS | ‖ | 13.0 | 2.6 | † | 11.3 | 3.3 | NS | ‡ | 9.6 | 3.2 | NS | ¶ |
| PNSp-H, mm | 60.9 | 5.4 | 61.4 | 5.0 | NS | 69.2 | 6.1 | † | § | 63.8 | 4.3 | ∗ | # | 59.9 | 3.9 | NS | 66.3 | 5.3 | † | § | 62.5 | 5.4 | NS | ¶ |
Significant differences were noted in the PNSp-H at T2, which was larger in the SSRO and IVRO groups than in the controls ( P <0.001). The PNSp-H significantly increased between T1 and T2 in the SSRO and IVRO groups ( P <0.001). In contrast, the linear measurement of PP2-UV significantly decreased ( P <0.01 and P <0.001, respectively). A significant decrease in the PP3-Tb was observed in the IVRO group ( P <0.01).
The PNSp-H of the SSRO group was significantly larger than in the control group at T3 ( P <0.05). The PNSp-H at T2 significantly decreased from T2 to T3 ( P <0.01 and P <0.001, respectively) in the SSRO and IVRO groups. The PP3-Tb significantly decreased in the SSRO group ( P <0.05), whereas significant decreases were also found at the PP2-UV ( P <0.05) and PP3-Tb ( P <0.01) in the IVRO group.
Table VI shows the horizontal and vertical changes of the landmarks of the PAS and the hyoid bone. The UV, Tb, and H in the SSRO and IVRO groups were in significantly more anterior positions than in the control group at T1 ( P <0.01 and P <0.001).
| Control (n = 30) | SSRO (n = 25) | IVRO (n = 21) | ||||||||||||||||||||||
|---|---|---|---|---|---|---|---|---|---|---|---|---|---|---|---|---|---|---|---|---|---|---|---|---|
| T1 | T2 | T3 | T1 | T2 | T3 | |||||||||||||||||||
| Landmark | Mean | SD | Mean | SD | Mean | SD | T1-T2 | Mean | SD | T2-T3 | Mean | SD | Mean | SD | T1-T2 | Mean | SD | T2-T3 | ||||||
| Horizontal | ||||||||||||||||||||||||
| H | 10.3 | 6.8 | 17.3 | 5.4 | ‡ | 12.6 | 8.1 | NS | ¶ | 14.6 | 5.6 | † | # | 17.7 | 8.3 | ‡ | 15.2 | 9.6 | ∗ | § | 12.7 | 6.9 | NS | # |
| PP1 | −7.7 | 3.1 | −7.0 | 3.7 | NS | −7.7 | 2.9 | NS | NS | −8.1 | 3.1 | NS | NS | −7.5 | 3.9 | NS | −6.9 | 3.8 | NS | NS | −7.6 | 3.2 | NS | NS |
| PP2 | −12.7 | 3.5 | −11.8 | 4.3 | NS | −12.5 | 4.2 | NS | NS | −13.0 | 3.8 | NS | NS | −11.4 | 4.2 | NS | −11.4 | 5.0 | NS | NS | −12.0 | 4.0 | NS | NS |
| PP3 | −16.3 | 5.0 | −13.5 | 5.4 | ∗ | −16.8 | 7.1 | NS | ¶ | −15.6 | 5.3 | NS | NS | −13.8 | 6.8 | NS | −14.6 | 7.5 | NS | NS | −15.7 | 6.1 | NS | NS |
| UV | −3.2 | 3.2 | 0.2 | 4.1 | ‡ | −2.0 | 4.2 | NS | ¶ | −3.0 | 4.2 | NS | NS | 1.0 | 5.1 | ‡ | −1.7 | 5.7 | NS | ¶ | −3.5 | 4.2 | NS | # |
| Tb | −6.5 | 4.8 | −2.1 | 5.2 | † | −5.1 | 5.7 | NS | ¶ | −5.2 | 4.6 | NS | NS | −1.0 | 6.8 | ‡ | −3.4 | 7.4 | ∗ | ‖ | −6.2 | 5.6 | NS | ∗∗ |
| Vertical | ||||||||||||||||||||||||
| H | −106.8 | 7.3 | −107.9 | 6.4 | NS | −115.5 | 6.7 | ‡ | ¶ | −110.4 | 5.94 | ∗ | †† | −105.6 | 4.8 | NS | −111.7 | † | † | ¶ | −107.8 | 6.6 | NS | ∗∗ |
| PP1 | −45.2 | 3.3 | −45.3 | 4.4 | NS | −45.3 | 4.7 | NS | NS | −45.4 | 4.25 | NS | NS | −44.6 | 3.4 | NS | −45.0 | 3.2 | NS | § | −44.4 | 3.2 | NS | # |
| PP2 | −65.5 | 5.1 | −66.8 | 5.5 | NS | −66.4 | 5.9 | NS | NS | −67.3 | 6.07 | NS | NS | −64.5 | 5.3 | NS | −65.9 | 5.1 | NS | § | −65.4 | 6.3 | NS | NS |
| PP3 | −87.2 | 5.5 | −91.7 | 5.7 | † | −94.8 | 7.9 | ‡ | ¶ | −91.0 | 6.89 | ∗ | †† | −88.3 | 6.2 | NS | −90.2 | 6.8 | ∗ | § | −87.8 | 6.2 | NS | # |
| UV | −67.6 | 4.7 | −68.3 | 4.8 | NS | −68.7 | 5.2 | NS | NS | −68.9 | 5.61 | NS | NS | −66.9 | 4.5 | NS | −67.6 | 4.6 | NS | NS | −67.1 | 5.8 | NS | NS |
| Tb | −88.9 | 5.2 | −92.7 | 5.5 | † | −96.6 | 7.5 | ‡ | ¶ | −92.2 | 6.61 | ∗ | †† | −89.8 | 5.3 | NS | −91.4 | 6.1 | NS | § | −89.1 | 5.5 | NS | # |
Stay updated, free dental videos. Join our Telegram channel
VIDEdental - Online dental courses


