Introduction
The characteristics of patients who seek and accept orthognathic surgery appear to be changing over time but have not been well documented in the 21st century.
Methods
Records for patients who had orthognathic surgery at the University of North Carolina from 1996 to 2000 and from 2006 to 2010 were reviewed to collect data for changes in the prevalence of patients with mandibular deficiency (Class II), maxillary deficiency or mandibular prognathism (Class III), long face, and asymmetry problems. The changes were compared with those in previous time periods and at other locations.
Results
Between 1996 and 2000 and between 2006 and 2010, the percentage of Class III patients increased from 35% to 54%, and the percentage of Class II patients decreased from 59% to 41%, while the percentages for long face and asymmetry showed little change. The decrease in Class II patients was accentuation of a long-term trend; the increase in Class III patients occurred only after the turn of the century.
Conclusions
A similar but less-marked change has been noted at some but not all other locations in the United States. It appears to be related primarily to an increase in the numbers of African Americans, Native Americans, Hispanics, and Asians who now are seeking surgical treatment, but it also has been affected by changes in where orthognathic surgery is performed, decisions by third-party payers (insurance and Medicaid) about coverage for treatment, and the availability of nonsurgical orthodontic treatment options for Class II patients.
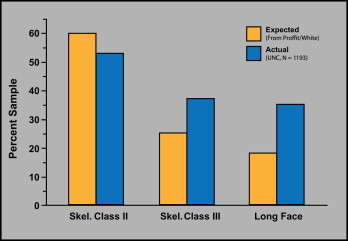
The characteristics of patients who seek evaluation for dentofacial problems that might require orthognathic surgery for effective treatment, and the characteristics of those who accept surgery, are needed in planning the management of this patient group. Using data from the National Center for Health Statistics that were published in the 1970s, we evaluated the number of patients who would be expected to need surgical-orthodontic treatment based on the severity of their malocclusion and compared this with the percentage who sought treatment by making appointments for evaluation in the Dentofacial Clinic at the University of North Carolina ( Fig 1 ). We estimated that the most severe 5% of all Class II patients and the most severe 33% of Class III patients were potential candidates for orthognathic surgery. It was particularly difficult to determine treatment needs for long-face patients from the data for open-bite prevalence, because although two thirds of this group had an anterior open bite, a third did not. The prevalence of long-face problems was calculated by assuming that an open bite greater than 3 mm indicates a skeletal long-face problem; we hoped that false negatives (long face but no open bite) would be balanced by false positives (open bite but normal face height) and estimated that 25% of this group would need surgery. By using these estimates, the data showed that patients with Class II malocclusion were underrepresented in the group seeking treatment, whereas Class III patients were modestly overrepresented, and open-bite patients were greatly overrepresented ( Fig 1 ).
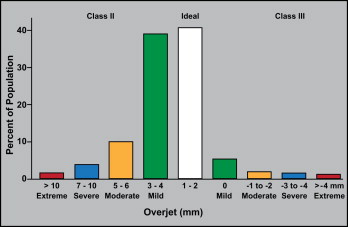
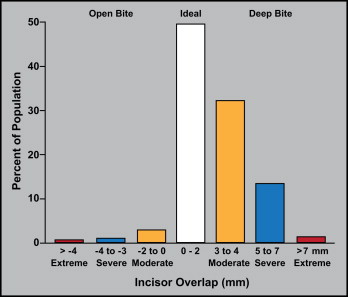
The most recent study of the prevalence of various types of malocclusion in the United States (National Health and Nutrition Examination Survey [NHANES] III, published in the 1990s) provides data for types of malocclusion by severity of the deviations from normal. Figures 2 and 3 , calculated from the NHANES III data, show the prevalence for overjet and incisor overlap, respectively. For both, it is reasonable to expect that essentially all extreme deviations and some severe deviations from ideal relationships would lead to a need for orthognathic surgery. The NHANES data also show that the prevalence of extreme reverse overjet (Class III) is 3 times higher in Asians than in blacks or whites, and twice as great in Hispanics (Mexican Americans). Extreme overjet (Class II) is twice as prevalent in black and Hispanic people as in white people. Extreme open bite (long face) is 7 times more prevalent in African Americans than in whites and is almost never observed in Hispanics. Dental and facial asymmetry were not evaluated in the NHANES III.
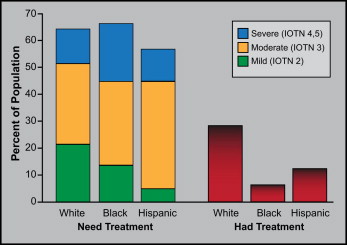
The NHANES III data made it possible to calculate what percentages of the US population would fall into the grades in the index of treatment need (IOTN) that was developed in the United Kingdom in the 1980s to help in the selection of patients for orthodontic treatment in the National Health Service. We did this for the 3 major racial-ethnic groups (white, black, Hispanic [Mexican-American]) that were included in the NHANES III. The prevalence of IOTN grades 4 and 5 (severe) is much greater in blacks than in whites or Hispanics, whereas mild problems (IOTN grade 2) are more frequent in whites than in blacks and much more frequent than in Hispanics ( Fig 4 ). As Figure 4 also shows, from 1989 to 1991, orthodontic treatment was much more likely to be received by white people than either of the other groups. The extent to which that has changed since then has not been documented.
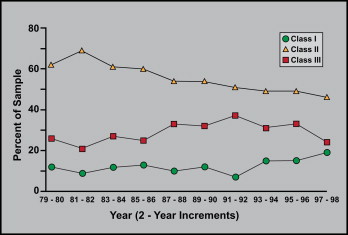
The change in the prevalence of skeletal Class I, Class II, and Class III in the population who sought evaluation in the dentofacial program at the University of North Carolina over a 20-year span up to the mid-1990s is shown in Figure 5 . In this data set, most of the Class I patients were seeking surgical correction of facial asymmetry, but a few long-face patients who had no anteroposterior problem were included. There was a modest but steady decline in Class II patients, with fluctuations but no long-term trend toward change in the prevalence of Class III.
Has the distribution of patients seeking and receiving surgical treatment changed since the turn of the 21st century? Our clinical impression was that both the number and proportion of Class III patients have greatly increased; to evaluate this, we compared the characteristics of surgery patients at the University of North Carolina in 1996 through 2000 with those in 2006 through 2010.
Material and methods
The database for our dentofacial program includes all patients who were referred for evaluation through the Dentofacial Clinic, and all patients who had orthognathic surgery here, whether or not their initial evaluation was here. For this study, the primary source was data for the patients who actually had surgery, not those who were evaluated as potential surgery patients. Records for all patients who had surgery between 1996 and 2000 and between 2006 and 2010 were reviewed to confirm the jaw movements at surgery, because this sometimes changes from the pretreatment plan. The 2 periods 10 years apart were selected to sharpen the contrast between them. About half of the patients for whom a surgical plan was recommended did not have the surgery. A major reason for not accepting treatment was difficulty in obtaining approval for health insurance coverage for surgery and hospitalization.
Patients who had mandibular advancement with or without other surgical procedures were the Class II group, and those who had maxillary advancement, mandibular setback, or a combination of these procedures were the Class III group. The Class II and Class III groups were mutually exclusive. Patients who had the maxilla moved up more than 2 mm, alone or combined with other directions of maxillary repositioning or with mandibular surgery, were the long-face group, and those who had maxillary or mandibular surgery to correct asymmetry were the asymmetry group. These groups did overlap with the Class II and Class III groups and with each other.
Results
Sex, racial or ethnic, and age characteristics of the 2 sample groups are shown in the Table . In both periods, most of the patients were white, but this decreased from 88% in 1996 to 2000 to 76% in 2006 to 2010. The percentage of African Americans nearly doubled, from 6% to 11%, but because the 2010 US census showed that they comprise 22% of the population of North Carolina, they still are underrepresented. The number of Hispanic patients increased from 1% to 3%, coming closer to their percentage of the state population (8.4%), but they also remain underrepresented. Interestingly, the percentage of Asian patients grew to parity with their prevalence in the state population (2.2%), whereas the increase in the number of Native Americans who had surgery made them slightly overrepresented relative to their prevalence in the population of North Carolina at large (1.3% in 2010).
| 1996-2000 | 2006-2010 | |||
|---|---|---|---|---|
| n | % | n | % | |
| Gender | 304 | 564 | ||
| Female | 196 | 64 | 352 | 62 |
| Race/ethnicity | 283 | 557 | ||
| White | 246 | 87 | 422 | 76 |
| African American | 18 | 6 | 62 | 11 |
| Hispanic | 3 | 1 | 14 | 3 |
| Native American | 1 | 0.4 | 14 | 3 |
| Asian | 1 | 0.4 | 13 | 2 |
| Other | 14 | 5 | 32 | 6 |
| Age | ||||
| Mean/SD (y) | 23.6 ± 10.9 | 22.2 ± 9.1 | ||
| Range (y) | 12-73 | 11-58 | ||
Stay updated, free dental videos. Join our Telegram channel
VIDEdental - Online dental courses


