Introduction
The goals of this study were to investigate differences between the most popular female and male faces, past and present, and to determine whether they had changed over time and, if so, to what extent.
Methods
Internet film databases were searched for photographs of men and women who were considered attractive between 1940 and 2008. Images meeting defined inclusion criteria were compared. Measurements were taken on a minimum of 20 images per sex per decade. Intersex facial differences were grouped by decades, and we examined whether these differences remained stable or whether and how they changed over time.
Results
The women had fuller and more protrusive lip profiles than did the men, particularly during the first decade of the 21st century. Significant sex-specific developments were noted over time with respect to chin lengths, frontonasal angles, and total face angles. The men had decreases in chin size and length, but a small opposite trend was observed in the women’s faces. During the observation period, female and male faces considered highly attractive became slightly more similar in terms of chin position and size.
Conclusions
Notions of facial attractiveness might be influenced by developments in society.
There is agreement in the dental literature that people are born with a shared notion of an “ideal” face. Beautiful female faces are symmetrical and have a child-like quality, but at the same time they look mature and expressive. Attractive male faces are also symmetrical, but there is controversy about what features make a man’s face extremely attractive. Women’s judgments are greatly influenced by menstruation cycles and circumstances of their lives.
We know today that the perception of an “ideal” face changes over time and is influenced by current fashions. Auger and Turley and Nguyen and Turley analyzed fashion magazines published in the 20th century and found that both female and male profiles changed significantly over time. More recent issues of the magazines included male and female faces with considerably fuller and more protrusive lip profiles.
Just as the roles of women and men in society have changed, the notions of ideal beauty have also changed for both sexes. Today, women and men have increasingly similar roles, and, particularly in professional society, the equality of the sexes continues to evolve. This raises the question whether these changing roles are reflected in the perceived attractiveness of faces.
The purpose of this study was to identify any intersex differences between faces considered beautiful and attractive 70 years ago. Another objective was to analyze whether these differences still exist today or whether they have changed, and, if so, what are these changes.
Material and methods
Internet film databases were searched for photographs of men and women considered attractive between 1940 and 2008 ( Table I ). This approach was selected because databases of this type specialize in depicting high-profile people universally admired for their attractiveness. A total of 400 images were selected (200 of men, 200 of women). The images met the following inclusion criteria: (1) white people of both sexes at estimated ages between 16 and 40 years, (2) only 1 line of the philtrum visible, (3) no shadow on or beneath the profile, (4) lips closed and at rest, and (5) lateral view showing the entire head from glabella to menton.
These profile photographs were downloaded from the Internet and grouped by decades. At least 20 images were available per sex per decade. To facilitate comparison, all images were oriented parallel to the Frankfort plane by using Computer Forum software (Computer Forum GmbH, Elmshorn, Germany). Moreover, the images were standardized for size to a distance of 35 mm between soft-tissue nasion and subnasale.
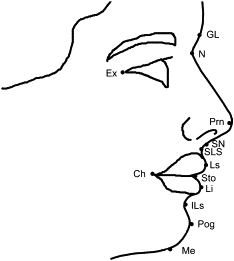
These facial landmarks were identified for the linear, angular, and proportional measurements ( Fig 1 ).
- 1.
Glabella (GL), the most prominent central point between the eyebrows (corresponds to the bony glabella).
- 2.
Nasion (N), the midpoint of nasal root and nasofrontal suture, always located above the line connecting both inner canthi (corresponds to the bony nasion).
- 3.
Pronasale (Prn), the most anterior point of the nose tip as seen laterally.
- 4.
Subnasale (SN), the midpoint of the columellar base angle, located where the lower margin of the nasal septum meets the upper segment of the upper lip. It is not identical to either the bony point of the anterior nasal spine or A-point.
- 5.
Superior labial sulcus (SLS), the deepest midpoint of the upper lip, normally located midway between SN and Ls.
- 6.
Labrale superius (Ls), the midpoint of the upper lip vermilion.
- 7.
Stomion (Sto), the intersection between the vertical facial midline and a horizontal drawn through the closed lips with the teeth in natural occlusion.
- 8.
Labrale inferius (Li), the midpoint of the lower lip vermilion.
- 9.
Inferior labial sulcus (ILS), the midpoint of the supramental fold, at the transition from the lower lip margin to the upper margin of the chin.
- 10.
Pogonion (Pog), the most anterior midpoint of the chin, located on the soft tissue directly above the bony pogonion.
- 11.
Menton (Me), the lowest midpoint of the mandibular lower margin (corresponds to the bony menton).
- 12.
Cheilion (Ch), the lateral corner of the mouth.
- 13.
Exocanthion (Ex), the outer canthus.

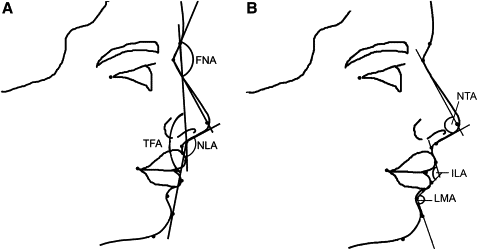
The angular measurements were the following ( Fig 2 ).
- 1.
Frontonasal angle (FNA), the angle between the GL-N and N-Prn lines.
- 2.
Nasolabial angle (NLA), the angle between the SN-Ls line and the SN to columella tangent.
- 3.
Total face angle (TFA), the angle between the GL-SN and SN-Pog lines.
- 4.
Nose tip angle (NTA), the angle between the N-Prn line and the SN to columella tangent.
- 5.
Interlabial angle (ILA), the angle between the SLS-Ls and the Li-ILS lines.
- 6.
Labiomental angle (LMA), the angle between the Li-ILS and the ILS-Pog lines.
-
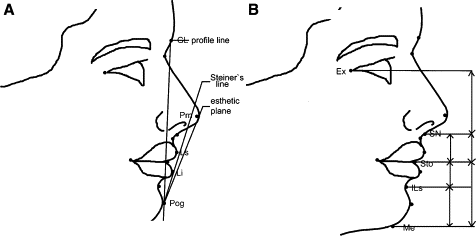
The linear measurements were the following ( Fig 3 ).

Fig 3 A , Linear measurements: distance from labrale superius (Ls) and labrale inferius (Li) to profile line, Steiner’s line, and esthetic plane. B, Linear measurements: length of upper lip (SN-Sto), length of lower lip (Sto-ILS), chin length (ILS-Me), height of upper face (Ex-SN), height of middle face (SN-Sto), height of lower face (Sto-Me). - 7.
Distance from Ls to GL-Pog.
- 8.
Distance from Li to GL-Pog.
- 9.
Distance from Ls to Steiner’s line (columella-Pog).
- 10.
Distance from Li to Steiner’s line (columella-Pog).
- 11.
Distance from Ls to Prn-Pog.
- 12.
Distance from Li to Prn-Pog.
- 13.
Length of lower lip (Sto-ILS).
- 14.
Length of chin (ILS-Me).
- 15.
Height of upper face (Ex-SN).
- 16.
Height of middle face (SN-Sto).
- 17.
Height of lower face (Sto-Me).

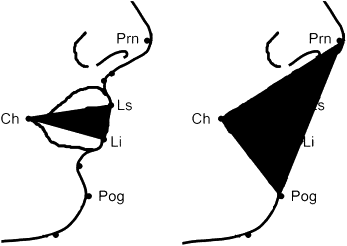
Surface area measurements were the following ( Fig 4 ).
- 18.
Lip area (Ch-Ls-Li).
- 19.
Profile area (Ch-Pog-Prn).

The proportional measurement was the folloing ( Fig 4 ).
- 20.
Ratio of profile area to lip area, Ch-Pog-Prn: Ch-Ls-Li.
Statistical analysis
For each of the 20 parameters, we performed an analysis of variance (ANOVA) with the factors sex and decade, with the interaction of these factors. For each of the 7 decades, we compared the sexes with post-hoc t tests, resulting in 161 P values. Because of multiple testing, we adjusted the level of significance according to the method of Bonferroni-Holm. All results are presented as mean values with their 95% CI.
To describe trends in the variables over time, we fitted straight lines for men and women separately. We tested whether the slopes differed from zero, and whether they differed between the sexes.
Results
The results of the statistical analysis for describing the intersex trends in the variables over time are given in Table II . The FNA ( P = 0.0156), the NLA ( P = 0.0050), and the Ch-Pog-Orn:Ch-Ls-Li ( P = 0.0225) of women changed significantly with time. Among the variables of men, the FNA ( P <0.0001), the LMA ( P = 0.0074), and the distances from Ls to GL-Pog ( P = 0.0245) and Sto-ILS ( P = 0.0492) changed significantly with time.
| Variable | Minimum | Maximum | Mean | SD | Slope | P value |
|---|---|---|---|---|---|---|
| Women | ||||||
| FNA (°) | 116.5 | 164.1 | 140.6 | 7.2 | 0.0646 | 0.0156 ∗ |
| NTA (°) | 60 | 103.8 | 82.6 | 7.8 | −0.0196 | 0.5006 |
| NLA (°) | 83.9 | 136.4 | 105.6 | 10.3 | −0.1066 | 0.0050 † |
| ILA (°) | 77.5 | 166.6 | 122.1 | 16.3 | −0.0955 | 0.1150 |
| TFA (°) | 160.5 | 179.4 | 169.2 | 4.4 | 0.0260 | 0.1147 |
| LMA (°) | 73.2 | 166.1 | 126.9 | 14.6 | 0.0763 | 0.1615 |
| Ls profile line (mm) | 0.9 | 8.5 | 5.0 | 1.6 | 0.0005 | 0.9358 |
| Li profile line (mm) | −1 | 6.3 | 2.8 | 1.3 | −0.0019 | 0.6923 |
| Ls Steiner’s line (mm) | −4.6 | 0 | −1.5 | 1.1 | −0.0045 | 0.2500 |
| Li Steiner’s line (mm) | −3.4 | 2.7 | −0.0 | 1.3 | 0.0010 | 0.8428 |
| Ls esthetic plane (mm) | −6.2 | 0.6 | −2.9 | 1.3 | 0.0004 | 0.9372 |
| Li esthetic plane (mm) | −4.1 | 2.3 | −0.7 | 1.4 | 0.0039 | 0.4382 |
| Sto-ILS (mm) | 7.6 | 16.9 | 11.3 | 1.6 | 0.0080 | 0.1683 |
| ILS-Me (mm) | 15.4 | 29.8 | 20.4 | 2.5 | 0.0104 | 0.2617 |
| Ex-SN (mm) | 28.1 | 50.3 | 38.0 | 4.6 | 0.0068 | 0.6907 |
| SN-Sto (mm) | 10.8 | 22.9 | 15.8 | 1.9 | −0.0064 | 0.3622 |
| Sto-Me (mm) | 26 | 43.2 | 31.4 | 3.1 | 0.0162 | 0.1548 |
| Ch-Ls-Li (mm) | 36.6 | 164.4 | 81.1 | 25.6 | 0.1724 | 0.0699 |
| Ch-Pog-Prn (mm) | 136.7 | 553.5 | 287.5 | 76.8 | 0.0465 | 0.8713 |
| Ch-Pog-Prn:Ch-Ls-Li | 205.8 | 580.1 | 366.3 | 73.5 | −0.6220 | 0.0225 ∗ |
| Men | ||||||
| FNA (°) | 113.7 | 161.9 | 140.5 | 9.5 | 0.2253 | <0.0001 ‡ |
| NTA (°) | 55 | 103.3 | 77.3 | 8.6 | −0.0054 | 0.8679 |
| NLA (°) | 72.9 | 129.7 | 104.0 | 11.2 | −0.0007 | 0.9872 |
| ILA (°) | 72.6 | 163 | 130.0 | 15.6 | 0.0275 | 0.6389 |
| TFA (°) | 155.9 | 179.7 | 169.2 | 5.3 | −0.0356 | 0.0705 |
| LMA (°) | 90.9 | 168.8 | 124.9 | 15.4 | 0.1534 | 0.0074 † |
| Ls profile line (mm) | −1.2 | 9.4 | 4.4 | 1.7 | 0.0141 | 0.0245 ∗ |
| Li profile line (mm) | −0.9 | 6.6 | 2.7 | 1.5 | 0.0092 | 0.1027 |
| Ls Steiner’s line (mm) | −5.6 | 0 | −2.0 | 1.1 | −0.0052 | 0.2293 |
| Li Steiner’s line (mm) | −3.8 | 2.8 | −0.6 | 1.3 | 0.0035 | 0.4826 |
| Ls esthetic plane (mm) | −7.9 | −0.3 | −3.6 | 1.4 | 0.0063 | 0.2183 |
| Li esthetic plane (mm) | −4.7 | 2.3 | −1.5 | 1.4 | 0.0099 | 0.0642 |
| Sto-ILS (mm) | 7 | 16.3 | 11.6 | 1.7 | 0.0127 | 0.0492 ∗ |
| ILS-Me (mm) | 9.3 | 28.8 | 21.1 | 2.9 | −0.0205 | 0.0607 |
| Ex-SN (mm) | 25.1 | 53 | 38.5 | 4.6 | 0.0005 | 0.9785 |
| SN-Sto (mm) | 10.7 | 20.8 | 16.1 | 2.0 | −0.0070 | 0.3492 |
| Sto-Me (mm) | 19.9 | 42.5 | 32.6 | 3.5 | −0.0081 | 0.5374 |
| Ch-Ls-Li (mm) | 28.8 | 164.8 | 67.5 | 23.3 | 0.0127 | 0.8844 |
| Ch-Pog-Prn (mm) | 151.6 | 575.1 | 297.4 | 77.1 | −0.3493 | 0.2268 |
| Ch-Pog-Prn:Ch-Ls-Li | 252.5 | 732.4 | 462.4 | 103.4 | −0.5418 | 0.1620 |
In Table III , the results for differences in the development slopes between the sexes are shown. Only for changes of the variables ILS-Me, TFA, and FNA, during the study period, was a significant difference between men and women detectable.
| Variable | Difference of slopes | P value |
|---|---|---|
| FNA (°) | −0.161 | 0.0001 † |
| NTA (°) | −0.014 | 0.7431 |
| NLA (°) | −0.106 | 0.0616 |
| ILA (°) | −0.123 | 0.1438 |
| TFA (°) | 0.062 | 0.0166 ∗ |
| LMA (°) | −0.077 | 0.3267 |
| Ls profile line (mm) | −0.014 | 0.1127 |
| Li profile line (mm) | −0.011 | 0.1341 |
| Ls Steiner’s line (mm) | 0.001 | 0.9149 |
| Li Steiner’s line (mm) | −0.003 | 0.7127 |
| Ls esthetic plane (mm) | −0.006 | 0.4023 |
| Li esthetic plane (mm) | −0.006 | 0.4187 |
| Sto-ILS (mm) | −0.005 | 0.5879 |
| ILS-Me (mm) | 0.031 | 0.0313 ∗ |
| Ex-SN (mm) | 0.006 | 0.7934 |
| SN-Sto (mm) | 0.001 | 0.9508 |
| Sto-Me (mm) | 0.024 | 0.1622 |
| Ch-Ls-Li (mm) | 0.160 | 0.2154 |
| Ch-Pog-Prn (mm) | 0.396 | 0.3305 |
| Ch-Pog-Prn:Ch-Ls-Li | −0.080 | 0.8657 |
Six parameters were found with statistically significant intersex differences, after adjusting for multiple tests ( Table IV ).
| Decade | Subjects | Ch-Pog-Prn:Ch-Ls-Li | Ch-Ls-Li (mm 2 ) | ILA (°) | Sto-Me (mm) | Ls-esthetic (mm) | NTA (°) |
|---|---|---|---|---|---|---|---|
| 1940 | Women | 3.89 † (3.51-4.28) | 79 (68-89) | 127 (120-134) | 31 (30-32) | −3.2 (–3.8-−2.6) | 79 (75-82) |
| Men | 5.06 † (4.66-5.45) | 67 (56-77) | 130 (123-137) | 32 (31-34) | −4.1 (–4.7-−3.5) | 78 (75-82) | |
| 1950 | Women | 3.77 † (3.42-4.12) | 79 (69-88) | 128 (122-134) | 31 (30-33) | −3 (−3.5-−2.5) | 86 (83-89) |
| Men | 4.87 † (4.50-5.24) | 60 (50-70) | 130 (123-136) | 32 (30-33) | −3.7 (−4.2-−3.1) | 78 (75-82) | |
| 1960 | Women | 3.56 ∗ (3.17-3.95) | 74 (64-85) | 120 (113-126) | 30 ∗ (28-31) | −2.2 (−2.8-−1.6) | 85 (81-88) |
| Men | 4.51 ∗ (4.19-4.84) | 69 (60-78) | 128 (123-134) | 33 ∗ (32-35) | −3.6 (−4.0-−3.1) | 78 (75-81) | |
| 1970 | Women | 3.82 (3.43-4.20) | 77 (66-87) | 114 ∗ (108-121) | 32 (31-34) | −2.7 (−3.3-−2.1) | 84 (81-88) |
| Men | 4.45 (4.08-4.81) | 72 (62-82) | 133 ∗ (126-139) | 34 (33-36) | −3.5 (−4.1-−3) | 75 ∗ (72-79) | |
| 1980 | Women | 3.73 (3.35-4.10) | 86 (76-96) | 122 (115-128) | 31 (30-33) | −3 (−3.6-−2.5) | 80 (77-84) |
| Men | 4.29 (3.95-4.63) | 75 (65-84) | 125 (119-131) | 33 (32-34) | −3.3 (−3.8-−2.8) | 76 (73-79) | |
| 1990 | Women | 3.59 † (3.28-3.91) | 81 (73-90) | 123 (117-128) | 32 (31-33) | −2.9 ∗ (−3.4-−2.4) | 83 (80-85) |
| Men | 4.66 † (4.35-4.98) | 69 (60-77) | 133 (128-139) | 32 (31-33) | −4.1 ∗ (−4.6-−3.7) | 76 (73-78) | |
| 2000 | Women | 3.40 † (3.09-3.72) | 89 † (80-97) | 120 (115-126) | 32 (30-33) | −2.9 (−3.4-−2.5) | 81 (79-84) |
| Men | 4.64 † (4.32-4.97) | 61 † (53-70) | 131 (125-136) | 32 (31-33) | −3.2 (−3.6-−2.7) | 80 (77-83) |
Stay updated, free dental videos. Join our Telegram channel

VIDEdental - Online dental courses


