Introduction
The purpose of this research was to investigate relationships among the location and orientation of palatally displaced canines and the dimension and orientation of the maxillary lateral incisor.
Methods
An experimental group of 40 patients with 46 palatally displaced canines (20 from boys, 26 from girls; mean age of the subjects, 13.9 years; age range, 10.5-15.9 years) was selected from the records of patients referred to a radiology practice specializing in cone-beam volumetric tomography imaging. This group was age- and sex-matched with 30 normal subjects with 60 canines (26 from boys, 34 from girls; mean age of the subjects, 13.8 years; age range, 10.4-15.7 years). Digital cone-beam volumetric tomography images were imported into an imaging software and were reoriented and reconstructed into several radiographic images in coronal and sagittal sections; a maxillary arch occlusal view was also produced. The angular and linear variables of the canines and the maxillary lateral incisors were measured by using software measurement tools. Independent t tests or Mann-Whitney U tests were used accordingly based on normality of the data to compare the variables between the palatally displaced canine and the control groups. Multiple linear regressions were used to examine the relationships between the canine variables (dependent variables) and the maxillary lateral incisor variables together with confounding variables (independent variables).
Results
The maxillary lateral incisors in the palatally displaced canine group tended to be more upright in the sagittal and coronal planes. Generally, the most significant independent variables according to backward examination of linear regression for canine variables (coronal and sagittal angulations, and distance to the occlusal plane of palatally displaced canines) were the coronal and sagittal angulations of the maxillary lateral incisors, the length and buccolingual root width of the maxillary lateral incisors, and age.
Conclusions
The orientation and location of palatally displaced canines were associated with changes in the angulations of maxillary lateral incisors and small lateral incisors.
Palatally displaced canines have been found to be an autosomal dominant trait with low penetrance and variable expressivity; environmental factors might also play an important role in the etiology of impacted canines. The guidance theory has been advocated to explain the cause of palatally displaced canines, proposing that the palatal displacement of the canines was caused by genetically determined anomalies that caused an environmentally generated alteration in the eruption pattern of the canines.
The distally tipped lateral incisor is a normal feature during the “ugly duckling stage.” Authors of a longitudinal study concluded that distal tipping together with proclination of the lateral incisor might indicate a buccal ectopic canine eruption, but distal tipping alone should not be an indication of canine eruption disturbances. Another study described how a palatally displaced canine might press on the root of the lateral incisor and push the root labially while the crown swings palatally. It was even suggested that palatally displaced canines can cause distal crown tipping of the lateral incisors as well as rotation.
No study has previously investigated the relationships of the location and orientation of palatally displaced canines with the dimension and orientation of the maxillary lateral incisors. The aim of this study was to investigate the relationships between the variables of palatally displaced canines and maxillary lateral incisors together with confounding variables. The null hypothesis was that no relationship exists between these variables.
Material and methods
An experimental group (palatally displaced canines group) of 40 patients with 46 palatally displaced canines (20 from boys, 26 from girls), in the age range 10 to 15.9 years (mean ages were 13.9 years for boys, 13.8 years for girls, and 13.9 years overall), was selected from the records of patients referred to a radiology practice specializing in cone-beam volumetric tomography imaging. The palatally displaced canine group was age- and sex-matched with a control group comprising 30 normal subjects with 60 canines (26 from boys, 34 from girls; mean ages were 13.8 years for boys, 13.8 years for girls, and 13.8 years overall).
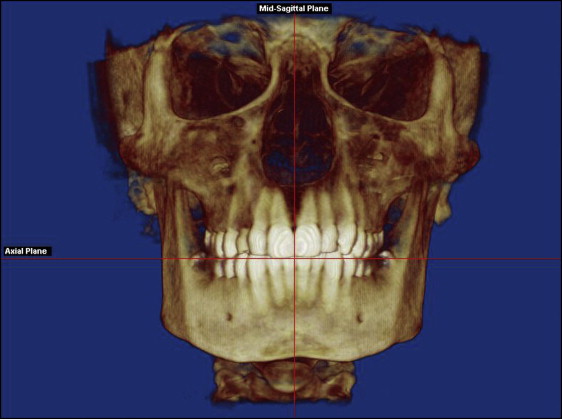
The cone-beam volumetric tomography digital imaging and communications in medicine (DICOM) files were imported into Dolphin Imaging software (version 11.0; Dolphin Imaging & Management Solutions, Chatsworth, Calif). The volumetric image was reoriented as if the head was looking straight out of the computer screen (with the facial sagittal plane perpendicular to the computer screen), with the occlusal plane horizontal, touching the incisal edge of the maxillary central incisors and the mesiobuccal cusp tips of the maxillary first molars ( Fig 1 ). Radiographic images of the canine and the lateral incisor in the coronal and sagittal sections were reconstructed from the volumetric image, and a maxillary arch occlusal view was also produced.
The mesiodistal position of the canine cusp tip, the vertical position of the canine cusp tip, the severity of lateral incisor resorption, the lateral incisor length (Lat_Lgth), the buccolingual width at the cementoenamel junction (CEJ) level (BL_CEJ), the buccolingual width at 4 mm apical to the CEJ level (BL_CEJ4), the buccolingual width at 8 mm apical to the CEJ level (BL_CEL8), the mesiodistal width at the CEJ level (MD_CEJ), the mesiodistal width at 4 mm apical to the CEJ level (MD_CEJ4), and the mesiodistal width at 8 mm apical to the CEJ level (MD_CEJ8) of the maxillary lateral incisor were acquired as described previously. The average of MD_CEJ, MD_CEJ4, and MD_CEJ8 was calculated as MD_Ave, and the average of BL_CEJ, BL_CEJ4, and BL_CEJ8 was calculated as BL_Ave, to allow the multiple linear regression analysis as discussed below.
The angular and linear measurements were made with the Dolphin measurement tools with precision values of 0.1° and 0.1 mm, respectively. The images were magnified by 400% to allow a better view, yet not to produce blurred outlines or pixelated objects.
Measurements of the canine variables were carried out as follows.
- 1.
The sagittal angulation of the canine was measured relative to a vertical line that was perpendicular to the occlusal plane on the reconstructed sagittal radiographic image ( Fig 2 ). The coronal angulation of the canine was measured relative to a facial midline that was also perpendicular to the occlusal plane on the reconstructed coronal radiographic image ( Fig 3 ). The angle values were recorded as positive if the crown was tipping mesially in the sagittal view or buccally in the coronal view, and as negative if the crown was tipping distally or palatally.
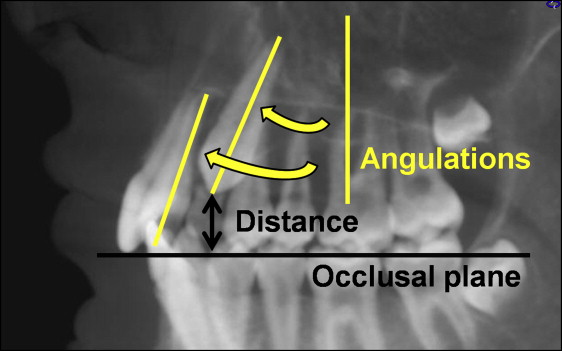
Fig 2 Angulation of the canine and the lateral incisor (relative to the vertical line ) in the sagittal view, and distance of the canine cusp tip to the occlusal plane.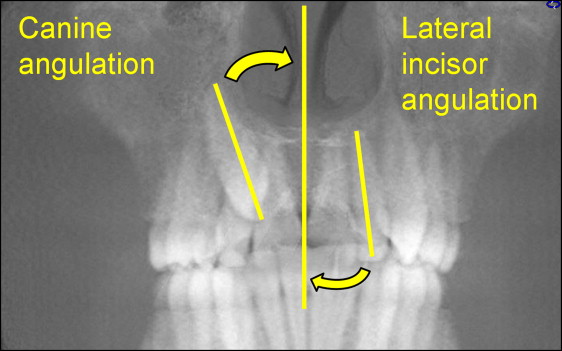
Fig 3 Angulation of the canine and the lateral incisor (relative to the midline ) in the coronal view. - 2.
The distance of the canine cusp tip was measured perpendicularly to the occlusal plane ( Fig 2 ). The distance was recorded as 0 if the canine had fully erupted and no negative value was recorded.
Measurements of the lateral incisor variables were carried out as follows.
- 1.
The sagittal and coronal angulations of the lateral incisor were measured similarly to those for the canines ( Figs 2 and 3 ).
- 2.
The rotation of the lateral incisor was measured relative to a palatal midline that was parallel to the midsagittal plane of the face on the maxillary arch occlusal view image ( Fig 4 ). The rotational angle was recorded with the value starting from 0° (with a tangent to the buccal crown surface parallel to the palatal midline), and the value was increasing (positive) as the crown was rotating distobuccally or decreasing (negative) as the crown was rotating distopalatally.
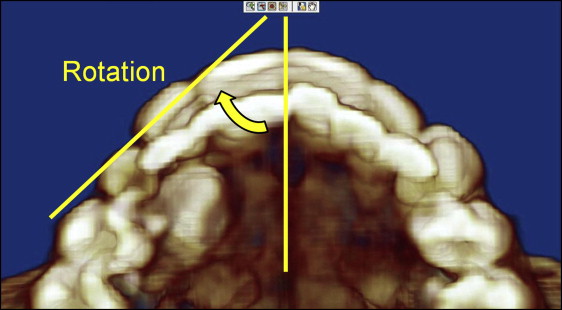
Fig 4 Rotation of the lateral incisor (relative to the midline ) in the occlusal view. - 3.
The tooth lengths and widths of the lateral incisors were acquired as described previously.
Statistical analysis
All measurements were made by 1 investigator (I.W.L.). A pilot study comprising 16 subjects with 20 palatally displaced canines, matched to 10 normal subjects with 20 control canines was conducted. Since the sample size of the pilot study was too small to do an a priori power analysis for running a multiple linear regression, a post hoc power analysis was used to examine the power of the data. Power analysis was carried out by using G*Power 3 software.
Statistical analysis was performed with the SPSS Statistics Standard GradPack (version 19.0; IBM, Armonk, NY). The measurement data were analyzed for normality by using a normal probability plot and the Shapiro-Wilks test. Independent t tests and Mann-Whitney U tests were used accordingly to compare the palatally displaced canine and control groups. A significance level of 0.005 was used to account for multiple comparisons. A linear regression with backward examination was conducted to look for the most significant independent variables for each canine variable (Can_Sag, Can_Cor, Can_Occl).
Fifteen independent variables (MDsect [mesiodistal position of the canine cusp tip], Vzone [vertical position of the canine cusp tip], Lat_Sag, Lat_Cor, Lat_Rot, Lat_Lgth, MD_CEJ, BL_CEJ, MD_CEJ4, BL_CEJ4, MD_CEJ8, BL_CEJ8, age, sex, and resorption) were included in the initial analysis. Because of the great colinearity between the variables and the large number of variables considered, a principal component analysis was used to analyze the relationships between the variables. After variable reduction procedures, multiple linear regressions were used to analyze the relationship between the canine variables and the lateral incisor variables, taking account the confounding variables.
Linear regressions were used in this study rather than analyses with correlation matrices with bivariate correlations because of the multiple independent variables and also the correlation between the independent variables and the involvement of confounding variables. Since the variables MDsect and Vzone were not independent from the canine variables Can_Sag, Can_Cor, and Can_Occl, they were not included in the regression analysis.
Results
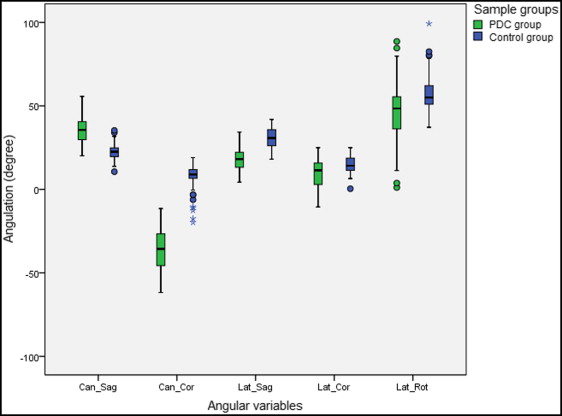
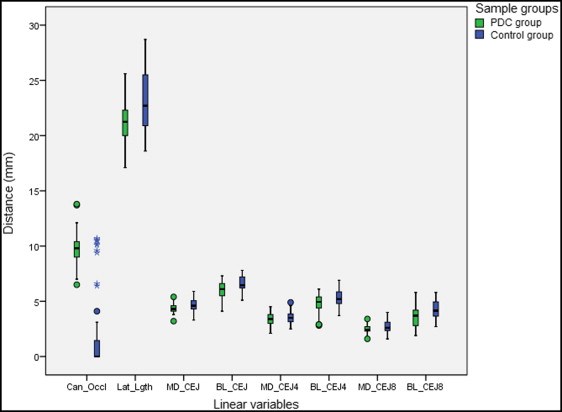
A post hoc power analysis was carried out to examine the linear regression on the sagittal angulation of the canine, and it was found that the power was 82.2%. We analyzed 46 palatally displaced canines and 60 control canines in this study. All data were normally distributed, except for those of the coronal angulation of the canine and the distance of the canine cusp tip to the occlusal plane from the control group. Thirteen canine and lateral incisor variables were compared between the palatally displaced canine and the control groups ( Figs 5 and 6 ) with independent t tests (assuming unequal variance) and Mann-Whitney U tests accordingly ( Table I ). The canine variables between the 2 groups were significantly different ( P <0.001). Also, the lateral incisor variables between the 2 groups were significantly different ( P <0.005), except for the mesiodistal width at 4 mm apical to the CEJ level ( P >0.05), whereas the mesiodistal width at 8 mm apical to the CEJ level and the average of the mesiodistal widths at the 3 levels were borderline significant ( P <0.05).
| Variable | PDC group (n = 46) | Control group (n = 60) | Mean difference | t test P value | Mann-Whitney U test P value | ||
|---|---|---|---|---|---|---|---|
| Mean | SD | Mean | SD | ||||
| Can_Sag (°) | 36.0 | 8.7 | 22.7 | 4.5 | 13.3 | <0.001 † | <0.001 † |
| Can_Cor (°) | −35.5 | 13.1 | 7.1 | 8.1 | −42.6 | <0.001 † | <0.001 † |
| Can_Occl (mm) | 9.8 | 1.5 | 1.8 | 3.6 | 8.0 | <0.001 † | <0.001 † |
| Lat_Sag (°) | 17.7 | 6.6 | 30.9 | 5.7 | −13.2 | <0.001 † | <0.001 † |
| Lat_Cor (°) | 9.8 | 8.7 | 14.8 | 4.6 | −5.0 | 0.001 † | 0.003 † |
| Lat_Rot (°) | 45.3 | 19.8 | 57.1 | 12.3 | −11.7 | 0.001 † | <0.001 † |
| Lat_Lgth (mm) | 21.3 | 1.8 | 23.3 | 2.7 | −2.1 | <0.001 † | <0.001 † |
| MD_CEJ (mm) | 4.3 | 0.4 | 4.6 | 0.6 | −0.3 | 0.004 † | 0.003 † |
| MD_CEJ4 (mm) | 3.4 | 0.5 | 3.5 | 0.5 | −0.1 | 0.228 | 0.341 |
| MD_CEJ8 (mm) | 2.5 | 0.4 | 2.7 | 0.5 | −0.2 | 0.013 ∗ | 0.024 ∗ |
| MD_Ave (mm) | 3.4 | 0.4 | 3.6 | 0.5 | −0.2 | 0.016 ∗ | 0.041 ∗ |
| BL_CEJ (mm) | 5.9 | 0.8 | 6.6 | 0.6 | −0.7 | <0.001 † | <0.001 † |
| BL_CEJ4 (mm) | 4.8 | 0.9 | 5.4 | 0.8 | −0.6 | <0.001 † | 0.003 † |
| BL_CEJ8 (mm) | 3.6 | 0.9 | 4.3 | 0.8 | −0.7 | <0.001 † | 0.001 † |
| BL_Ave (mm) | 4.8 | 0.8 | 5.4 | 0.7 | −0.7 | <0.001 † | 0.001 † |
In this study, the maxillary lateral incisors in the palatally displaced canine group tended to be more upright in the sagittal ( P <0.005) and coronal ( P <0.001) planes, and more mesiolabially rotated ( P <0.005) compared with the control group. The means in the palatally displaced canine group were 17.7° for the sagittal angulation of the lateral incisor, 9.8° for the coronal angulation of the lateral incisor, and 45.3° for the rotation of the lateral incisor; the measurements in the control group were 30.9°, 14.8°, and 57.1°, respectively. The mean of the sagittal angulation of the canine in the palatally displaced canine group was 36.0°, and the coronal angulation of the canine was −35.5° (palatally inclined); these measurements in the control group were 22.7° and 7.1°, respectively.
Cohen suggested that the strength of correlation coefficients of 0.10 to 0.29 is small, 0.30 to 0.49 is moderate, and 0.50 to 1.0 is large or high. Patient age was found to be correlated moderately with the mesiodistal position of the canine cusp tip and the vertical position of the canine cusp tip ( Table II ). The sagittal angulation of the canine and the coronal angulation of the canine were highly correlated with each other, and also with the mesiodistal position of the canine cusp tip. The distance of the canine cusp tip to the occlusal plane was moderately correlated with the coronal angulation of the canine and the vertical position of the canine cusp tip. The mesiodistal position of the canine cusp tip did not correlate with either the vertical position of the canine cusp tip or the distance of the canine cusp tip to the occlusal plane. Pearson’s correlations between these variables are presented in Table III .
| Variable | Age | Sex | ||
|---|---|---|---|---|
| Pearson correlation | P value | Pearson correlation | P value | |
| MDsect | 0.400 | 0.006 ∗ | 0.007 | 0.961 |
| Vzone | 0.325 | 0.028 ∗ | −0.165 | 0.272 |
| Variable | Can_Sag | Can_Cor | Can_Occl | MDsect | Vzone | |||||
|---|---|---|---|---|---|---|---|---|---|---|
| Pearson correlation | P value | Pearson correlation | P value | Pearson correlation | P value | Pearson correlation | P value | Pearson correlation | P value | |
| Can_Sag | −0.518 | <0.001 † | 0.251 | 0.093 | 0.548 | <0.001 † | 0.063 | 0.678 | ||
| Can_Cor | −0.518 | <0.001 † | −0.394 | 0.007 ∗ | −0.612 | <0.001 † | −0.271 | 0.069 | ||
| Can_Occl | 0.251 | 0.093 | −0.394 | 0.007 ∗ | 0.244 | 0.102 | 0.438 | 0.002 † | ||
| MDsect | 0.548 | <0.001 † | −0.612 | <0.001 † | 0.244 | 0.102 | 0.207 | 0.169 | ||
| Vzone | 0.063 | 0.678 | −0.271 | 0.069 | 0.438 | 0.002 † | 0.207 | 0.169 | ||
According to the principal component analysis with varimax rotation, some variables actually correlate to each other and are clustered together as shown in the pattern matrix table ( Table IV ). The varimax rotation method was used, since the initial direct quartimin rotation method showed that the correlation coefficients between the components were lower than 0.32 (Tabachnick and Fidell, Pallant ). The variable can be said to load on a given component when the loading factor is 0.32 or greater for that component but not on other components.
| Variable | Component/Total variance explained | |||||
|---|---|---|---|---|---|---|
| 1/30% | 2/14% | 3/12% | 4/8% | 5/7% | 6/6% | |
| BL_CEJ4 | 0.904 ∗ | 0.227 | −0.078 | 0.001 | −0.024 | 0.063 |
| BL_CEJ | 0.884 ∗ | 0.192 | −0.020 | 0.078 | −0.125 | 0.157 |
| Lat_Cor | 0.794 ∗ | −0.152 | −0.131 | −0.227 | 0.096 | −0.096 |
| BL_CEJ8 | 0.762 ∗ | 0.337 ∗ | −0.292 | 0.040 | −0.028 | 0.045 |
| Lat_Rot | −0.543 ∗ | −0.117 | −0.151 | −0.132 | 0.535 ∗ | 0.056 |
| Lat_Lgth | 0.535 ∗ | 0.511 ∗ | −0.178 | −0.200 | 0.206 | 0.010 |
| MD_CEJ4 | 0.194 | 0.914 ∗ | −0.101 | −0.041 | 0.026 | −0.089 |
| MD_CEJ8 | 0.153 | 0.835 ∗ | −0.224 | 0.166 | 0.030 | 0.027 |
| MD_CEJ | 0.105 | 0.800 ∗ | 0.085 | −0.243 | −0.211 | 0.104 |
| Can_Cor | −0.058 | 0.047 | −0.839 ∗ | −0.208 | −0.049 | −0.024 |
| MDsect | −0.317 | −0.103 | 0.762 ∗ | 0.169 | 0.000 | −0.253 |
| Can_Sag | −0.297 | 0.011 | 0.746 ∗ | −0.045 | −0.315 | 0.185 |
| Age | −0.010 | −0.263 | 0.608 ∗ | 0.102 | 0.472 ∗ | 0.087 |
| Vzone | 0.005 | −0.200 | 0.127 | 0.793 ∗ | 0.090 | 0.235 |
| Can_Occl | 0.048 | 0.150 | 0.283 | 0.739 ∗ | −0.306 | −0.020 |
| Lat_Sag | 0.277 | 0.107 | −0.003 | −0.571 ∗ | −0.179 | 0.459 ∗ |
| Sex | 0.079 | 0.597 ∗ | 0.070 | −0.019 | 0.623 ∗ | −0.029 |
| Resorption | −0.020 | 0.014 | −0.011 | −0.106 | −0.051 | −0.895 ∗ |
Stay updated, free dental videos. Join our Telegram channel
VIDEdental - Online dental courses


