Introduction
The purposes of this study were to analyze and compare the immediate effects of rapid and slow maxillary expansion protocols, accomplished by Haas-type palatal expanders activated in different frequencies of activation on the positioning of the maxillary first permanent molars and on the buccal alveolar bones of these teeth with cone-beam computerized tomography.
Methods
The sample consisted of 33 children (18 girls, 15 boys; mean age, 9 years) randomly distributed into 2 groups: rapid maxillary expansion (n = 17) and slow maxillary expansion (n = 16). Patients in the rapid maxillary expansion group received 2 turns of activation (0.4 mm) per day, and those in the slow maxillary expansion group received 2 turns of activation (0.4 mm) per week until 8 mm of expansion was achieved in both groups. Cone-beam computerized tomography images were taken before treatment and after stabilization of the jackscrews. Data were gathered through a standardized analysis of cone-beam computerized tomography images. Intragroup statistical analysis was accomplished with the Wilcoxon matched-pairs test, and intergroup statistical analysis was accomplished with analysis of variance. Linear relationships, among all variables, were determined by Spearman correlation.
Results and Conclusions
Both protocols caused buccal displacement of the maxillary first permanent molars, which had more bodily displacement in the slow maxillary expansion group, whereas more inclination was observed in the rapid maxillary expansion group. Vertical and horizontal bone losses were found in both groups; however, the slow maxillary expansion group had major bone loss. Periodontal modifications in both groups should be carefully considered because of the reduction of spatial resolution in the cone-beam computerized tomography examinations after stabilization of the jackscrews. Modifications in the frequency of activation of the palatal expander might influence the dental and periodontal effects of palatal expansion.
Correction of the maxillary transverse discrepancy is essential for treatment of various types of malocclusions. Palatal expansion is the most common method used to improve the transverse dimensions of the maxilla. Three types of protocol for palatal expansion are shown in the literature: rapid maxillary expansion, slow maxillary expansion, and semirapid maxillary expansion. The latter and its variations have generated less interest in orthodontics compared with the first 2 types, which are evaluated and cited more frequently.
Rapid maxillary expansion is associated with intermittent high-force systems and tooth-tissue-borne appliances (Haas type). Slow maxillary expansion is often associated with continuous low-force systems and quad-helix appliances or coil springs. Interestingly, the combination of Haas-type palatal expanders and slow maxillary expansion (ie, reduction in the frequency of activation of the jackscrew) exists but has been rarely studied. The advantages and disadvantages of each protocol have been analyzed for many years, yet the issue remains unclear and controversial, since different devices and methodologies interfere with the comparisons. Despite the polemic, the literature indicates that both protocols provide maxillary expansion, although slow maxillary expansion has been related to more physiologic effects on sutural tissues, greater tooth movement, and lower orthopedic effects compared with rapid maxillary expansion. Additionally, both rapid and slow maxillary expansion cause lateral flexion of the alveolar processes and buccal displacement of the anchorage teeth with varying degrees of inclination.
Displacement of the teeth outside the alveolar anatomic limits can damage the periodontium, compromising tooth longevity. Few studies concerning a quantitative analysis of periodontal modifications resulting from maxillary expansion have been developed, possibly because of the difficulty of observation of the height and thickness of the alveolar bone on a conventional radiographic examination.
Recently, and because of its numerous advantages over conventional radiography and conventional computerized tomography, cone-beam computerized tomography (CBCT) has been used for quantitative analysis of skeletal, dentoalveolar, and periodontal changes from rapid and slow maxillary expansion. These latter studies indicate that both rapid maxillary expansion and slow maxillary expansion cause buccal bone loss in varying degrees; however, they used different types of appliances and analyzed individually each protocol. The literature lacks simultaneous comparative studies between the 2 protocols, especially comparisons with the same type of appliance and CBCT.
Therefore, the purposes of this study were to quantitatively analyze and compare the immediate effects of rapid and slow maxillary expansion with Haas-type palatal expanders activated at different frequencies on the positions of the maxillary first permanent molars, as well as the modifications of the buccal alveolar bone of these teeth, by using CBCT. The null hypothesis was that the 2 protocols cause similar dental movements and periodontal effects.
Material and methods
The sample was selected in a public school and from orthodontic patients who sought treatment at the Federal University of Santa Catarina in Brazil. All parents or guardians signed the informed consent form, which was duly approved by the ethics committee in human research of the university.
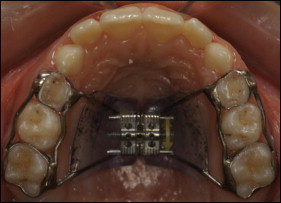
The inclusion criteria were a clinical maxillary transverse deficiency and age between 7 and 10 years (intertransitory period of the mixed dentition). Patients with physical or psychological limitations or metallic restorations in the first permanent molars were excluded. A sample of 59 subjects was selected and randomly divided into 2 groups: rapid maxillary expansion and slow maxillary expansion. All patients used the tooth-tissue-borne palatal expander recommended by Haas ( Fig 1 ). Each appliance included a screw expander with a maximum aperture of 11.0 mm (Dentaurum, Inspringen, Germany) and bands in the first deciduous and first permanent molars. The subjects in both groups had an 8-mm opening of the screw, for a total of 40 activations. With a digital caliper (Ortho-pli, Philadelphia, Pa), we monitored all expansion procedures every 15 days to check the activation protocol. At the end of activation, the devices were stabilized with 0.12-mm ligature wires (Morelli, Sorocaba, Brazil) and maintained as retainers for 5 months in the rapid maxillary expansion group and for 1 month in the slow maxillary expansion group.
Patients who did not correctly follow the protocol of activation, who did not return for control dental appointments, who did not have their final examination within 7 days after screw stabilization, whose cementation of appliance failed, whose molars were exfoliated during treatment, or whose dental structures were difficult to visualize on the CBCT scans as a result of artifacts from the palatal expander were excluded.
The rapid maxillary expansion group initially comprised 28 subjects, but only 17 remained in the study (10 girls, 7 boys). Their mean age was 8.9 years, and they were treated with the rapid maxillary expansion protocol: a half turn (0.4 mm) per day. The palatal disjunctor was activated a full turn on the first day. Of the 31 subjects in the slow maxillary expansion group, only 16 were evaluated in the final sample (8 girls, 8 boys). Their mean age was 9 years, and they were treated with the slow maxillary expansion protocol: a half turn (0.4 mm) weekly. Upon cementation of the appliance, activation consisted of a half turn. The patients received a CBCT examination before orthodontic treatment (T1) and between 1 and 7 days after stabilization of the screw (T2). The appliances were not removed for the T2 examinations.
The CBCT examinations were performed with an i-CAT device (Imaging Sciences International, Hatfield, Pa) at 120 kV, 20 mA, and 14.7-second scan time. The images had a 0.25-mm thickness with 0.25-mm isotropic voxels. After acquisition, the images were saved in digital imaging and communications in medicine (DICOM) format and were built and manipulated in layers of 0.5 mm with OsiriX Medical Imaging 32-bit software (open source; Pixmeo, Geneva, Switzerland; www.osirix-viewer.com ). The same operator (M.B.) made all measurements; he was unaware of the group to which each patient belonged.
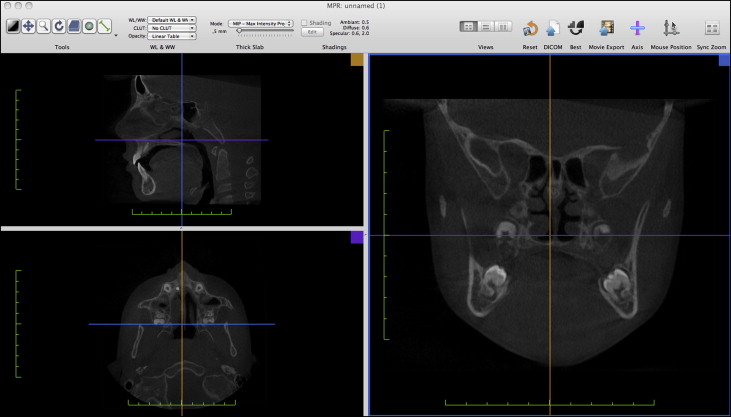
The tomographic analysis performed was similar to that proposed by Bernd. The long axis of the mesiobuccal root of the maxillary first permanent molar served as a reference for the standardization of CBCT slices made at T1 and T2. For this purpose, the images were initially viewed in the multiplanar reconstruction mode of the software. In this mode, there are 3 sections in 3 different windows (each corresponding to each plane of space) and 3 color lines ( Fig 2 ). Each color line relates to the scrolling of the tomographic cuts in a specific plane of space; eg, orange lines refer to the sagittal plane, purple lines refer to the axial plane, and blue lines refer to the coronal plane. To scroll for tomographic cuts in the sagittal plane, the orange line must be moved into the coronal or the axial section. The same process is valid for the other 2 lines.
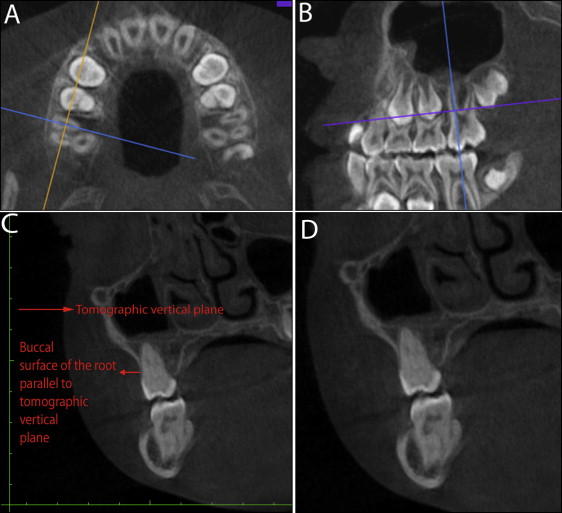
The first step of the method was the identification of the furcation region of the maxillary right first permanent molar in the axial section, where the buccal roots were slightly separated. In this image, the intersection of the orange and blue axes was positioned over the center of the mesiobuccal root, and the blue line was positioned following the direction of the buccolingual long axis of the root ( Fig 3 , A ). In the next step, the inclination of the blue line was adjusted in the sagittal section so that it passed through the center of the mesiobuccal root about its long axis ( Fig 3 , B ). Finally, in the coronal section, the position of this tooth was adjusted so that the buccal surface of the root was parallel to the tomographic vertical plane ( Fig 3 , C ). The same patterning process was also performed for the maxillary left first permanent molar. According to these criteria, a standard image was derived in the coronal section ( Fig 3 , D ): orthogonal to the axial and vertical plane described by the buccolingual axis of the mesiobuccal root.
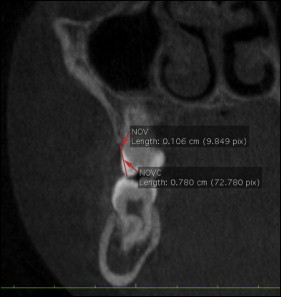
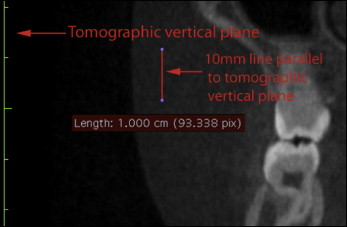
From the standard image in the coronal section, variables related to the height of the buccal alveolar bone (NOVC and NOV; Fig 4 , Table I ) were determined in full-screen mode. For measurements related to the thickness of the buccal bone plate, a vertical line 10 mm long was drawn parallel to the tomographic vertical plane ( Fig 5 ). The most inferior point of this line was superimposed on the buccal cementoenamel junction (CEJ). At this time, a horizontal line was traced perpendicular to and passing through the highest point of the vertical 10-mm line, determining the measurement of the CEJ 10 ( Fig 6 , A ; Table I ).
| Variable | Definition | Purpose |
|---|---|---|
| NOV (mm) | Distance between the buccal CEJ and the most occlusal point of the buccal alveolar crest | Alveolar bone height |
| NOVC (mm) | Distance between the buccal cusp tip and the most occlusal point of the buccal alveolar crest | Alveolar bone height |
| CEJ 3 (mm) | Distance between the outer surface of the buccal alveolar plate and the outer wall of the buccal root 3 mm above the CEJ | Alveolar bone thickness |
| CEJ 5 (mm) | Distance between the outer surface of the buccal alveolar plate and the outer wall of the buccal root 5 mm above the CEJ | Alveolar bone thickness |
| CEJ 10 (mm) | Distance between the outer surface of the buccal alveolar plate and the outer wall of the buccal root 10 mm above the CEJ | Tooth inclination |
| DC (mm) | Distance between the mesiobuccal cusp tips of the maxillary first permanent molars | Tooth displacement and inclination |
| DR (mm) | Distance between the most buccal points of the root canals of the mesiobuccal roots of the maxillary first permanent molars | Tooth displacement and inclination |
| AI (°) | Angle formed by the intersection of 2 lines traced toward the midline and tangent to both mesial cusp tips of each maxillary first permanent molar | Tooth inclination |
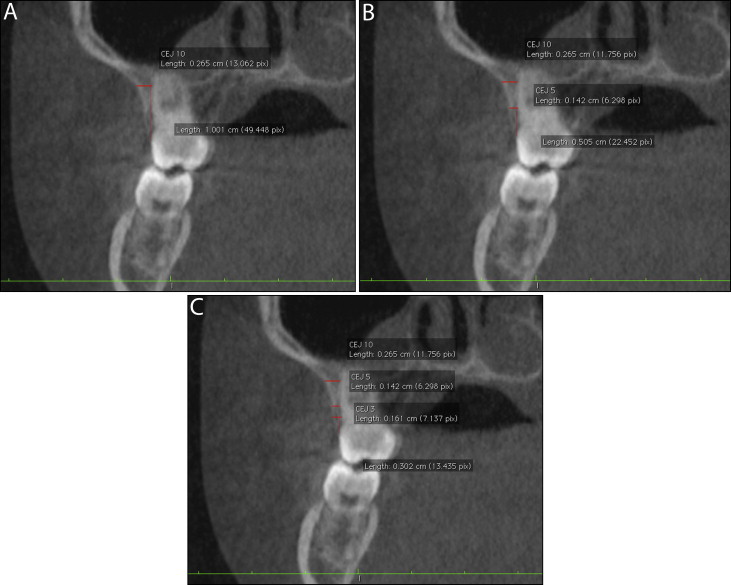
The vertical line was reduced to 5 mm and then 3 mm in length, each kept parallel to the vertical tomographic plane. Then, 2 new horizontal lines were outlined for each vertical line, determining the measurements CEJ 5 and CEJ 3, respectively ( Fig 6 , B and C , respectively; Table I ).
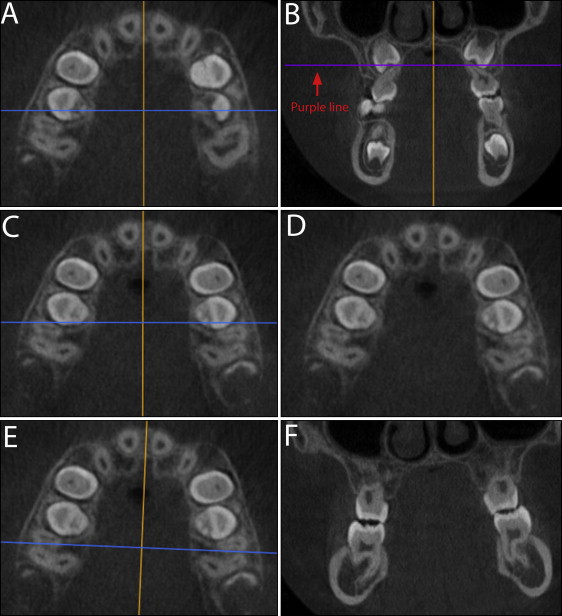
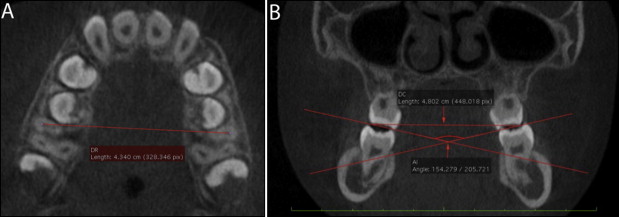
In this evaluative study, we also used quantitative analysis of the inclination of the first permanent molars. For this purpose, in the axial section, the furcation areas of the maxillary right and left molars, when both buccal roots were slightly separated, were determined. In case of unevenness between the teeth, the furcation area of the right molar was determined ( Fig 7 , A ), and leveling was accomplished by moving the purple line in the coronal section ( Fig 7 , B ). The resulting image in the axial section ( Fig 7 , C and D ) was used for determination of the DR measurement ( Fig 8 , A ; Table I ). Also, in the same axial image, the blue line was moved so that it passed between the mesiobuccal and distobuccal roots of the maxillary right and left first molars ( Fig 7 , E ). The derived image in the coronal section ( Fig 7 , F ) was used to determine the angle AI and measurement DC ( Fig 8 , B ; Table I ).
Statistical analysis
Statistical calculations were performed by using IBM SPSS software (version 20; SPSS, Chicago, Ill), with a P value less than 0.05 indicating statistical significance. The Wilcoxon matched-pairs test determined the intragroup statistical analysis between T1 and T2. Intergroup statistical analysis was determined by analysis of variance (ANOVA) of the differences of means between T1 and T2. Mean values between sides were considered for bilateral variables (NOV, NOVC, CEJ 3, CEJ 5, and CEJ 10). The power of the ANOVA test was also calculated, since the exclusion criteria reduced the sample size to 33 patients. The Spearman correlation test was used to detect any linear relationships between the variables.
For the systematic error investigation, 10 examinations of each group were randomly chosen, measured again after a minimum of 15 days, and analyzed by using an intraclass correlation coefficient (ICC).
Results
Means, standard deviations, ranges, and statistical analyses for each group at T1 and T2 are shown in Tables II and III . The differences of means and statistical analyses between groups are presented in Table IV .
| Variable | T1 | T2 | P | ||||
|---|---|---|---|---|---|---|---|
| Mean | SD | Minimum-maximum | Mean | SD | Minimum-maximum | ||
| NOV (mm) | 0.93 | 0.25 | 0.60-1.56 | 1.68 | 0.84 | 0.97-4.12 | <0.001 ∗ |
| NOVC (mm) | 7.85 | 0.52 | 6.85-8.81 | 8.64 | 0.92 | 7.13-10.67 | <0.001 ∗ |
| CEJ 3 (mm) | 1.98 | 0.59 | 0.89-3.16 | 1.10 | 0.56 | 0.00-2.37 | <0.001 ∗ |
| CEJ 5 (mm) | 2.42 | 0.88 | 1.01-4.19 | 1.82 | 0.87 | 0.48-3.54 | <0.001 ∗ |
| CEJ 10 (mm) | 5.18 | 2.05 | 2.23-8.86 | 5.95 | 2.13 | 2.5-10.02 | <0.001 ∗ |
| DR (mm) | 47.14 | 2.19 | 44.58-53.65 | 52.00 | 2.49 | 47.58-57.36 | <0.001 ∗ |
| DC (mm) | 49.92 | 1.84 | 47.51-53.79 | 59.19 | 2.70 | 55.21-63.96 | <0.001 ∗ |
| AI (°) | 158.17 | 9.80 | 138.91-178.18 | 145.29 | 8.93 | 117.22-155.26 | <0.001 ∗ |
| Variable | T1 | T2 | P | ||||
|---|---|---|---|---|---|---|---|
| Mean | SD | Minimum-maximum | Mean | SD | Minimum-maximum | ||
| NOV (mm) | 1.43 | 0.53 | 0.89-3.01 | 4.37 | 1.86 | 1.17-7.08 | <0.001 ∗ |
| NOVC (mm) | 7.87 | 0.81 | 6.80-9.98 | 11.15 | 2.17 | 7.52-14.66 | <0.001 ∗ |
| CEJ 3 (mm) | 1.68 | 0.58 | 0.43-2.75 | 0.31 | 0.45 | 0.00-1.33 | <0.001 ∗ |
| CEJ 5 (mm) | 2.18 | 0.71 | 1.05-3.65 | 0.69 | 0.59 | 0.00-1.90 | <0.001 ∗ |
| CEJ 10 (mm) | 5.65 | 1.73 | 4.16-10.33 | 3.84 | 1.96 | 1.72-9.62 | <0.001 ∗ |
| DR (mm) | 45.82 | 2.68 | 41.39-51.01 | 52.22 | 2.66 | 48.04-57.57 | <0.001 ∗ |
| DC (mm) | 48.75 | 3.16 | 44.08-53.59 | 57.78 | 3.27 | 51.80-62.68 | <0.001 ∗ |
| AI (°) | 155.62 | 13.52 | 127.24-179.69 | 147.75 | 14.34 | 116.98-167.33 | <0.001 ∗ |
Stay updated, free dental videos. Join our Telegram channel
VIDEdental - Online dental courses


