Introduction
Sagittal jaw growth is influenced during puberty by a ratio of androgens and estrogens. The CYP19A1 (formerly CYP19 ) gene encodes the cytochrome P450 enzyme aromatase (estrogen synthetase), which converts testosterone to estrogen. Genetic variations including single nucleotide polymorphisms might regulate CYP19A1 gene expression or the function of the aromatase protein and thus influence sagittal jaw growth.
Methods
The annual sagittal jaw growth in 92 pubertal orthodontic patients was determined by using pretreatment and posttreatment cephalometric radiographs. Single nucleotide polymorphisms rs2470144 and rs2445761 were genotyped and haplotypes constructed. Associations between genotypes or haplotypes and the annual sagittal growth were estimated by using JMP (version 9.0; SAS Institute, Cary, NC).
Results
Two single nucleotide polymorphisms were significantly associated with average differences in annual sagittal jaw growth in boys. Haplotype analysis demonstrated that haplotypes T rs2470144 T rs2445761 and C rs2470144 T rs2445761 had significant effects on annual sagittal maxillary growth and on mandibular growth in boys. No association was found in girls.
Conclusions
A quantitative trait locus that influences male pubertal sagittal jaw growth might exist in the CYP19A1 gene, and single nucleotide polymorphisms rs2470144 and rs2445761 might be inside this quantitative trait locus or be linked to it.
Growth and development of the maxilla and mandible are determined by genetic and environmental factors. Identification of these factors and mechanisms would help diagnosis, prediction, and treatment for skeletal variations. Single nucleotide polymorphisms and the haplotypes defined by common single nucleotide polymorphisms can be genotyped to determine normal and variable craniofacial phenotypes. Studies have found that single nucleotide polymorphisms (P561T, C422F, and I526L) in the growth hormone receptor gene are associated with mandibular ramus height in Japanese, Korean, and Chinese populations, and the P561T polymorphism has an inhibitory effect on mandibular growth in young children. Several single nucleotide polymorphisms have been found to be involved in mandibular prognathism. A polymorphism of the noggin gene (SNP rs1348322) was present in 4 families with mandibular micrognathia.
Estrogen is a key hormone for skeletal growth, maturation, and maintaining bone mass. An increase in serum estrogen promotes the pubertal growth spurt by (1) decreasing osteoclast formation and activity; (2) increasing osteoblast formation, differentiation, proliferation, and function; and (3) stimulating chondrogenesis.
Studies showing estrogen receptors in areas of the jaws including the condyles and palate support the importance of estrogen for jaw mass and growth. Aromatase (estrogen synthetase) catalyzes the final and rate-limiting step in the conversion of C 19 androgens (androstenedione and testosterone) to C 18 estrogens (estrone and estradiol); this makes it a key enzyme for estrogen biosynthesis in vivo. The CYP19A1 gene is about 123 kb in length, is located at chromosome 15q21.2, and encodes aromatase.
Several functional CYP19A1 single nucleotide polymorphisms have been described. Yang et al showed that a CYP19A1 gene polymorphism in intron 1 (SNP rs730154) was significantly associated with adult height variation. Another single nucleotide polymorphism, rs2470144, lies near the exon/promoter I.1 of the CYP19A1 , the activity of which is the basis for strikingly elevated levels of circulating estrogen in pregnant women. Single nucleotide polymorphism rs2445761 lies adjacent to the CYP19A1 promoter 2a. The single nucleotide polymorphisms rs2470144 and rs2445761 have already been found to be associated with variations in the onset of menarche. These findings suggest that rs2470144, and rs2445761 per se, or the functional loci in linkage disequilibrium with them, might be involved in regulating the transcription and expression of CYP19A1 . Linkage disequilibrium refers to the nonrandom associations among neighboring alleles. This means that a variation or DNA marker might serve as a marker for other genetic variations in the DNA that is close to the marker, as defined by ethnic-specific linkage disequilibrium “blocks” of DNA. Skeletal sexual dimorphisms, such as bone mass in men, and characteristics of the human face, such as the growth of the cheekbones, mandible, and chin, could be significantly affected by estrogen and testosterone.
To better predict and take advantage of the extent of pubertal jaw growth, it is important to understand the inherent genetic factors that influence it. In this study, we investigated the association between pubertal sagittal jaw growth and CYP19A1 rs2470144 and rs2445761 single nucleotide polymorphisms and haplotypes.
Material and methods
The study was approved by the board of ethics of Sichuan University in China. Participation was voluntary, and informed-consent documents were signed by all participants before they entered this study.
Ninety-two subjects were chosen from approximately 1000 posttreatment patients in the department of orthodontics from the West China Hospital of Stomatology in Chengdu from 2006 to 2009. The inclusion criteria were (1) adolescent patients who started fixed orthodontic treatment in cervical vertebral maturation stage 3 and finished it in stage 4 or 5; (2) Class I skeletal relationship (0° <ANB <5°); and (3) availability of pretreatment and posttreatment lateral cephalometric radiographs taken by the same digital cephalostat. Exclusion criteria were (1) use of a functional appliance or headgear; (2) use of Class II or Class III elastics for more than 3 months; and (3) incomplete treatment information or blurred radiographs. Cervical skeletal age was determined on lateral cephalometric radiographs based on the cervical vertebral maturation method. The ANB angle was ascertained by Winceph software (version 7.0; Rise, Sendai, Japan). Determinations of cervical stage maturation and skeletal relationship were initially done by 2 orthodontists (S.H. and Y.G.) separately, and discordant findings were then resolved by the 2 observers together.
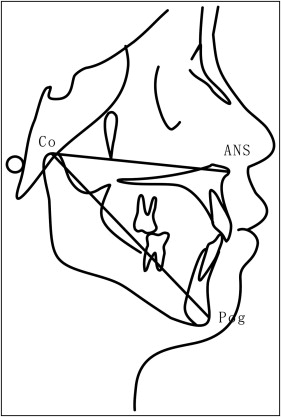
All lateral cephalometric radiographs were numbered with the patient’s name hidden. Maxillary and mandibular sagittal lengths (condylion to anterior nasal spine condylion to hard-tissue pogonion, respectively; Fig 1 ) were measured 3 times independently by the 2 investigators using the Winceph software, with the mean value used for analysis. Annual sagittal growth was calculated for each subject during the observation (orthodontic treatment) period.
Buccal swabs were collected for DNA extraction and genotyping by scraping firmly against the inside of each cheek 10 times with a sterile cotton-tipped stick. Each specimen was coded with a sample number. Genomic DNA was isolated by using a buccal swab DNA kit (Bioteke, Beijing, China) and stored at −80°C.
Real-time polymerase chain reaction (PCR) was performed with the iq5 Real-time Quantitative PCR instrument (Bio-Rad, Hercules, Calif) by using TaqMan single nucleotide polymorphism assays (Applied Biosystems, Forster City, Calif) to complete the genotyping. The probe sequences designed by Applied Biosystems were rs2445761:TAAATAGTAGAACTTGTGGGATCAA[C/T]GATAAACGGACATGGAACTGTTTTA and rs2470144:AGGCCAGCAAGGCCAGGGCCACTGA[C/T]GGAGGGAAATTTTACAAGGTAAACA. Each reaction mixture contained 10 μL 1x TaqMan Universal PCR Master mix, 0.5 μL 1x TaqMan SNP kit (probe/primer mix), 2 μL DNA obtained, and 7.5 μL DNase-free water in a final volume of 20 μL. Standard amplification conditions were 95°C for 10 minutes, 40 cycles of 92°C for 15 seconds, and 60°C for 40 seconds; 2 negative controls with sterile water as templates were used in each reaction plate. Allelic discrimination results were according to fluorescent signals from reporters VIC and FAM. The expected genotyping results were CC, CT, and TT for both single nucleotide polymorphisms.
Statistical analysis
Interobserver agreement of the determinations of cervical stage and skeletal relationship was assessed by using Cohen’s equation: kappa = PA – PE/1 – PE, where PA is the actual interobserver agreement rate and PE is the expected intraobserver agreement rate. The calculated kappa values were 0.918 and 0.907, respectively. U-tests of the 2 kappa values showed no significant difference ( P <0.01), indicating high consistency of the determinations.
The reproducibility of the cephalometric measurements was assessed by repeating them 1 month later in 40 randomly selected radiographs and calculated by using Dahlberg’s equation for method error: ME = <SPAN role=presentation tabIndex=0 id=MathJax-Element-1-Frame class=MathJax style="POSITION: relative" data-mathml='∑D2/2N’>∑−−√D2/2N∑D2/2N
∑ D 2 / 2 N
, where D is the difference between duplicated measurements and N is the number of repeated measurements. The errors for maxillary and mandibular length measurements were low, 0.10 and 0.16 mm, and 0.14 and 0.13 mm, on the pretreatment and posttreatment radiographs, respectively.
The chi-square test was used for the Hardy-Weinberg equilibrium of the genotype frequencies for each single nucleotide polymorphism. Linear regressions for the average increases in mandibular and maxillary sagittal length for each genotype in both sexes was performed with Prism 5 (GraphPad Software, San Diego, Calif). Linkage disequilibrium analysis was performed with SHEsis software. Haplotype construction was done with the phase 2.1 program. The associations between single nucleotide polymorphism genotypes or haplotypes and annual sagittal jaw growth in both sexes were analyzed by the least-squares method conducted by JMP (version 9.0; SAS Institute, Cary, NC) according to the following linear model: Yij = μ+ Gi (Hi) + Pj + eij, where Yij is the individual observation value, μ is the overall population mean, Gi is the effect of genotype, Hi is the effect of haplotype, Pj is the effect of initial jaw length, and eij is the random residual effect. A P value less than 0.05 was considered statistically significant.
Results
For the genotype distributions and linkage disequilibrium analysis, the sample consisted of 42 boys and 50 girls. Frequencies of rs2470144 genotypes were 12 CC (28.57%), 20 CT (47.62%), and 10 TT (23.81%) in the boys, and 14 CC (28%), 24 CT (48%), and 12 TT (24%) in the girls. The frequencies of rs2445761 genotypes were 8 CC (19.05%), 24 CT (57.14%), and 10 TT (23.81%) in the boys, and 10 CC (20%), 24 CT (48%), and 16 TT (32%) in the girls.
The genotype frequencies at the 2 single nucleotide polymorphisms in the sample population were both in the Hardy-Weinberg equilibrium (χ 2 = 0.1597; P = 0.689 >0.05 for rs2470144; and χ 2 = 0.2433; P = 0.622 >0.05 for rs2445761). Linkage disequilibrium analysis showed the 2 single nucleotide polymorphisms were in strong linkage disequilibrium (D′ = 0.833; γ 2 = 0.534). Haplotypes were constructed with estimated frequencies as shown in Table I . A summary of ages, observation times, and pretreatment jaw lengths in the genotype or haplotype groups is given in Table II .
| rs2470144 | rs2445761 | Estimated frequency | n ∗ | |
|---|---|---|---|---|
| Haplotype 1 | T | T | 0.4417 | 82 |
| Haplotype 2 | C | C | 0.4199 | 78 |
| Haplotype 3 | C | T | 0.1018 | 18 |
| Haplotype 4 | T | C | 0.0366 | 6 |
| Genotype or haplotype | Male | Female | ||||||
|---|---|---|---|---|---|---|---|---|
| Age (y) | Observation time (y) | Pre-Mx (mm) | Pre-Mn (mm) | Age (y) | Observation time (y) | Pre-Mx (mm) | Pre-Mn (mm) | |
| rs2470144 | ||||||||
| CC | 12.28 (0.59) | 2.54 (0.55) | 79.0 (2.5) | 97.5 (3.6) | 11.12 (0.75) | 1.95 (0.47) | 77.6 (5.0) | 97.1 (4.8) |
| CT | 11.71 (0.93) | 2.26 (0.61) | 78.8 (2.7) | 99.1 (4.0) | 11.51 (0.91) | 1.96 (0.35) | 76.9 (3.5) | 96.6 (2.8) |
| TT | 12.12 (1.51) | 2.31 (0.57) | 77.3 (3.7) | 97.3 (3.8) | 11.46 (0.58) | 2.07 (0.30) | 75.9 (3.6) | 96.1 (4.1) |
| rs2445761 | ||||||||
| CC | 11.93 (0.56) | 2.55 (0.39) | 79.6 (3.5) | 98.8 (4.2) | 10.93 (0.73) | 1.83 (0.39) | 78.5 (4.1) | 97.5 (4.3) |
| CT | 11.81 (0.92) | 2.30 (0.61) | 78.8 (2.3) | 98.8 (3.8) | 11.43 (0.90) | 2.00 (0.41) | 76.6 (4.3) | 96.7 (3.5) |
| TT | 11.84 (1.59) | 2.32 (0.64) | 76.9 (3.2) | 96.3 (3.3) | 11.60 (0.59) | 2.06 (0.28) | 76.2 (3.3) | 96.1 (3.7) |
| Haplotype 1 | ||||||||
| 0 | 12.16 (0.6 4) | 2.52 (0.49) | 79.0 (2.8) | 98.1 (3.7) | 11.12 (0.75) | 1.95 (0.47) | 77.6 (5.0) | 97.1 (4.9) |
| 1 | 11.64 (0.95) | 2.25 (0.63) | 78.7 (2.5) | 99.0 (4.0) | 11.51 (0.91) | 1.96 (0.35) | 76.9 (3.5) | 96.6 (2.8) |
| 2 | 11.61 (1.69) | 2.24 (0.62) | 76.9 (3.6) | 96.5 (3.6) | 11.46 (0.58) | 2.07 (0.30) | 75.9 (3.6) | 96.1 (4.1) |
| Haplotype 2 | ||||||||
| 0 | 11.73 (1.46) | 2.36 (0.59) | 77.2 (3.4) | 97.0 (3.5) | 11.60 (0.59) | 2.05 (0.28) | 76.2 (3.3) | 96.1 (3.7) |
| 1 | 11.85 (0.90) | 2.31 (0.60) | 78.9 (2.4) | 98.8 (3.8) | 11.43 (0.90) | 2.00 (0.41) | 76.6 (4.3) | 96.7 (3.5) |
| 2 | 12.07 (0.43) | 2.63 (0.48) | 80.0 (3.5) | 97.6 (4.8) | 10.93 (0.73) | 1.83 (0.39) | 78.5 (4.2) | 97.5 (4.3) |
| Haplotype 3 | ||||||||
| 0 | 11.64 (1.07) | 2.30 (0.57) | 78.6 (3.2) | 98.6 (4.0) | 11.31 (0.82) | 1.96 (0.36) | 76.9 (3.9) | 96.8 (3.5) |
| 1 | 12.44 (0.67) | 2.52 (0.61) | 78.2 (1.9) | 97.1 (3.0) | 11.81 (0.55) | 2.13 (0.42) | 76.3 (4.7) | 96.1 (4.8) |
| Haplotype 4 | ||||||||
| 0 | 11.84 (1.08) | 2.34 (0.60) | 78.4 (2.8) | 98.0 (3.8) | 11.39 (0.80) | 1.99 (0.37) | 76.8 (4.0) | 96.7 (3.7) |
| 1 | 12.34 (0.47) | 2.38 (0.53) | 79.4 (5.1) | 99.4 (5.7) | — | — | — | — |
| 2 | 11.25 (0.35) | 2.58 (0.00) | 79.0 (4.8) | 100.5 (3.4) | — | — | — | — |
Single nucleotide polymorphism association analysis ( Table III ) showed that boys with the rs2470144 genotype CC had significantly smaller average annual maxilla growth than those with genotypes CT and TT. For the mandible, the boys with the CC genotype had the smallest amount of average growth, and the boys with TT had the greatest average growth ( Table III ; Fig 2 , A ). Boys with rs2445761 genotypes CC and CT had significantly smaller average annual maxilla growth than those with genotype TT, and boys with genotype CC had the smallest average mandibular growth amount, and those carrying TT had the greatest ( Table III ; Fig 2 , B ). No significant difference was found in genotypic groups in the girls ( Table III ; Fig 2 , A and B ). Linear regression for the different genotypes is presented in Figure 3 .
| Genotype | Boys | Girls | ||||||
|---|---|---|---|---|---|---|---|---|
| Annual Mx growth (mm) | P value | Annual Md growth (mm) | P value | Annual Mx growth (mm) | P value | Annual Md growth (mm) | P value | |
| SNP 2470144 | 0.0026 ∗ | < 0.0001 ∗ | 0.7378 | 0.9481 | ||||
| CC | 1.8 (0.1)a | 2.5 (0.2)a | 1.9 (0.2)a | 2.8 (0.2)a | ||||
| CT | 2.3 (0.1)b | 3.3 (0.2)b | 1.7 (0.1)a | 2.9 (0.2)a | ||||
| TT | 2.5 (0.1)b | 4.1 (0.2)c | 1.7 (0.2)a | 2.8 (0.2)a | ||||
| SNP 2445761 | 0.0017 ∗ | < 0.0001 ∗ | 0.7448 | 0.9760 | ||||
| CC | 1.8 (0.2)a | 2.4 (0.2)a | 1.8 (0.2)a | 2.8 (0.2)a | ||||
| CT | 2.2 (0.1)a | 3.1 (0.1)b | 1.8 (0.1)a | 2.8 (0.2)a | ||||
| TT | 2.7 (0.1)b | 4.2 (0.2)c | 1.7 (0.2)a | 2.8 (0.2)a | ||||
Stay updated, free dental videos. Join our Telegram channel
VIDEdental - Online dental courses


