Introduction
The aims of this research were to test the repeatability and reproducibility of measurements obtained by different molar landmarks and to determine whether the treatment changes measured by them are comparable.
Materials
Pretreatment (T0) and postdistalization (T1) lateral cephalograms of 40 patients with a Class II molar relationship were used. Using the mesial cusp tip, distal crown contour, and centroid, 6 linear and 3 angular measurements were evaluated. The intraexaminer and interexaminer reliabilities were assessed with the Bland-Altman method. The T0 to T1 differences were compared by analysis of variance, followed by multiple comparisons with the Bonferroni adjustment.
Results
The greatest intraexaminer agreement intervals were correlated with centroid for tipping and vertical movement, and with distal crown contour for anteroposterior movement at T0 and T1. The narrowest interexaminer agreement intervals were observed with mesial cusp tip for all measurements and comparisons at both time points, except for the anteroposterior measurements at T1. Statistical significance was observed between the measurements made with mesial cusp tip and distal crown contour for tipping and with mesial cusp tip and centroid for distalization. For vertical movement, the treatment changes were statistically significantly greater with distal crown contour.
Conclusions
Mesial cusp tip was the most repeatable and reproducible landmark. Clinically unimportant differences were found in some comparisons of treatment changes obtained by different landmarks.
Highlights
- •
Measurements obtained by different molar landmarks were compared.
- •
Mesial cusp tip was the most repeatable and reproducible landmark.
- •
Treatment change values obtained by different landmarks were considered comparable.
Maxillary molar distalization is extensively used in the treatment of Class II malocclusions to create a Class I molar relationship. In recent years, many new intraoral noncompliance distalization appliances have been introduced, and the current research has focused on their effects and comparative evaluations. In the vast majority of these studies, molar movements have been quantified on lateral cephalograms using several molar landmarks. Some studies have used the mesial cusp tip or the distal crown contour, whereas others have preferred the center point of the clinical crown of the maxillary molars.
Although the use of different landmarks has been mentioned among the factors related to the heterogeneity of results in research studies about molar distalization, the findings of different studies have been compared and discussed under the assumption that treatment changes could be considered absolute values, and the effects of measurement points could be neglected. Without clarifying whether the same numbers of anteroposterior, axial, and vertical molar movements could be measured using different landmarks, it can be inconvenient to draw a reasonable conclusion from different studies regarding the appliances that produce the greatest molar distalization with the fewest side effects. Based on this premise, the aims of this study were to test the repeatability and reproducibility of measurements obtained by 3 molar landmarks and to determine whether the changes in the first molar position observed after distalization were comparable when measured with these landmarks.
Material and methods
This study was approved by the clinical research ethics committee of Gazi University in Ankara, Turkey, and written informed consent was obtained from all patients and their parents before treatment.
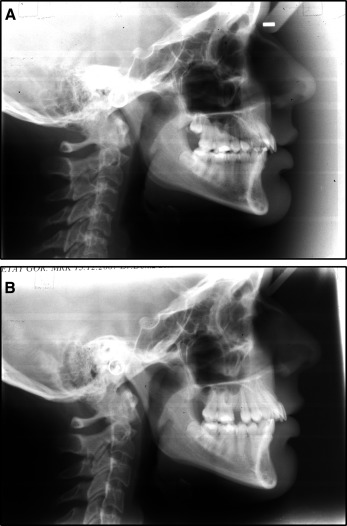
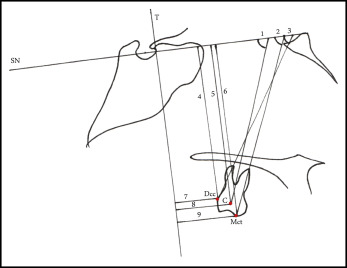
Good-quality and standardized pretreatment (T0) and postdistalization (T1) lateral cephalograms were used from 40 consecutively treated patients with Class II Division 1 malocclusions requiring maxillary molar distalization ( Fig 1 ). For distalization, a buccal system was used with nickel-titanium coil springs supported by miniscrews. Cephalometric images were superimposed using maxillary local superimpositions on the lingual curvature of the palate and the best fit on the maxillary bony structures ; subsequently, the horizontal (sella-nasion line) and vertical reference (T line) lines constructed on the T0 tracings were transferred to the T1 tracings by an author (D.U.). Molar landmarks were identified, and both the T0 and T1 radiographs were measured twice at separate sessions at least 3 weeks apart by an investigator (T.T.) and once by the other 2 investigators (D.U. and S.K.V.). Using the mesial cusp tip (Mct), distal crown contour (Dcc), and centroid (C) as molar landmarks, 6 linear (3 anteroposterior, 3 vertical) and 3 angular measurements were evaluated. For angular measurements, the mesial and distal root apices and furcation points were used with Mct, Dcc, and C, respectively, to form molar axes. The measurements and molar landmarks used in this study are shown in Figure 2 . In case of double projection of the molars, an average image was traced and used.


Statistical analysis
Intraexaminer reliability (repeatability) was assessed as the agreement between the first and second measurements of an author (T.T.), and interexaminer reliability (reproducibility) was assessed as the agreement between the measurements of all 3 authors using the Bland-Altman method through mean differences (bias), standard deviations, and 95% limits of agreement.
Vertical, anteroposterior, and axial changes (T0-T1) in molar positions after distalization, obtained by measurements using different landmarks, were compared by repeated-measurements analysis of variance (ANOVA), followed by multiple comparisons with the Bonferroni adjustment after the data were tested for normality using the Shapiro-Wilk test. The significance level was set at P <0.05. For this evaluation, the first measurements of the third author (T.T.) were used.
Results
Regarding intraexaminer agreement, the biases—the mean differences in anteroposterior, vertical, and axial measurements obtained by the same investigator at 2 time points—are shown in Table I . The greatest bias values were obtained with Dcc at T0 and with C at T1 for tipping; with C at T0 and Dcc at T1 for anteroposterior measurements; and with C for vertical measurements at both T0 and T1. The narrowest agreement intervals were observed with Mct for anteroposterior and vertical measurements and with Dcc for tipping at T0 and T1, whereas the greatest intervals were correlated with C for tipping and vertical movement and with Dcc for anteroposterior movement at the 2 time points ( Table I ).
| Mesial cusp tip | Distal crown contour | Centroid | ||||||||||
|---|---|---|---|---|---|---|---|---|---|---|---|---|
| Mean difference (SD) | Upper LoA | Lower LoA | AI | Mean Difference (SD) | Upper LoA | Lower LoA | AI | Mean Difference (SD) | Upper LoA | Lower LoA | AI | |
| Tipping | ||||||||||||
| T0 | 0.56 (1.14) | 1.72 | −2.84 | 4.56 | 0.65 (0.5) | 1.45 | −2.75 | 4.20 | 0.16 (2.35) | 4.86 | −4.54 | 9.40 |
| T1 | 0.56 (1.25) | 3.07 | −1.92 | 4.69 | 0.49 (1.11) | 1.74 | −2.71 | 4.45 | 0.91 (2.01) | 4.94 | −3.11 | 8.05 |
| Ant-post | ||||||||||||
| T0 | 0.06 (0.45) | 0.82 | −0.97 | 1.79 | 0.11 (0.81) | 1.51 | −1.74 | 3.25 | 0.19 (0.55) | 1.29 | −0.92 | 2.21 |
| T1 | 0.16 (0.40) | 0.96 | −0.64 | 1.6 | 0.24 (1.82) | 3.39 | −3.87 | 7.26 | 0.17 (0.51) | 1.20 | −0.86 | 2.06 |
| Vertical | ||||||||||||
| T0 | 0.05 (0.44) | 0.82 | −0.92 | 1.74 | 0.08 (0.62) | 1.31 | −1.16 | 2.47 | 0.19 (0.89) | 1.97 | −1.59 | 3.56 |
| T1 | 0.11 (0.46) | 1.03 | −0.81 | 1.84 | 0.06 (0.65) | 1.37 | −1.24 | 2.61 | 0.26 (1.12) | 1.98 | −2.50 | 4.48 |
Regarding interexaminer agreement, the mean differences in anteroposterior, vertical, and axial measurements of the 3 investigators are shown in Table II .
| Mesial cusp tip | Distal crown contour | Centroid | ||||||||||
|---|---|---|---|---|---|---|---|---|---|---|---|---|
| Bias (SD) | 95% LoA | AI | Bias (SD) | 95% LoA | AI | Bias (SD) | 95% LoA | AI | ||||
| UB | LB | UB | LB | UB | LB | |||||||
| 1st vs 3rd examiner | ||||||||||||
| Tipping | ||||||||||||
| T0 | 1.93 (1.16) | 0.4 | −4.25 | 4.65 | 1.96 (1.75) | 1.53 | −5.46 | 6.99 | 3.00 (3.17) | 3.36 | −9.36 | 12.72 |
| T1 | 1.00 (1.33) | 1.66 | −3.66 | 5.32 | 1.23 (3.48) | 5.73 | −8.18 | 13.91 | 1.63 (4.27) | 6.92 | −10.17 | 17.09 |
| Ant-post | ||||||||||||
| T0 | 0.13 (0.94) | 1.75 | −2.00 | 3.75 | 0.13 (1.44) | 2.99 | −2.75 | 5.74 | 0.04 (1.75) | 3.47 | −3.54 | 7.01 |
| T1 | 0.08 (0.79) | 1.50 | −1.65 | 3.15 | 0.18 (1.93) | 4.04 | −3.69 | 7.73 | 0.25 (0.63) | 1.51 | −1 | 2.51 |
| Vertical | ||||||||||||
| T0 | 0.53 (0.57) | 1.66 | −0.61 | 2.27 | 0.10 (0.67) | 1.44 | −1.24 | 2.68 | 0.50 (0.59) | 1.68 | −0.68 | 2.36 |
| T1 | 0.45 (0.53) | 1.51 | −0.61 | 2.12 | 0.28 (0.78) | 1.84 | −1.29 | 3.13 | 0.26 (1.09) | 2.44 | −1.92 | 4.36 |
| 2nd vs 3rd examiner | ||||||||||||
| Tipping | ||||||||||||
| T0 | 1.18 (1.07) | 0.95 | −3.31 | 4.26 | 1.47 (1.35) | 1.23 | −4.17 | 5.4 | 0.84 (2.62) | 4.39 | −6.07 | 10.46 |
| T1 | 0.48 (1.01) | 1.54 | −2.50 | 4.04 | 1.46 (1.23) | 1.01 | −3.92 | 4.93 | 0.02 (2.76) | 5.50 | −5.55 | 11.05 |
| Ant-post | ||||||||||||
| T0 | 0.24 (0.56) | 0.87 | −1.35 | 2.22 | 0.28 (0.97) | 1.67 | −2.22 | 2.89 | 0.03 (0.65) | 1.28 | −1.33 | 2.61 |
| T1 | 0.07 (0.64) | 1.35 | −1.21 | 2.56 | 0.35 (1.63) | 2.92 | −3.62 | 6.54 | 0.03 (0.41) | 0.84 | −0.79 | 1.63 |
| Vertical | ||||||||||||
| T0 | 0.15 (0.43) | 0.70 | −1.00 | 1.70 | 0.20 (0.54) | 0.88 | −1.28 | 2.16 | 0.26 (0.64) | 1.02 | −1.54 | 2.56 |
| T1 | 0.30 (0.44) | 0.57 | −1.17 | 1.74 | 0.09 (0.70) | 1.30 | −1.49 | 2.79 | 0.13 (0.46) | 0.80 | −1.05 | 1.85 |
| 1st vs 2nd examiner | ||||||||||||
| Tipping | ||||||||||||
| T0 | 0.91 (1.24) | 3.39 | −1.58 | 4.97 | 0.46 (1.43) | 3.31 | −2.40 | 5.71 | 1.30 (1.50) | 7.30 | −2.70 | 10.00 |
| T1 | 0.45 (1.23) | 2.91 | −2.01 | 4.92 | 0.80 (3.20) | 6.31 | −6.47 | 12.78 | 1.79 (3.82) | 9.43 | −5.86 | 15.29 |
| Ant-post | ||||||||||||
| T0 | 0.13 (0.45) | 0.77 | −1.03 | 1.80 | 0.31 (0.95) | 1.58 | −2.20 | 3.78 | 1.19 (1.62) | 3.44 | −3.06 | 6.5 |
| T1 | 0.01 (1.06) | 2.11 | −2.12 | 4.23 | 0.41 (0.67) | 0.93 | −1.75 | 2.68 | 0.39 (0.65) | 0.90 | −1.68 | 2.58 |
| Vertical | ||||||||||||
| T0 | 0.59 (0.49) | 0.40 | −1.57 | 1.97 | 0.25 (0.52) | 0.79 | −1.29 | 2.08 | 0.58 (0.54) | 0.50 | −1.65 | 2.15 |
| T1 | 0.84 (0.41) | −0.01 | −1.67 | 1.68 | 0.29 (0.70) | 1.11 | −1.69 | 2.80 | 0.41 (0.99) | 1.57 | −2.40 | 3.97 |
Stay updated, free dental videos. Join our Telegram channel

VIDEdental - Online dental courses


