Introduction
Our objective was to evaluate the nasal passage (NP) and oropharyngeal (OP) volumes of patients with different dentofacial skeletal patterns.
Methods
The study sample consisted of 140 patients (70 boys, 70 girls), divided into 3 groups as Class I (1 ≤ANB ≤3), Class II (ANB >3), and Class III (ANB <1), and then further divided into 4 groups as SNA angle ≥80°, SNA angle <80°, SNB angle ≥78°, and SNB angle <78° to evaluate how the positional changes in the maxilla and the mandible affect the OP and NP variables. Differences between groups were determined by using the Kruskal-Wallis test. Correlations between the variables were tested with the Spearman correlation coefficient. The linear multiple regression test was applied to create a model for the airway volumes separately.
Results
The OP volume of the Class II subjects (n = 50) was significantly lower when compared with that of the Class I (n = 46) and Class III subjects (n = 44). The only statistically significant difference for NP volume was observed between the Class I and Class II groups. The mean OP airway volume of subjects with retruded mandibular positions was statistically significantly smaller when compared with the subjects with higher SNB angles. The area of the most constricted region at the base of the tongue (minAx) had a high potential in explaining the OP volume, whereas the NP volume models were not as successful as the OP counterpart. However, minAx was also entered into the NP volume equations as an explanatory variable.
Conclusions
The OP airway volumes of Class II patients were smaller when compared with Class I and Class III patients. It was observed that mandibular position with respect to cranial base had an effect on the OP airway volume. The only significant difference for the NP volume was between the Class I and Class II groups, with a smaller volume observed for the Class II group.
From the late 1800s until now, the relationship between pharyngeal structures and dentofacial pattern has been intensively researched. Early research was mostly based on observational estimates, mainly because of insufficient medical instrumentation. However, the opinions that have arisen from these limited conditions are still being discussed. In the current literature, the nasal obstruction and its inseparable counterpart “mouth breathing” have been assumed to affect dentofacial growth. Although some researchers have found no association between airway adequacy and dentofacial morphology, it seems to be a general belief that the oropharyngeal (OP) and nasopharyngeal structures play roles in the development of the dentofacial complex. According to the functional-matrix hypothesis proposed by Moss, soft-tissue units guide the hard tissues to an extent. The studies of Linder-Aronson, Woodside and Linder-Aronson, and Solow and Greve are good examples for this hypothesis, where average craniofacial morphology of the “adenoid children” approached that of the control group subjects after adenoidectomy.
The etiology of malocclusions is believed to be multifactorial. It could be considered erroneous to associate malocclusions only with breathing mode. Since the airway is assumed to play a role in dentofacial development, several studies tried to correlate patients with normal nasorespiratory functions with different malocclusions and airway dimensions. Mergen and Jacobs used 40 patients aged 13 years ± 4 months to measure the size of nasopharynx between those with Class I occlusion and Class II malocclusion, and they concluded that the midsagittal nasopharyngeal area was significantly greater in subjects with normal occlusion than in those with Class II malocclusion. Martin et al tried to describe the nasopharyngeal patterns in patients with ideal occlusions and found that nasal fossa, cranial base, and adenoid tissue were larger in men than in women. The oropharynx, on the other hand, has attracted less attention in airway studies. Kirjavainen and Kirjavainen found that children with Class II malocclusion had a narrower oropharynx and hypopharynx than did the controls. However, de Freitas et al did not find a correlation between the upper pharyngeal airway and Class I and Class II malocclusion types. Trenouth and Timms studied the association between the functional OP airway and craniofacial morphology in 70 subjects between 10 and 13 years of age. They concluded that the length of the mandible was positively correlated with the OP airway size. Ceylan and Oktay classified 90 subjects according to their ANB angles and investigated pharyngeal size on lateral cephalometric headfilms. They found no statistically significant difference between their groups for nasopharynx size, but they found a negative correlation between ANB angle and OP size. Erdem and Arat obtained similar results. Maybe the only drawback of these studies was that they were conducted with 2-dimensional (2D) cephalograms, which might misrepresent a 3-dimensional (3D) structure.
The importance of the third dimension and the use of computed tomography (CT) have been emphasized as early as 1979, highlighting important limitations of 2D airway studies. Unfortunately, the high radiation dose of conventional CT devices might have been a limiting factor for routine use. Therefore, lateral cephalograms and sagittal area, angle, and length measurements are the preferred method of choice for airway studies. Cone-beam CT (CBCT) has become a well-accepted oral and maxillofacial diagnostic imaging technique in a short time, especially because of its lower radiation dose and faster image acquisition times compared with conventional CT. Although the CT technology is primarily aimed to visualize hard-tissue structures, it is also possible to render hollow structures such as the airway by using commercially available DICOM (digital imaging and communications in medicine) viewer programs.
The aims of this study were to evaluate (1) OP and nasal passage (NP) volumes of patients with normal nasorespiratory functions having different dentofacial skeletal patterns and (2) the correlations between different variables and the airway.
Material and methods
The experimental protocol used in this study was approved by the Case Western Reserve University Institutional Review Board. All subjects were obtained from the patient database of the Department of Orthodontics. The age range was 14 to 18 years. By entering the age range to the Ortho II ViewPoint software (Ortho II Computers Systems, Ames, Iowa), we inspected the complete medical records of 703 patients having pretreatment CBCT images. All CBCT images were taken with the CB Mercuray Scanner (Hitachi Medical Systems America, Twinsburg, Ohio) as a routine part of initial diagnostic records for orthodontic patients. All patients had signed a consent form allowing the use of their orthodontic records. All images were taken at 2 mA, 120 kV, and a 12-in field of view (F mode) setting. Each patient’s image data consisted of 512 slices, with a slice thickness of 0.377 mm, a resolution of 1024 × 1024 pixels, and 12 bits per pixel (4096 gray scale). The images were taken in natural head posture and maximum intercuspation position. Exclusion criteria included transverse deficiencies, severe hypodivergent growth pattern (FMA <19°), severe hyperdivergent growth pattern (FMA >31°), obese subjects according to their body mass index (BMI ≥30), congenital craniofacial deformities, pharyngeal pathology, nasal obstruction, history of snoring, obstructive sleep apnea, history of adenoidectomy, and scans showing incomplete imaging of the airway. To eliminate cephalometric variability, only self-reported white subjects were included in this study. After the application of exclusion criteria, 294 patients remained (155 Class I, 95 Class II, and 44 Class III). The power of the sample size was calculated by using the G ∗ Power 3 program (Institut für Experimentelle Psychologie, Düsseldorf, Germany), and it was determined that 140 subjects, considering all groups, would be needed to conduct this study with 90% power (α = 0.05). Subjects with Class III discrepancy were fewer compared with the Class I and Class II groups, so random exclusion for the Class I and Class II groups was done by using a name, initials, and sex list, and no angular, linear, area, or volumetric parameters were considered. Subjects were removed from the list one at a time from each gender for stratification. Finally, a total of 140 patients (70 boys and 70 girls) were included in our study sample. Lateral cephalograms obtained from CBCT data were opened with the Dolphin Imaging program (version 11.0, Dolphin Imaging and Management Solutions, Chatsworth, Calif) to collect 4 angular (FMA, ANB, SNA, and SNB) measurements ( Fig 1 ). All data were collected by an experienced operator (H.E.). The patients’ self-reported height, weight, and BMI were extracted from the medical and dental history form, and organized by using Excel software (Microsoft, Redmond, Wash).
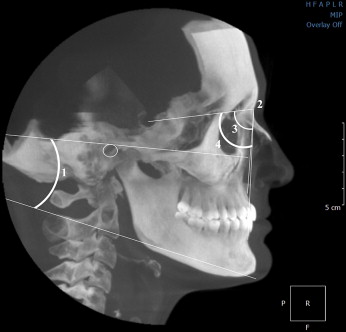
The patients were divided into 3 groups according to their ANB angles as Class I (1° ≤ANB ≤3°), Class II (ANB >3°), and Class III (ANB <1°). The SNA and SNB angles were used to determine the maxillary and mandibular position with respect to the cranial base: 80° for the SNA angle and 78° for the SNB angle were considered the normal positions of the maxilla and the mandible, respectively. The subjects were further divided into 4 groups—SNA angle ≥80°, SNA angle <80°, SNB angle ≥78°, and SNB angle <78°-to evaluate how the positional changes in the maxilla and the mandible affect the OP and NP variables. All measurements were made by an experienced orthodontist (H.E.).
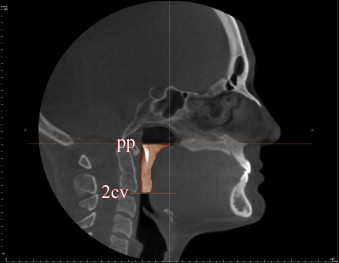
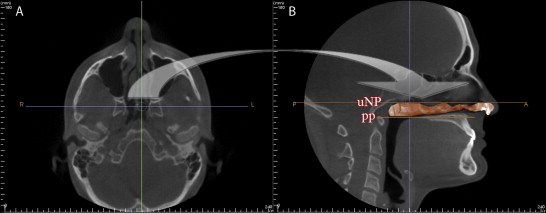
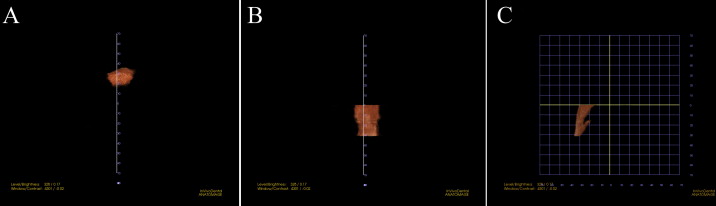
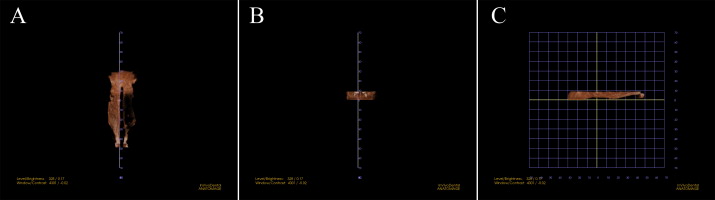
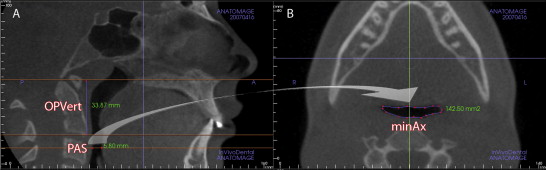
The InVivoDental (IVD) program (version 4.0, Anatomage, San Jose, Calif) was used to render the OP and NP volumes separately. For the OP volume, the superior and inferior limits were slightly modified from the limits used by Ogawa et al. OP volume was defined as the volume of the pharynx that is between the palatal plane (ANS-PNS) extending to the posterior wall of the pharynx and the plane parallel to the palatal plane that passes from the most anteroinferior point of the second cervical vertebrae ( Fig 2 ). The inferior limit of the NP airway was defined as the superior limit of the OP airway, and the superior limit was defined as the last slice before the nasal septum fused with the posterior wall of the pharynx. To better view this fusion, the superior border of the NP was defined on the axial slice first and then reflected to the sagittal plane ( Fig 3 ). The NP volume was rendered as a whole structure and included the nasopharynx, turbinates, and nares. The described airway volumes were rendered with the IVD program, according to the manufacturer’s recommendations ( Figs 4 and 5 ). The IVD program allows the user to “sculpt out” the desired airway volume from the rest of the 3D structure, and, by adjusting the brightness and opacity values, one can remove the unwanted voxels before calculating the final airway volume. The program also lets the user change the threshold values to obtain a solid airway volume. In addition to these volumetric measurements, the vertical length of the OP airway between the previously mentioned limits and the posterior airway space (PAS) (the most constricted space behind the base of the tongue and limited by soft tissues) was measured on the midsagittal slice ( Fig 6 ) for comparative purposes. Also, the sagittal line corresponding to the PAS region was opened on the axial slice, and the area of the most constricted region at the base of the tongue (minAx) was calculated ( Fig 6 ). The IVD program was used for the area and length measurements. All data were collected by an experienced operator (H.E.).
SPSS software (version 17.0, SPSS, Chicago, Ill) was used for all statistical analyses. In each group, means and standard deviations for age, skeletal variables, height, weight, BMI, and volumetric, area, and linear measurements for the OP and NP regions, were determined. The Kolmogorov-Smirnov test was used to check the normality of the OP and NP volumes. Because of the nonnormality of the distribution of the OP volume data, nonparametric tests were used. Differences between groups were determined by using the Kruskal-Wallis test. When the Kruskal-Wallis test was found to be significant, further pair-wise comparisons were done with the Mann-Whitney U test with the Bonferroni adjustment. The SNA and SNB subgroups were compared by using the Mann-Whitney U test. To check the correlations between the variables, the Spearman correlation was performed. A forward linear multiple regression test was applied to create a model for the OP and NP volumes of the groups and the total sample separately. A logarithmic transformation was applied to the OP volume data to be able to use a forward linear regression model. All measurements were repeated for 30 randomly selected subjects to test for reliability by using the intraclass correlation coefficient (ICC) for volumes and Dahlberg’s formula ( √Σd22n
Σ d 2 2n
) for linear, area, and angular measurements. The statistical significance was set at 0.05.
Results
The reliability results showed errors of 0.50 mm, 4.70 mm 2 , and 0.47° for linear, area, and angular variables, respectively, and ICC values of 0.99 for the OP and 0.97 for the NP volumes.
Descriptive demographics of our sample are given in Table I . The groups consisted of 46 Class I patients (23 boys, 23 girls), 50 Class II patients (25 boys, 25 girls), and 44 Class III patients (22 boys, 22 girls). There were 18 underweight (BMI <19) and 20 overweight (24.9 ≤BMI ≤29.9) subjects distributed homogeneously between the groups. OP variables (vertical OP length (37.66 ± 5.01 mm), PAS (9.8 ± 2.5 mm), minAx (200.0 ± 66.4 mm 2 ), and OP volume (8042.9 ± 2407.7 mm 3 ) of the Class III subjects were higher compared with the other groups, and the Class I subjects had the largest NP volume (6603.9 ± 2556.0 mm 3 ).
| Age (y) | FMA (°) | SNA (°) | SNB (°) | ANB (°) | Height (cm) | Weight (kg) | BMI (kg/m 2 ) | OP vertical length (mm) | PAS (mm) | minAx (mm 2 ) | OP volume (mm 3 ) | NP volume (mm 3 ) | |
|---|---|---|---|---|---|---|---|---|---|---|---|---|---|
| C I (n = 46) | |||||||||||||
| Mean ± SD | 15.6 ± 0.6 | 24.8 ± 2.7 | 81.3 ± 2.7 | 79.3 ± 2.9 | 2.1 ± 0.6 | 167.4 ± 7.9 | 62.1 ± 10.2 | 22.0 ± 2.6 | 37.3 ± 4.2 | 8.8 ± 2.5 | 190.3 ± 75.5 | 7762.3 ± 2783.7 | 6603.9 ± 2556.0 |
| Minimum | 14.5 | 20.5 | 72.4 | 70.7 | 1.0 | 149.0 | 47.7 | 18.7 | 24.7 | 3.5 | 71.5 | 4326 | 2243 |
| Maximum | 17.3 | 31.0 | 85.5 | 83.9 | 3.0 | 185.0 | 86.4 | 29.8 | 44.9 | 14.0 | 432.2 | 15324 | 15040 |
| C II (n = 50) | |||||||||||||
| Mean ± SD | 15.4 ± 0.6 | 23.3 ± 4.1 | 82.8 ± 3.2 | 77.7 ± 3.1 | 5.1 ± 1.3 | 167.2 ± 8.7 | 60.8 ± 11.4 | 21.7 ± 2.9 | 36.6 ± 5.2 | 8.7 ± 2.4 | 170.8 ± 65.6 | 6292.8 ± 2709.9 | 5304.1 ± 2325.2 |
| Minimum | 14.3 | 18.1 | 77.1 | 71.9 | 3.1 | 152.0 | 43.2 | 16.9 | 23.9 | 3.7 | 66.3 | 2086 | 1905 |
| Maximum | 16.9 | 32.4 | 90.0 | 84.4 | 8.4 | 198.0 | 97.7 | 29.0 | 46.4 | 13.3 | 351.1 | 15546 | 11866 |
| C III (n = 44) | |||||||||||||
| Mean ± SD | 15.4 ± 0.8 | 23.9 ± 4.1 | 80.6 ± 2.9 | 81.7 ± 3.3 | −1.0 ± 1.5 | 170.3 ± 7.9 | 62.3 ± 10.2 | 21.4 ± 3.0 | 37.7 ± 5.0 | 9.8 ± 2.5 | 200.0 ± 66.4 | 8042.9 ± 2407.7 | 5570.9 ± 1900.1 |
| Minimum | 14.2 | 18.0 | 75.8 | 76.7 | −5.5 | 157.0 | 45.9 | 17.1 | 27.1 | 3.8 | 68.8 | 4186 | 2174 |
| Maximum | 17.0 | 32.0 | 88.1 | 93.5 | 0.8 | 187.0 | 86.4 | 29.4 | 47.0 | 14.8 | 387.1 | 13691 | 10537 |
No airway variables were affected with regard to maxillary position ( Table II ). However, the mean OP airway volume of subjects with retruded mandibular positions was statistically significantly smaller when compared with the subjects with higher SNB angles. No difference was observed for the remaining variables with regard to mandibular position ( Table II ).
| SNA | OP vertical length (mm) | PAS (mm) | minAx (mm 2 ) | OP volume (mm 3 ) | NP volume (mm 3 ) |
|---|---|---|---|---|---|
| SNA ≥80° (n = 102) | |||||
| Mean ± SD | 36.9 ± 4.9 | 9.1 ± 2.5 | 185.2 ± 67.6 | 7375.3 ± 2759.9 | 5715.9 ± 2260.1 |
| Median (IQR) | 36.8 (6.7) | 9.1 (3.3) | 173.9 (101.5) | 7056 (3416.5) | 5123 (3023.3) |
| SNA <80° (n = 38) | |||||
| Mean ± SD | 37.8 ± 4.7 | 9.1 ± 2.5 | 189.7 ± 76.3 | 7192.3 ± 2713.0 | 6081.3 ± 2540.8 |
| Median (IQR) | 39.8 (6.4) | 8.9 (4.1) | 172.0 (100.0) | 6096 (3086.5) | 5717 (2812.3) |
| P | 0.207 | 0.886 | 0.802 | 0.601 | 0.386 |
| SNB | |||||
| SNB ≥78° (n = 98) | |||||
| Mean ± SD | 36.8 ± 4.8 | 9.2 ± 2.3 | 187.7 ± 63.7 | 7617.2 ± 2601.5 | 5843.9 ± 2163.1 |
| Median (IQR) | 37.2 (6.3) | 9.2 (3.3) | 174.5 (97.8) | 7142 (3387.0) | 5277 (2979.8) |
| SNB <78° (n = 42) | |||||
| Mean ± SD | 38.1 ± 4.7 | 8.8 ± 2.8 | 183.3 ± 83.2 | 6645.5 ± 2956.3 | 5747.8 ± 2724.5 |
| Median (IQR) | 39.8 (7.3) | 8.5 (3.8) | 157.2 (114.6) | 5839 (2491.0) | 5422 (3595.5) |
| P | 0.113 | 0.361 | 0.348 | 0.015 ∗ | 0.636 |
Differences between the groups and the pair-wise comparisons are shown in Table III . The age range of the sample was 14.2 to 17.3 years. The mean ages for boys and girls were 15.55 ± 0.7 and 15.36 ± 0.6 years, respectively. No statistically significant age differences were found between the groups, including intersex ages. Mean height, weight, and BMI were not statistically significant between the groups. There were statistically significant differences between the groups for the cephalometric variables, probably because of the different skeletal features of each group. In terms of 2D OP airway variables (vertical OP length, PAS, and minAx), the only statistically significant difference was between the Class II and Class III groups for the minAx value. The OP volume of the Class II subjects differed significantly compared with the Class I and Class III subjects. The only statistically significant difference for the NP volume was observed between the Class I and Class II groups.
| FMA (°) | SNA (°) | SNB (°) | minAX (mm 2 ) | OP volume (mm 3 ) | NP volume (mm 3 ) | |
|---|---|---|---|---|---|---|
| Mann-Whitney U test | ||||||
| C I (n = 45) | C II ∗ | NS | C II ∗ | NS | C II ∗ | C II ∗ |
| C III ∗ | ||||||
| C II (n = 51) | C I ∗ | C III ∗ | C I ∗ | C III ∗ | C I ∗ | C I ∗ |
| C III ∗ | C III ∗ | |||||
| C III (n = 44) | NS | C II † | C I ∗ | C II ∗ | C II † | NS |
| C II ∗ | ||||||
| Kruskal-Wallis test | 0.028 ∗ | 0.003 † | 0.000 ‡ | 0.046 ∗ | 0.000 ‡ | 0.014 ∗ |
Bivariate correlations are given in Table IV . SNB angle, height, OP vertical length, PAS, minAx, and NP volume were significantly positively correlated with OP volume. ANB angle was significantly negatively correlated with OP volume. NP volume was significantly positively correlated with the subject’s height, PAS, minAx, and OP volume. There was a significant negative correlation between OP vertical length and NP volume. The strongest correlations for the OP and NP volumes were with the minAx value. Stronger correlations were found for OP than NP volumes.


