Imaging is an important clinical aid for the diagnosis of endodontic bone lesions. Traditional radiology performs more accurately than any other diagnostic tool. Computed tomography has been used for the last 20 years with important implications in the management of lesions in bone. Among the newest systems, digital volume tomography is becoming a new standard and real-time echotomography is gaining an interesting space in the diagnostic field of endodontics. These techniques offer some advantages for the increased safety and the amount of detailed information they can provide.
Apical periodontitis (AP) is an infectious disease caused by bacteria (in association with viruses and fungi) residing in the root canal system (endodontium) of the affected teeth, and organized in a biofilm as a consequence of pulpal infection and necrosis. The pathogenesis of AP is due to the initiation of a nonspecific inflammatory response and a specific immunologic reaction of the host in the periradicular tissues (cementum of the tooth, periodontal ligament, and alveolar bone) in response to the infection coming from the endodontium. The establishment of this response is considered an attempt from the body to prevent the spread of the infection deep into the bone. As the disease proceeds it causes resorption of the periapical bone and its substitution with the inflammatory tissue. Clinical signs and symptoms that may be associated with the different stages of this pathologic condition are represented by soft tissue swelling, presence of a sinus tract, and pain on percussion of the tooth and on palpation of the periapical area. However, it is the presence of osteolytic lesions in the periapical/periradicular area of the maxillary bones that represents the clinical landmark of AP.
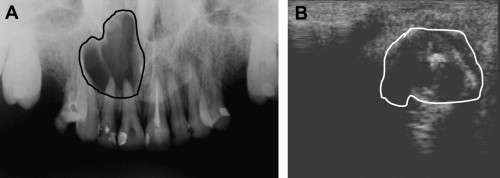
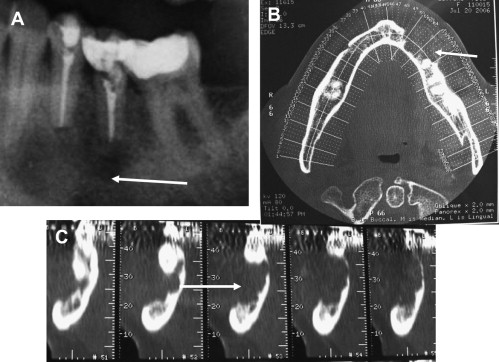
The changes in the mineralization and structure of the periapical bone that can be seen by radiographic techniques are the major indicator of the presence of AP and the progression of its healing ( Fig. 1 ).
From a histopathologic perspective, bone radiolucencies caused by AP may be distinguished as periapical cysts and granulomas. Furthermore, two kinds of lesions can be identified among periapical cysts; the true cyst (a cavity completely enclosed in its epithelial lining with no direct connection to the apical portion of the root canal) and the periapical pocket cyst (a cavity lined by epithelium that forms a collar around the apex of the involved tooth and that is consequently open to the root canal). According to the results from the most reliable studies in the recent literature, the prevalence of cysts among AP is 15% of which 9% are true cysts and 6% are pocket cysts. It has been suggested that true cysts may sustain persistent AP, therefore it is important to make a differential diagnosis between periapical lesions using clinical and radiographic techniques, even though histologic serial or semiserial sectioning of the whole lesion is considered the only reliable diagnostic method to date. Thus, diagnostic information will directly influence the clinical decisions on the management of periapical bone lesions.
An effective imaging system is required for the following purposes:
- 1.
Detection of all the lesions present in the maxillary bones.
- 2.
Disclosure of the anatomic coordinates of the lesions in the three spatial dimensions for diagnostic and treatment purposes (determine shape and measures of a lesion; determine the amount of cortical bone involved; visualize the relationship of a lesion with the root tip(s) and the anatomic landmarks in the bones).
- 3.
Orientation toward a differential diagnosis of the lesions of endodontic origin (ie, cysts vs granulomas) and of endodontic lesions versus other radiolucencies.
- 4.
Follow-up evaluation of the outcome of the treatment.
The information may be obtained by traditional radiology (intraoral periapical radiographs and panoramic radiographs), which has the limitation of being a two-dimensional representation of three-dimensional structures. Whenever further information is required, advanced imaging systems are needed.
Advanced imaging techniques
Advanced imaging systems that have become more and more helpful in the management of endodontic lesions are computed tomography (CT), cone beam volumetric tomography and ultrasound real-time echotomography. Each of these techniques has the specificity to enhance the diagnostic potential, increase the awareness of the anatomic details, make better differential diagnoses or investigate protocols.
CT and Dental CT
CT was introduced by Hunsfield in the 1970s and it provides imaging of soft tissues, bone, and vessels. With this technique the part of the body to be examined is divided into slices by fanning out of collimated roentgen rays. As the x-ray source rotates around the region of interest, multiple sensors detect the beam. These slices are layers consisting of volume elements known as voxels, whose height is determined by the selected thickness of the layer. The system measures the attenuation of the rays entering the anatomic structures located within these voxels from many different angles. The attenuation coefficients encountered by the rays passing through the anatomic structures (depending on the thickness and on the atomic number of the tissue elements) are detected and transformed into images. The values of attenuation coming from a linear or tangential direction are referred to as projections. The computer then reconstructs the part under observation into a series of cross sections or planes.
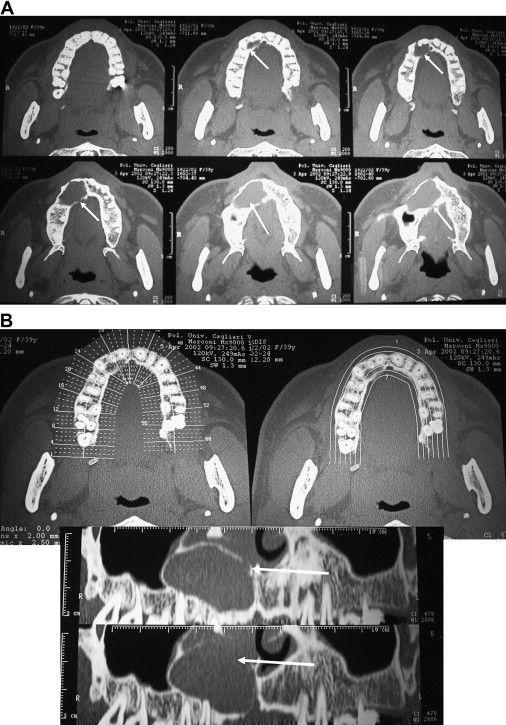
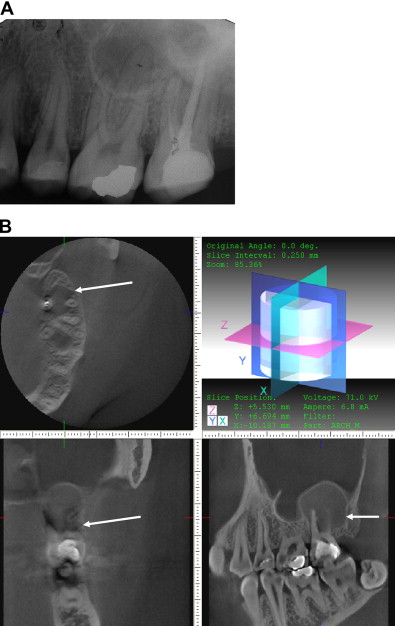
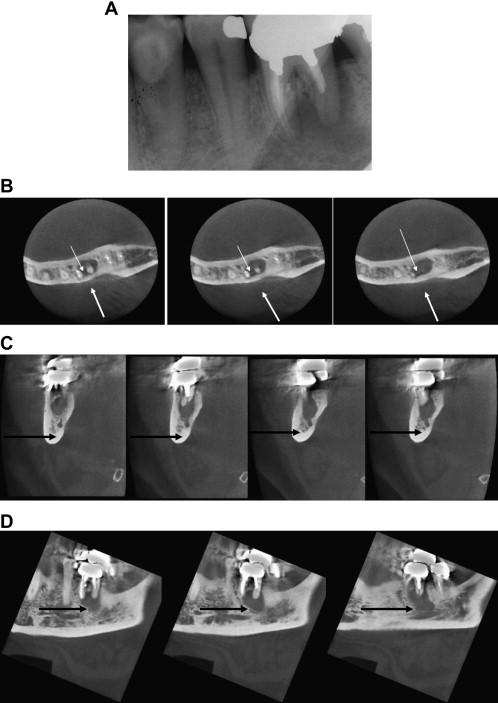
CT is widely used for the diagnosis of pathologic conditions in the maxillary bones. Using a specific protocol of investigation and software, dental CT is a procedure that permits a metric analysis of transverse sections of the jaws in three dimensions. In dental CT direct axial scans of the jaws are acquired using the highest possible resolution, and then secondary curved and orthoradial multiplanar tomograms are reconstructed by data computation. To avoid the influence of artifacts generated from metal restorations, the field of measurement can be positioned inferior to the occlusal plane in the jaw of interest. Conventional CT, spiral CT or multislice CT can be used for dental CT. A standard protocol for dental CT in the diagnosis of pathologic conditions of the jaws should use: slice thickness of 1.5 mm, table feed of 1.0, field of view (FOV, mandible) of 120 mm, FOV (maxilla) of 100 mm, scan time of 2 seconds, voltage of 80 to 120 kV, current of 25 to 100 mA, mandible base, and hard palate as scan planes. The data accumulated from the primary axial tomograms are transformed into multiplanar reconstructions using dental software. The indirect orthoradial reconstructions are calculated perpendicular to a planning line along the centreline of the jaw arch. The distance between each of the 40 to 60 cuts is 1.5 to 3.0 mm. The panoramic views and cross sections of the jaws reconstructed from the axial slices make it possible to measure distances and diameters, and to determine the thickness of the osseous structures. In each single jaw examination the axial scans are displayed followed by the dental reconstructions on a 1:1 scale including the planning line, the orthoradial lines, and the dental scans, which are numbered and correlated to the orthoradial reconstructions ( Figs. 2 and 3 ).
Tissue density is measured in Hounsfield units (HU) on a scale from −1000 to +3000 HU (water = 0 HU; air = −1000 HU). Bone ranges from 500 to 1300 HU (compact bone) to 100 to 240 HU (cancellous bone); soft tissue is approximately 40 HU.
The major concern related to dental CT is the high radiation dose required for average examinations; in the last few years dose reduction methods have been established. Reducing the tube current is an important step, followed by using 1.5-mm slice thickness. The spiral CTs (if used with pitch higher than 1), provide an optimum data set while drastically reducing the amount of radiation because they use continuous scanning to generate cross-sectional slices. In this examination the pitch indicates the slice thickness (in millimeters) and the rate at which the table is advanced (layers per rotation = mm/360°). By increasing the rotation speed and exposing several layers simultaneously, the exposure time and the radiation dose is reduced. An additional suggestion for dose reduction is to be specific about the area of interest for the investigation, selecting the upper or lower jaw and excluding all the occlusal scans.
Cone Beam Volumetric Tomography
Cone beam volumetric tomography (CBVT), also called digital volume tomography or cone beam CT, was developed to produce three-dimensional images of the maxillofacial region with scan time reduction and lower radiation dosage than medical-grade CT. The examination is produced using a narrow cone-shaped x-ray beam. The x-ray source and the sensor rotate synchronously between 180° and 360° around the head of the patient only once. The sensor can be either an image intensifier or a flat panel. The image intensifier can be coupled with a charged coupled device or with a complementary oxide semiconductor; the flat panel (thin film transistor) is the newest image receptor for solid large area arrays and it produces less distortion with a wider scale of contrast. The method of acquiring images in CBVT is different from medical CT. In CBVT, a single scan captures projection data in a volume and the voxels are consequently isotropic. A reconstruction algorithm then calculates the three-dimensional image of the original object. From this volume, tomographic slices from 0.125 mm thickness are displayed in 3 orthogonal planes. New slices can be also made in any direction. Three-dimensional image volume is represented in a cylinder or a sphere greater than 100 million voxels; some CBVT machines acquire larger data volumes than others. Depending on the FOV, limited CBVT can be distinguished from full CBVT. Limited CBVT creates a three-dimensional image volume in the range of 4 × 4 to 10 × 10 cm 2 with smaller isotropic voxels (0.125–0.2 mm), thus increasing the resolution and the accuracy of measurements. Image volumes in full CBVT range from 10 × 10 to 20 × 20 cm 2 (voxels = 0.2–0.4 mm). The dedicated viewer software of the CBVT system allows the clinician to examine the full volume together with the simultaneous axial, sagittal, and coronal views of the area of interest. The CBVT system obtained US Food and Drug Administration approval for dental use in the United States in 2000. There are now several CBVT systems on the market. The major difference between the systems is in the detector used and in the FOV. Depending on the CBVT, the patient can be examined in a seated, standing, or supine position. CBVT uses ionizing radiation and therefore the most common concern arising is the effective radiation dose on the patient. Most of the time CBVT yields a lower effective radiation dose than traditional CT. Exposure time can be reduced by using pulsating technology (making the beam-on time shorter than the scan time). The effective dose from digital panoramic radiographs ranges from 4.7 to 14.9 microSieverts (μSv), and the effective dose for a full mouth series is from 33 to 84 μSv. According to the literature, not all CBVT machines deliver the same radiation dose per examination. The amount of radiation can range from 2% to 23% of medical-grade CT and can be 4 to 42 times higher than a single panoramic radiograph (from 4.70 μSv to 134 μSv).
To minimize the radiation dose and depending on the region of interest, the clinician might use either a smaller FOV with betters details, thus requiring a higher mA, or a bigger FOV with lower resolution, thus requiring a lower mA. CBVT has been the object of numerous applications in the field of endodontics.
Ultrasound Real-time Echotomography
This widely used imaging system is based on the reflection of ultrasound waves. Ultrasound waves are generated as a consequence of the piezoelectric effect by a quartz or synthetic ceramic crystal when it is exposed to an alternating electric current of 3 to 10 MHz. Ultrasound waves oscillating at the same frequency are collimated by an acoustic lens and sent toward the area of interest in the body using a transducer, which is called an ultrasonic probe and contains a crystal.
Because the different biologic tissues in the body possess different mechanical and acoustic properties, the ultrasound waves at the interface between 2 tissues with different acoustic impedance undergo the phenomena of reflection and refraction. The echo is the part of the ultrasound wave that is reflected back from the tissue interface toward the transducer.
The transducer transforms the reflected ultrasound waves (echo) into electromagnetic waves of the same frequency, which are then transformed into images in a computer. The greater the difference in acoustic properties between 2 adjacent tissues, the higher is the intensity of the echoes originating from them. The ultrasound images seen on the computer monitor are produced by the movement of the crystal over the tissue of interest, which appear as a sequence of moving images (an average of 30 images per second). When the operator moves the probe on the examination area a change is created on the sector plane, thus producing a real-time three-dimensional image of that particular space.
If an area in a given tissue has high echo intensity, it is called hyperechoic and will appear as a white bright spot. Bone exhibits total reflection and is therefore hyperechoic. An area that has low echo intensity is called hypoechoic and appears as a darker image. An area that has no echo intensity it is called anechoic and appears very dark in the examination. Fluid-filled areas exhibit no reflection and are anechoic. Areas that contain different types of tissues show a dishomogeneous echo.
When applied to ultrasound examination, color power Doppler (CPD) flowmetry allows the presence and direction of the blood flow within the tissue of interest to be observed. The intensity of the Doppler signal is represented by changes in real time on a graph (Doppler) and is also shown in the form of color spots on the gray scale image (color). Positive Doppler shifts are caused by the blood moving toward the transducer and are represented in red, whereas negative Doppler shifts are caused by blood moving in the opposite direction and are represented in blue. Power Doppler is associated with color Doppler to improve its sensitivity to low flow rates. It is based on the integrated power spectrum, and can disclose the minor vessels. The use of contrast media by intravenous (IV) injections increases the echogenicity of the blood making the color power Doppler examination more sensitive. Ultrasound imaging is a safe technique; the biologic risk is much lower than that associated with radiographs because it does not use ionizing radiations. Potential adverse effects of ultrasound (caused by cavitation and vibration) depend on the length of time the ultrasound energy is applied; safety measures therefore limit the number of examinations.
Requirements for the detection and managemet of endodontic lesions
Detection of the Lesions in the Maxillary Bone and in the Mandible
A two-dimensional digital panoramic radiograph can often be enough for the preliminary visualization of the patient’s dentition and related bone pathosis, in particular, if the general condition of the teeth (caries, previous restorations) is within average. Periapical radiographs, taken in at least 2 different projections, will follow through to have a close up on selected teeth, check for the presence and extension of caries, view the condition of restorative work, and diagnose the possible lesion. Treatment of the affected tooth can thus be planned.
When the overall condition of the dentition is complex because of the existence of numerous caries, restorations, and root canal treatments, then the presence of undetected periapical pathosis might be suspected and an examination that will eliminate superimposition of teeth or surrounding structures in the area of interest is required. The same consideration is valid whenever there are periapical symptoms but the lesion(s) cannot be seen with conventional two-dimensional images. CT and CBVT are then indicated.
As a result of the high resolution achieved, dental CT and then CBVT have become significantly more effective than radiographs for the detection of periapical lesions in bone.
Velvart and colleagues correlated the presence of lesions diagnosed with CT and radiographs to the actual findings in the surgical field on 50 teeth selected for endodontic surgery. The 78 lesions found during the surgical procedure were visible on the CT scans, whereas only 61 of them were seen using conventional radiographs.
Stavropoulos and Wenzel used CBVT to examine experimental bone defects in pig jaws, and showed that this examination has a higher diagnostic accuracy than intraoral radiography, conventional and digital. Nakata and colleagues reported a case in which, only using CBVT, they were able to detect the presence of a periapical lesion in the root of a symptomatic maxillary molar, which had not been diagnosed with intraoral and panoramic radiographs.
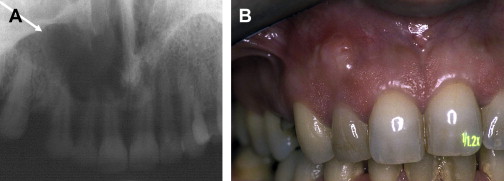
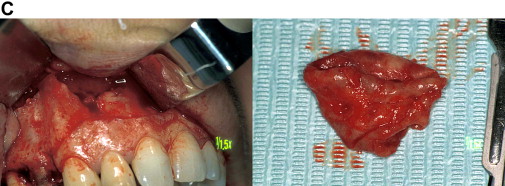
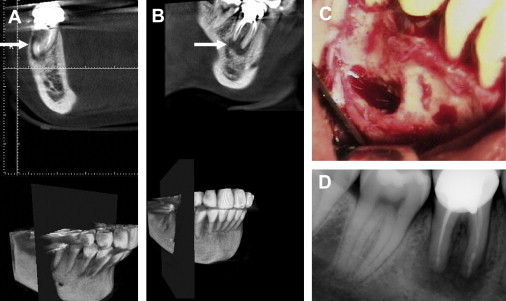
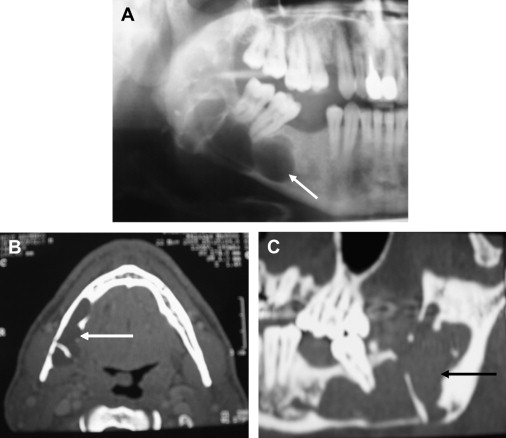
Lofthag-Hansen and colleagues in a very comprehensive clinical work conducted at the Public Dental Health Service in Goteborg reported that CBVT provided additional information not found on periapical radiographs. In particular, in 36 patients and a total of 46 teeth analyzed, periapical lesions were diagnosed in the same 32 teeth with both examinations. However, lesions were diagnosed in 10 more teeth with the CBVT images. Among these 10, 3 undetected lesions were considerably large, crossing the alveolar bone in the bucco-palatal direction and expanding into the maxillary sinus ( Fig. 4 ). Furthermore, when the lesions were correlated to individual roots, the same 53 lesions were diagnosed with both techniques and 33 more roots with lesions were seen using the volumetric tomography.
In another report 34% more lesions, particularly related to maxillary second molars or to roots in close proximity with the maxillary sinus, were seen using CBVT.
Similar results were found by Estrela and his group in 2 consecutive papers. In the first study on 888 patients, they compared the accuracy of CBVT, and panoramic and periapical radiographs for the detection of AP, finding that the overall sensitivity of periapical and panoramic radiographs was 0.55 and 0.28, respectively. In the second study, on 569 patients and 1014 teeth, AP was detected in 39.5% of the cases examined with the radiographs and in 60.9% of the cases screened with CBVT.
Disclosure of the Anatomic Coordinates of the Lesions in 3 Spatial Dimensions
Knowing the anatomic coordinates of a lesion in 3 spatial dimensions means:
- (a)
To be aware of the size of a lesion at different levels in the bone and in the multiple spatial projections
- (b)
To understand whether and where the cortical plates are involved or perforated by the inflammatory process
- (c)
To determine the position and divergence of the roots within the alveolar process of the maxillary bones and their involvement in a lesion
- (d)
To know the proximity of a lesion/root to vital anatomic landmarks such as the mandibular canal, mental foramen, incisal canal, and maxillary sinus.
An average of 70% more clinically relevant information (of outmost importance in endodontic presurgical planning) can be gathered with CT and CBVT than with traditional radiographs ( Figs. 1–6 ).
CT has been advocated as a preferential imaging system when looking for details not achievable using two-dimensional examinations such as the relation of the lesions to the buccal and the lingual cortical plates, and their size. The periphery of the osteolitic lesion can be easily identified and measured on the cross-sectional reconstructions. In the in vivo clinical study by Velvart and colleagues mentioned earlier, all the information achieved with high-resolution CT scans made it possible to evaluate the extent of the lesions and their precise position within the bone. The oblique cuts of the same CT scans also provided the predictable identification of the mandibular canal and its relationship with the lesions and the roots. The same information was not predictably obtained in all the cases examined using radiographs. The inferior alveolar nerve and the mental foramen in relation to the apex of mandibular premolars can also be precisely located with CBVT (see Fig. 5 ). The involvement of the roots/lesions with the sinus floor and their expansion into the maxillary sinus is another important concern when planning surgery, which can be overcome only using CT or CBVT (see Fig. 2 and 3 ). From these examinations it was possible to show that in 76% of first molars and in 50% of second molars the sinus floor was intertwined with the roots, and that it was approached by 30% of second premolar roots. The sinus was found between the buccal and the palatal root of the first molar in 25% of cases. In 32% of cases, maxillary root lesions perforate the sinus, and in 30% of the cases they are separated from the sinus by 1 mm of bone or less. The position and the size of the incisive foramen/canal have been determined with CT and CBVT with equal success.
The linear and three-dimensional measurements for the anatomic structures and volumetric measurements of osseous lesions taken with CBVT are considered accurate in vitro and in vivo. The mean horizontal distance of the palatal root of the first maxillary molars from the buccal cortical plate (mean distance = 9.73 mm) has been measured by CBVT to assess surgical access. Apico-marginal communications, which can be an important indication of the presence of a radicular fracture, are also more frequently detected by CBVT.
CBVT has been successfully used to evaluate the position of an instrument fractured in the maxillary sinus between the 2 buccal roots of an upper molar, and to plan orthograde and surgical treatment.
Some authors have even built a CBVT computer-aided design/computer-aided manufacturing guidance system for surgical endodontics.
Orientation Toward a Differential Diagnosis of Lesions of Endodontic Origin
Nonendodontic lesions in the jaws that may need to be differentially diagnosed from AP are lateral periodontal cysts, odontogenic keratocysts, dentigerous cysts, developmental cysts, central giant cell granuloma, traumatic bone cysts, and some forms of ameloblastoma. The differential morphology of radicular cysts, keratocysts, and dentigerous cysts has been described using CT examinations and might help in the diagnosis. Keratocysts and dentigerous cysts can exhibit multilocular or unilocular patterns. Dentigerous cysts are more frequently unilocular, but they are usually in association with the crown of an unerupted tooth. When unilocular, these lesions are more difficult to differentiate from endodontic lesions. On CT, keratocysts and dentigerous cysts tend to develop more into an oval shape and in a direction parallel to the long axis of the mandible. Dentigerous cysts may present with a local expansion of the cortical plate; keratocysts tend to show a discontinuity in the lingual cortex more often than radicular cysts, and are preferably located in the posterior body and ramus of the mandible. Radicular cysts are almost always unilocular, show discontinuity of the lingual cortex of the mandible less often, have a rounder shape, and can be surrounded by a sclerotic bone rim. Giant cell granuloma more often involves the mandible (anterior) and has the radiographic appearance of an irregular radiolucent area that may be unilocular or multilocular, and tends to resorb the roots of the involved teeth. When the lesions are small and unilocular they may simulate AP. They are distinguishable on CT because they are noncorticated ( Fig. 7 ).
Nasopalatine canal cysts and static bone cysts (Stafne cyst) are developmental nonodontogenic cysts. The nasopalatine canal cyst on panoramic radiographs is an oval- or heart-shaped radiolucent lesion located between the roots of maxillary central incisors. CT shows an enlargement of the nasopalatine canal on axial or coronal sections. Multiplanar and three-dimensional imaging may be important to show the extent of the lesion.
Static bone cyst is a depression in the lingual surface of the mandible between its angle and the first molar, below the mandibular canal. The cyst is occasionally found in the anterior mandible. It is caused by aberrant tissue of the submandibular gland, and on CT shows a well-circumscribed radiolucency in the lingual aspect of the mandible with the associated glandular tissue. The traumatic bone cyst is a pseudocyst, probably due to an infrabone hematoma. If detected early it contains blood, if later it appears as an empty cavity. On radiographs it is a well-defined radiolucent area, which does not cause interruption of the lamina dura of the teeth involved. On CT (axial scans) it shows expansion with scalloping of the cortical plate and, if present, its fluid content.
The ameloblastoma, more often found in the posterior mandible, appears as a well-defined multilocular or unilocular radiolucent area, which may be associated with resorption or displacement of the roots of the teeth involved. The differential diagnosis of periapical lesions is difficult if the lesion is unilocular. CT shows the expansion of the bone and it becomes important as a differential diagnostic tool in the follow-up of the lesion after an interval of 6 months to 1 year ( Fig. 8 ). Periapical cemental dysplasia (cemento-osseous dysplastic/reactive lesion) has an initial radiolucent phase, which makes it difficult to be distinguished from periapical lesions. Periapical cemental dysplasia is predominantly located in the mandible, and on axial CT scans they show radiopaque masses surrounded by low-density areas with no continuity with the cortical plate and the root of the teeth.
When diagnostic doubt refers to the possible presence of a malignancy, then CT is indicated and used in association with contrast media. If the differential diagnosis is between endodontic lesions, then the requirement is to make a distinction between a cyst and a granuloma. The pioneer application of CT to endodontic lesions came from Trope and colleagues in 1989. These authors selected 8 periapical lesions from human cadavers, which were divided into 4 cysts and 4 granulomas based on the diagnosis made by an oral radiologist. They examined the lesions in the jaws with a CT scan and axial slices, and used a densitometric processor to read the lesions and the surrounding tissues. The CT scan readings were then correlated to the histopathology. Of the 8 periapical lesions studied, 7 were granulomas and only 1 was a cyst. It was concluded that cystic cavities could be differentiated from granulomas based on their CT appearance. A cyst on axial CT scans displays an area with a density reading similar to the background, darker than a granuloma or the fibrous tissue of an apical scar. Granuloma has a cloudy appearance with a density similar to that of the surrounding soft tissues. In 1 case, within the same lesion it was possible to distinguish the granulomatous tissue from the cystic cavity inside it.
Controversial reports arise from the application of CBVT to the differential diagnosis of cystic lesions from granulomas. Simon and colleagues examined 17 lesions (1 cm × 1 cm or more) using CVBT to attempt a differential diagnosis between cysts and granulomas based on the measurement of gray values (−4096 gray scale) of the imaged lesion areas. The CBVT diagnosis and the traditional biopsy results coincided only in 13 cases out of 17; 4 cases had a split diagnosis. Frisbie and colleagues used CBVT to make a differential diagnosis between cysts and granulomas in 55 lesions. They based the study on the following parameters: (1) agreement between radiologists as to whether the CBVT image represented a cyst or a granuloma (gray values), (2) agreement between pathologists in deciding if the histopathologic specimen was a cyst or a granuloma, and (3) accuracy of the diagnostic assessment of radiologists using histopathology as the gold standard. The results showed that the pathologists were in high agreement whereas the radiologists were in low agreement and hence, differed in accuracy regarding the diagnosis. The authors concluded that CBVT is not sensitive enough to provide an accurate differential diagnosis among endodontic lesions. Schultze and colleagues reported that CBVT is helpful in the diagnosis of osteomyelitis of the mandible.
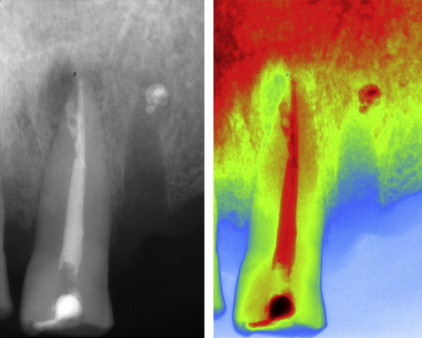
Ultrasound real-time echotomography has been used predictably to examine endodontic lesions in the jaws. In an initial study, the differential diagnosis between cystic lesions and granulomas was attempted based on an ultrasound examination complemented by CPD on 11 patients. The patients were diagnosed with periapical lesions and scheduled for endodontic surgery and biopsy. The established criteria to distinguish the 2 lesions were as follows: cyst, annaechoic/transonic, contoured cavity with reinforced walls (pasterior enhancement), fluid content, and no internal vascularization; granuloma, echogenic lesions of different shapes and contours showing vascular supply on CPD.
The provisional echographic diagnosis was compared with the results from the histopathologic examination, which was done after surgical excision of the lesions and semiserial sectioning. The histopathologic reports confirmed the ultrasound diagnosis in all 11 cases. The sensitivity of the technique was particularly enhanced in one case, which showed a mixed echographic appearance, mostly echogenic and vascularized with a well-contoured transonic area in the upper central area. The lesion turned out to be a granuloma containing a small cyst. This study was replicated by a group of researchers who analyzed 15 periapical lesions with echography, conventional and digital radiology, and routine biopsies. Their histology confirmed the ultrasound observations with respect to the underlying lesions, and the authors concluded that ultrasound unequivocally identified the contents and nature of the periapical lesions. A subsequent report on 2 lesions on the same patient, for which the initial diagnosis was done with ultrasound and then validated by the histology confirmed these findings ( Figs. 9 and 10 ). In a more recent paper another 22 radiolucent lesions of the jaws were examined with ultrasound and CPD, and with routine histopathology. The diagnosis of periapical granuloma made with the ultrasound was consistent with the biopsy reports. The lesions that were defined as cysts after the biopsy showed a more varied ultrasound appearance in this report. They were transonic in 5 cases, had a complex and semisolid appearance in 9 specimens (all without internal vascularization), and 1 case appeared as a vascularized solid lesion. Among the lesions histologically classified as cysts there were actually 4 keratocysts, 2 dentigerous cysts, 4 residual cysts, and 7 radicular cysts. These findings might explain why some of the cysts had a mixed fluid and solid content. Furthermore the one cyst that exhibited a solid appearance with internal vascular supply had a very thick capsule and extensive inflammatory content.